
0 ITEMS

Co-operative Bank Financial Model Excel Template
The Co-operative Bank Financial Model is a ready-to-use financial model template designed to help founders, member-owned financial institutions, consultants, analysts, and planning teams evaluate the financial feasibility of launching or expanding a co-operative bank. Instead of relying on a generic banking spreadsheet, this model focuses on the drivers that matter for a co-operative banking structure, including member deposits, loan portfolio growth, interest income, cost of funds, non-interest income, startup costs, operating expenses, payroll, liquidity, and profitability. This template supports structured financial planning by connecting revenue assumptions with the underlying banking activity that creates those revenues. Users can model loan balances, deposit funding, yields, interest expense, service fees, staffing needs, branch costs, technology costs, and other operating assumptions over a multi-year forecast. It is useful for preparing business plans, internal budgets, funding documents, board presentations, feasibility studies, and strategic planning materials where a clear view of revenue, cash flow, profitability, and capital needs is required. Built for entrepreneurs, co-operative banking founders, business owners, financial consultants, and analysts, the model gives users a practical framework for understanding how changes in loan growth, deposit mix, payroll, operating expenses, and pricing assumptions affect financial outcomes. It helps users estimate startup investment, forecast monthly and annual cash flow, review profit and loss performance, assess break-even timing, and test whether the bank can sustain its operations while meeting growth and liquidity objectives. The Co-operative Bank Financial Model is fully editable and compatible with Microsoft Excel and Google Sheets, allowing users to customize assumptions for their own market, member base, loan products, deposit rates, staffing plan, and expansion strategy. With built-in outputs, professional reporting formats, charts, performance metrics, and decision-making tools, it helps turn a complex banking idea into a clear financial forecast that can be shared with stakeholders, investors, lenders, regulators, board members, and internal teams.


Financial Model Overview
The Co-operative Bank Financial Model is a structured financial model template built for planning, launching, evaluating, or expanding a member-owned banking institution. A co-operative bank has a different operating logic from a standard commercial business because its performance depends on deposit growth, loan portfolio expansion, net interest income, capital planning, liquidity management, operating efficiency, and member-focused services. This template brings those assumptions together in one editable model so entrepreneurs, founders, consultants, analysts, and planning teams can forecast how the bank may perform over time.
It helps users estimate revenue, cost of funds, payroll, startup investment, operating expenses, cash flow, profitability, and key banking ratios without building a complex model from scratch. The model is useful for business plans, feasibility studies, funding discussions, board presentations, internal planning, and stakeholder decision-making because it translates assumptions about members, deposits, loans, interest rates, staffing, technology, and growth into a clear financial forecast.
All-in-One Dashboard
The all-in-one dashboard gives users a central view of the Co-operative Bank Financial Model by bringing together the core inputs and core outputs in one practical planning area. This component is designed to help users move quickly between the assumptions that drive the model and the results that matter most for decision-making. Inputs may include loan growth, deposit balances, interest rates, member activity, fee income, payroll assumptions, operating costs, and capital spending, while outputs may include revenue, expenses, profit, cash flow, liquidity indicators, and headline banking metrics.
For a co-operative bank, this is especially useful because users need to understand how member deposits, loan balances, funding costs, and operating capacity interact. The dashboard helps founders, analysts, and consultants review the overall financial picture without getting lost in individual worksheets, making it easier to validate assumptions, identify pressure points, and prepare a clear summary for investors, board members, lenders, regulators, or internal stakeholders.
Low, Base, and High Scenario Analysis
The low, base, and high scenario analysis section helps users compare different possible outcomes for the co-operative bank under conservative, expected, and optimistic assumptions. This component is valuable because banking forecasts are highly sensitive to loan growth, deposit acquisition, interest rate spreads, operating costs, credit demand, and market conditions. Users can adjust scenario assumptions such as member growth, average deposit balances, loan origination volume, product mix, net interest margin, fee income, staffing pace, and expense inflation to understand how the financial model responds.
The output helps show how revenue, profitability, cash flow, and capital requirements may change if growth is slower than expected, if the base plan is achieved, or if demand exceeds expectations. For business planning and funding preparation, this section supports better decision-making by giving stakeholders a realistic range of outcomes rather than a single forecast. It can also help management teams prepare contingency plans, evaluate risk, and communicate the assumptions behind their strategy more clearly.
Professional Charts
The professional charts component converts the financial forecast into visual outputs that are easier to interpret, present, and discuss. Instead of relying only on rows of numbers, users can view trends in revenue, profitability, loan balances, deposit growth, cash flow, expenses, and other key financial results through presentation-ready charts and graphs. This is particularly helpful for a co-operative bank because stakeholders may need to understand how the institution builds scale over time, how net interest income grows as the loan portfolio expands, and how operating costs compare with revenue development.
The charts can support board meetings, investor conversations, lender presentations, member communications, and internal planning reviews by highlighting the direction and timing of major financial changes. Inputs flow from the model’s assumptions and calculations, while outputs provide visual summaries that make it easier to identify growth patterns, cost pressures, liquidity movements, and profitability milestones. This component helps users communicate complex financial projections in a clear and professional way.
ROE Components and DuPont Analysis
The ROE components and DuPont analysis section helps users understand the drivers behind return on equity rather than treating profitability as a single headline number. For a co-operative bank, return on equity is influenced by operating performance, asset utilization, leverage, interest spreads, expense control, and capital structure.
This component breaks the analysis into more practical elements so users can see whether financial performance is being driven by stronger margins, better efficiency, a larger asset base, or changes in equity funding. Inputs may include net income, revenue, total assets, equity, loan balances, operating expenses, and other financial statement outputs.
The resulting analysis helps founders, consultants, and analysts evaluate whether projected returns are supported by realistic banking economics. It is useful for board-level decision-making because it explains how management actions, such as improving loan yields, reducing funding costs, growing deposits, controlling overhead, or adjusting capital levels, can affect member value and institutional sustainability over time.
Revenue Inputs
The revenue inputs section is where users define the commercial assumptions that drive income generation for the co-operative bank. Unlike a simple sales forecast, banking revenue depends heavily on the size and mix of earning assets, the interest rates earned on loans and investments, the cost of member deposits, and the level of non-interest income from service fees and related banking activities. This component may include assumptions for mortgage loans, auto loans, business loans, consumer loans, investment securities, average balances, portfolio growth, yields, deposit rates, and service fee income.
By adjusting these assumptions, users can estimate net interest income, total revenue, and revenue growth across the forecast period. This is useful for planning because it helps users test whether the expected member base and lending activity can support the bank’s operating structure. It also supports funding discussions and feasibility analysis by showing the assumptions behind the revenue forecast and allowing users to refine them for their own market, product strategy, and member acquisition plan.
Bank-Ready Reports
The bank-ready reports component organizes forecast results into professional financial outputs that are suitable for review by lenders, investors, board members, consultants, regulators, and internal decision-makers. These reports help translate the model’s detailed assumptions into structured summaries such as projected income statements, balance sheet views, cash flow outputs, and performance summaries.
For a co-operative bank, clear reporting is important because stakeholders need to evaluate profitability, liquidity, capital planning, operating efficiency, loan portfolio growth, and deposit funding in a consistent format. Inputs are drawn from the full financial model, including revenue assumptions, cost assumptions, payroll, startup spending, financing, assets, liabilities, and equity. The outputs help users prepare business plans, funding packs, feasibility studies, and internal planning documents without manually rebuilding financial statements.
This component is useful because it creates a more credible and organized presentation of the financial forecast, making it easier for stakeholders to understand the plan, review the numbers, ask informed questions, and make decisions based on structured financial evidence.
Revenue Breakdown
The revenue breakdown section provides a more detailed view of the income streams inside the Co-operative Bank Financial Model. Instead of presenting revenue as one combined total, this component helps users understand how different sources contribute to the overall forecast, including interest income from loan portfolios, interest from investment securities, and non-interest income from fees and services. Users can evaluate how much revenue is generated by mortgages, auto loans, business lending, consumer lending, treasury investments, transaction fees, account fees, or other member services depending on how the model is customized.
This is useful because each revenue stream may have different margins, growth rates, risk levels, and operational requirements. The output helps users see whether the bank is overly dependent on one income source or whether the revenue mix is balanced enough to support long-term sustainability. It also helps management refine pricing, product strategy, marketing priorities, and member service offerings by showing which activities are expected to drive the strongest financial contribution.
KPI Dashboard
The KPI dashboard gives users a focused view of the key performance indicators that matter most for a co-operative bank. This component can include metrics such as net interest margin, return on assets, return on equity, loan-to-deposit ratio, efficiency ratio, liquidity indicators, capital adequacy measures, revenue growth, expense ratios, payback period, and profitability milestones.
Inputs come from the wider model, including financial statements, loan balances, deposit assumptions, operating expenses, capital structure, and cash flow projections. The output helps users evaluate whether the bank is performing in line with expectations and whether assumptions remain realistic when compared with industry benchmarks or internal targets.
For planning and decision-making, this section is valuable because it goes beyond raw financial statements and highlights the ratios that stakeholders often use to judge banking performance. It helps founders, analysts, and board members quickly identify strengths, weaknesses, and areas that may require strategic adjustment, such as improving margins, controlling expenses, growing deposits, or strengthening liquidity.
Break-Even Analysis
The break-even analysis section helps users identify when the co-operative bank may reach the point where revenue is sufficient to cover operating costs and begin generating sustainable profit. This component uses assumptions from revenue, cost of funds, payroll, rent, technology, marketing, administrative expenses, and other operating costs to estimate the timing and conditions required for break-even.
For a co-operative bank, break-even is affected by the speed of member acquisition, the pace of deposit growth, loan portfolio size, net interest margin, fee income, and the fixed cost structure required to operate safely and professionally. The output may show the break-even month, required revenue level, required loan balance, required deposit volume, and the relationship between fixed costs and contribution from income-generating activities.
This is useful for funding preparation and strategic planning because it gives users a clear target for financial sustainability. It also helps management understand which assumptions matter most if break-even appears delayed, allowing them to adjust pricing, staffing, marketing, branch costs, technology spending, or growth targets before committing resources.
Startup Cost and Funding Requirements
The startup cost and funding requirements section helps users estimate the initial investment needed to prepare the co-operative bank for operations before it generates meaningful revenue. This component may include branch build-out, core banking software, digital banking platform development, licenses, professional fees, compliance setup, technology infrastructure, cybersecurity tools, office equipment, pre-launch payroll, marketing, deposits, reserves, and working capital.
Inputs can be customized to reflect the user’s market, launch strategy, operating model, and regulatory environment. The output helps show total startup capital required, timing of cash needs, funding gaps, and the amount of capital that may be needed to support the bank through its early operating period.
This is especially important for a co-operative bank because initial spending must be planned alongside liquidity, capital adequacy, operational readiness, and member trust. By organizing startup costs in a clear structure, the model helps users avoid underestimating launch requirements, prepare stronger funding documents, and make more informed decisions about phasing, financing, and resource allocation.
File types:
Excel – Single-User: .xlsx
Excel – Multi-User: .xlsx
Similar ProductsOther customers were also interested in...

 HenrySheykin
Boutique Hotel Financial Model Excel Template
The Boutique Hotel Financial Model Financial Model Template helps entrepreneurs, hotel owners, consu... Read more
Hotel Financial Model Excel Template
The Hotel Financial Model helps users build a structured financial forecast for a hotel business usi... Read more
Restaurant Financial Model Excel Template
" The Restaurant Financial Model helps users turn a restaurant concept into a structured, editable f... Read more

Fintech Financial Model Excel Template
The Fintech Startup Financial Model helps founders, analysts, consultants, and business planners tur... Read more
Medical Practice Financial Model Excel Template
The Medical Practice Financial Model helps users turn a clinic concept, expansion plan, or healthcar... Read more
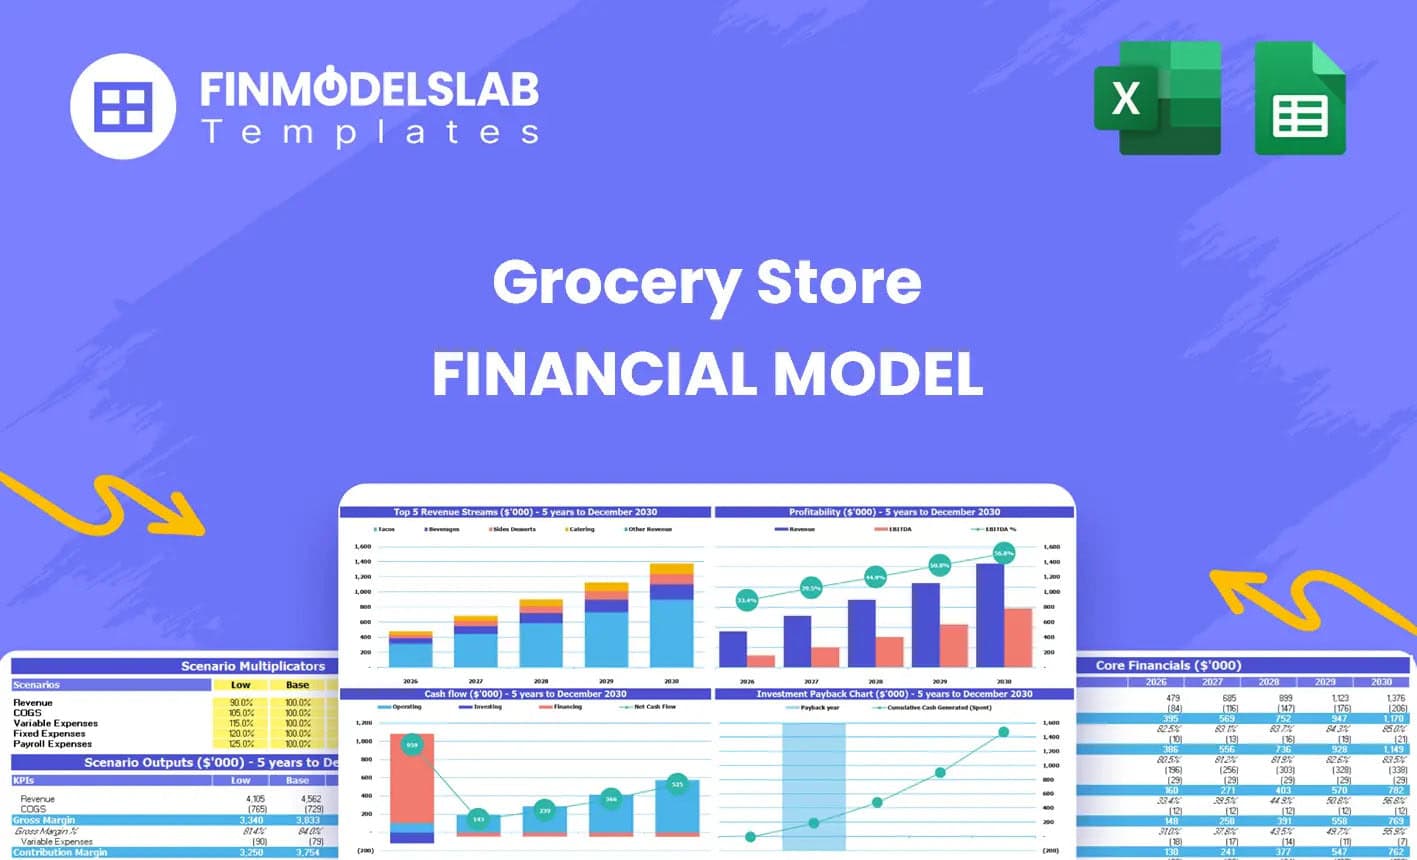
Grocery Store Financial Model Excel Template
The Grocery Store Financial Model helps entrepreneurs, founders, consultants, analysts, and retail b... Read more
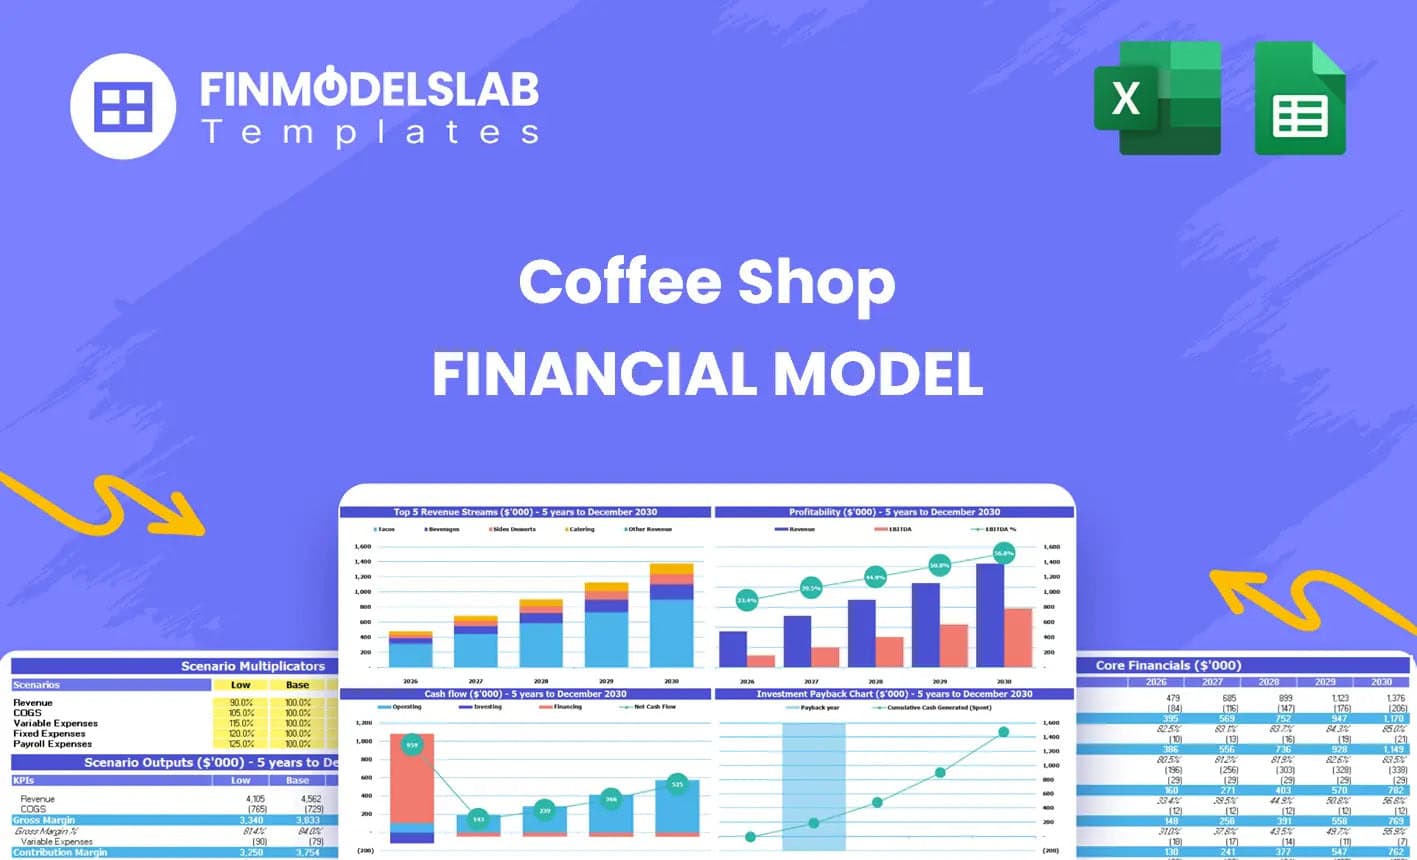
Coffee Shop Financial Model Excel Template
The Coffee Shop Financial Model helps entrepreneurs, founders, business owners, consultants, and ana... Read more

Online Bank Financial Model Excel Template
The Online Bank Financial Model Financial Model Template helps founders, fintech entrepreneurs, cons... Read more
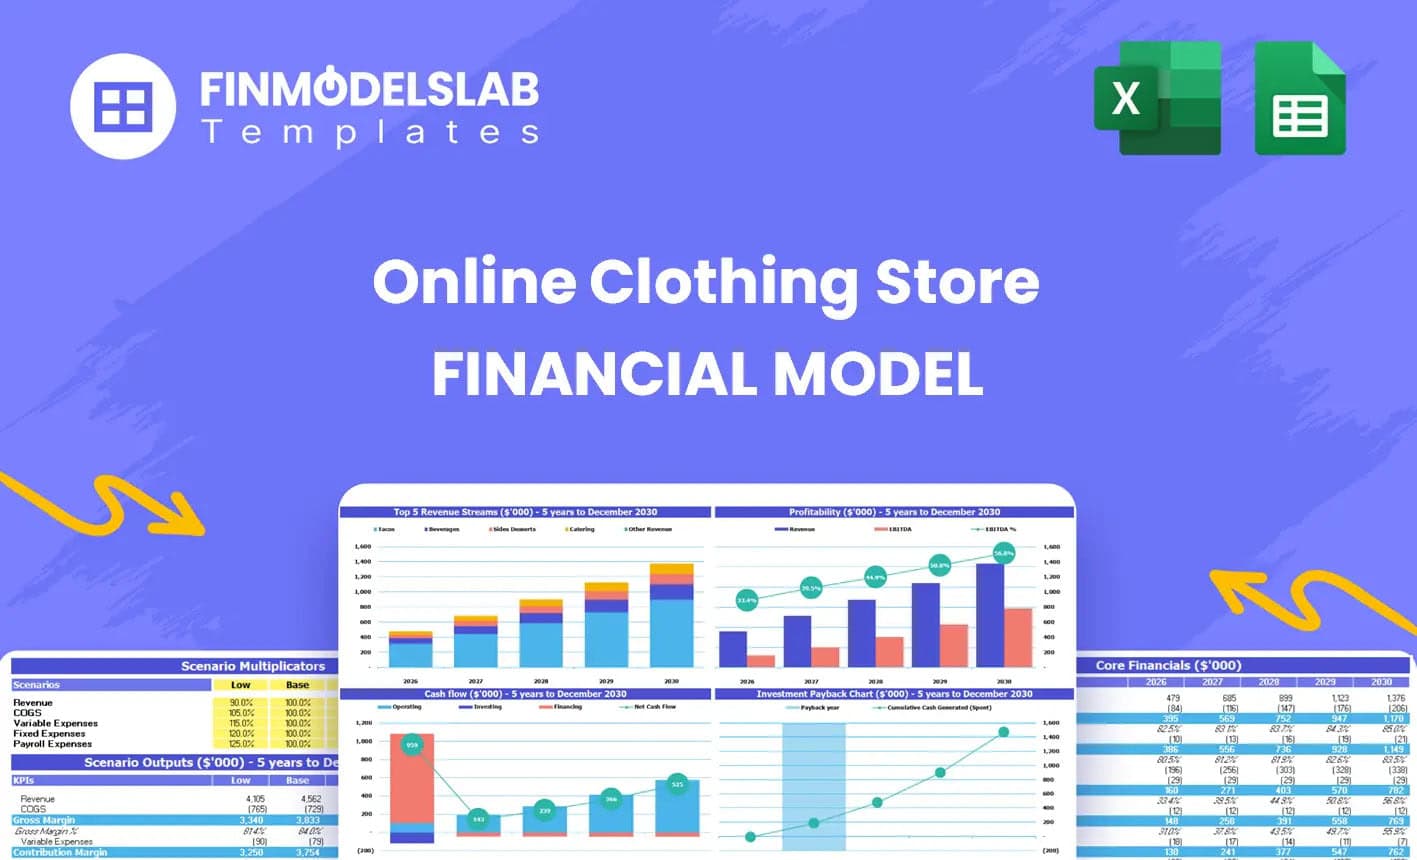
Online Clothing Store Financial Model Excel Templa...
The Online Clothing Store Financial Model helps founders, entrepreneurs, business owners, consultant... Read more
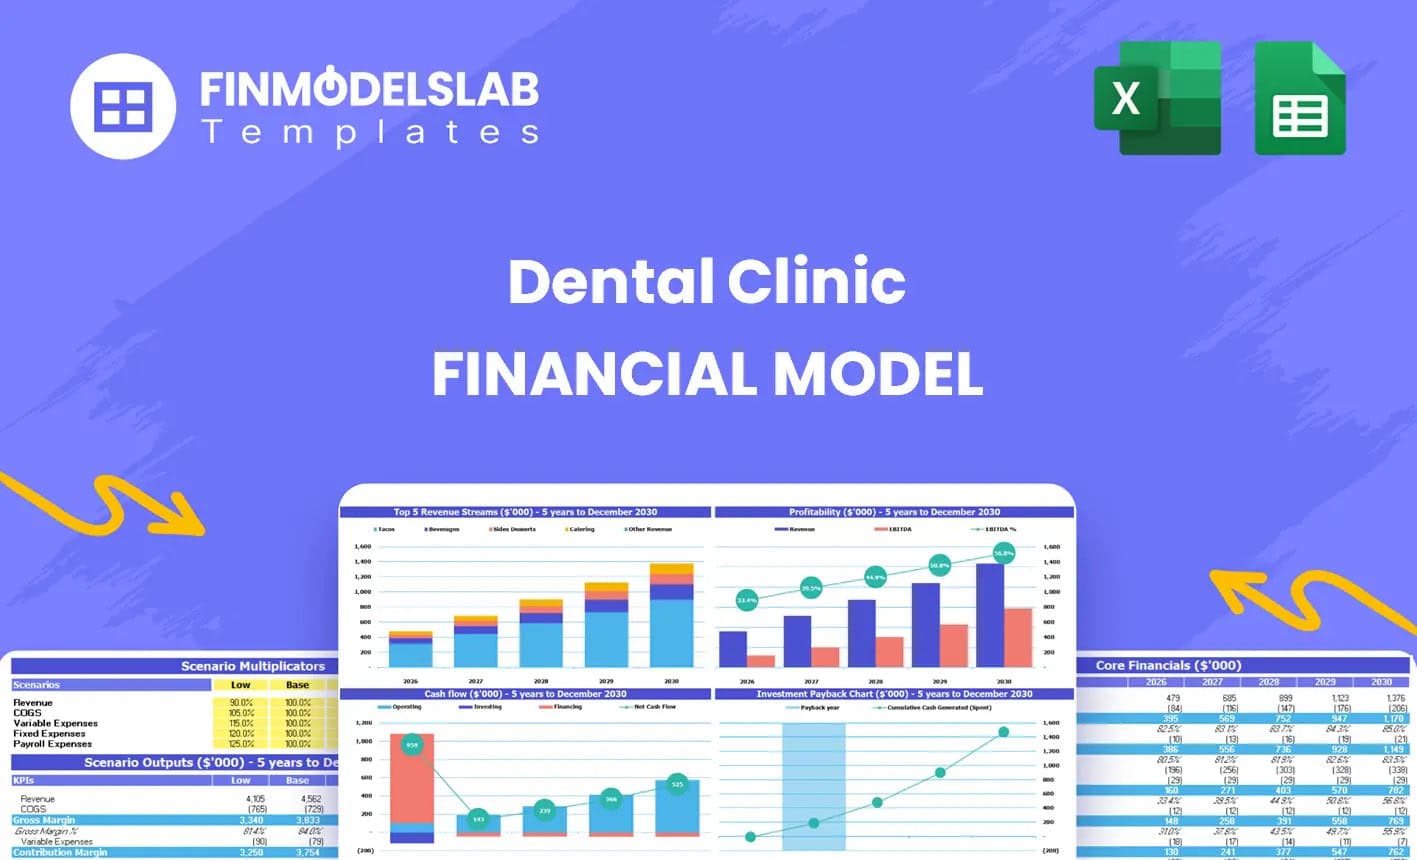
Dental Practice Financial Model Excel Template
The Dental Clinic Financial Model helps users turn a dental practice concept, launch plan, or expans... Read more
You must log in to submit a review.