
0 ITEMS

Agrivoltaics Financial Model Excel | 30-Year Solar & Farming Project Finance, IRR, NPV & DSCR
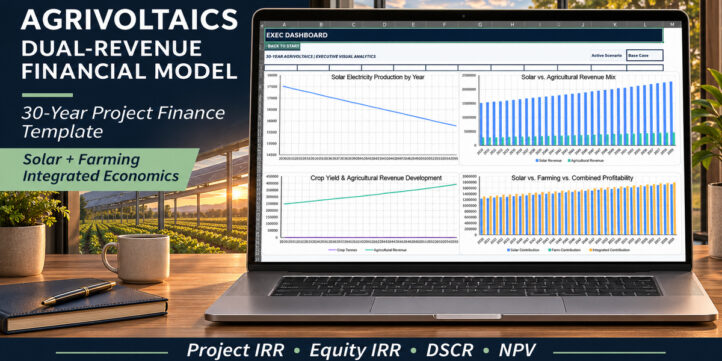
Evaluate dual-revenue agrivoltaics economics with a 30-year Excel model integrating solar power, crop production, land use, CAPEX, debt and investment returns. Includes 24 model worksheets, five live scenarios, eight native dashboard charts and a 23-page PDF guide.
AGRIVOLTAICS FINANCIAL MODEL | 30-YEAR PREMIUM EDITION
Dual-Revenue Solar & Farming • Project Finance • IRR • NPV • DSCR
TWO REVENUE STREAMS. ONE INTEGRATED INVESTMENT MODEL.
Transform solar generation, agricultural production and land-use assumptions into a structured 30-year financial outlook.
The Agrivoltaics Dual-Revenue Financial Model by SheetworksStudio connects electricity sales, crop economics, development costs, debt financing and investment returns in one professionally designed Excel workbook.
Built for renewable-energy developers, agricultural businesses, landowners, infrastructure investors and financial advisers, this premium model provides a transparent framework for evaluating agrivoltaic project feasibility and long-term financial performance.
Explore Integrated, Solar-only and Farming-only configurations, compare alternative scenarios and understand how project assumptions influence profitability, liquidity and investment value.
All demonstration inputs and financial results are fictional and illustrative.
▣ EXECUTIVE DASHBOARD & EIGHT DYNAMIC CHARTS
Turn complex project calculations into clear investment insights.
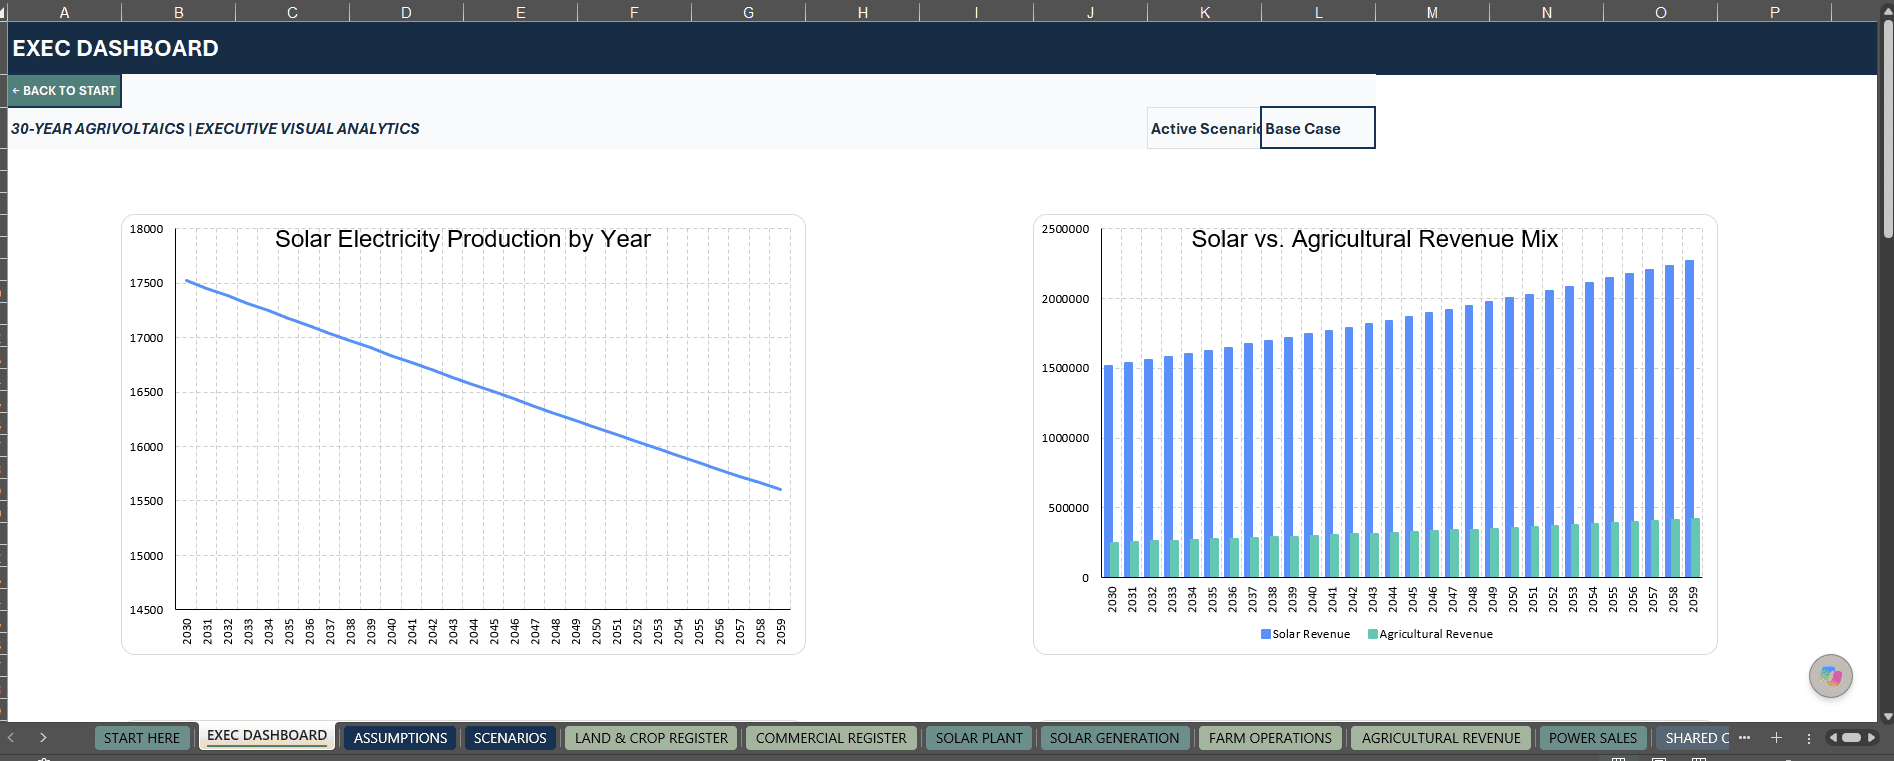
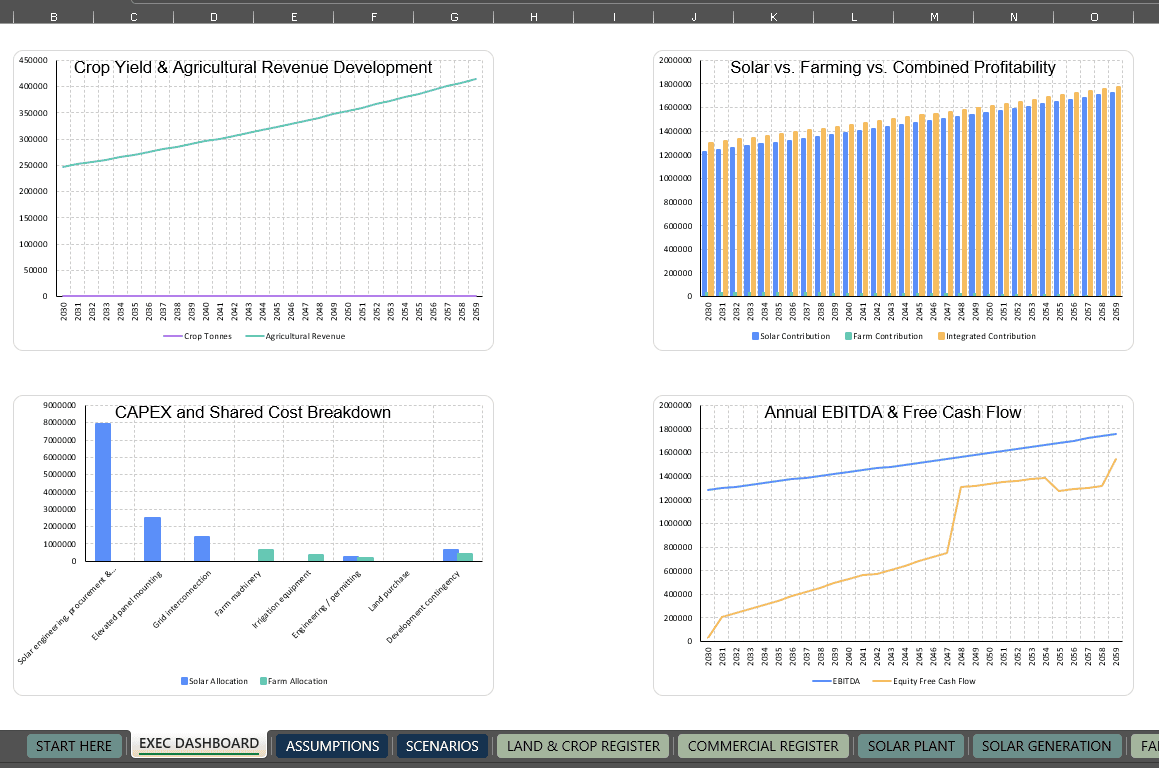
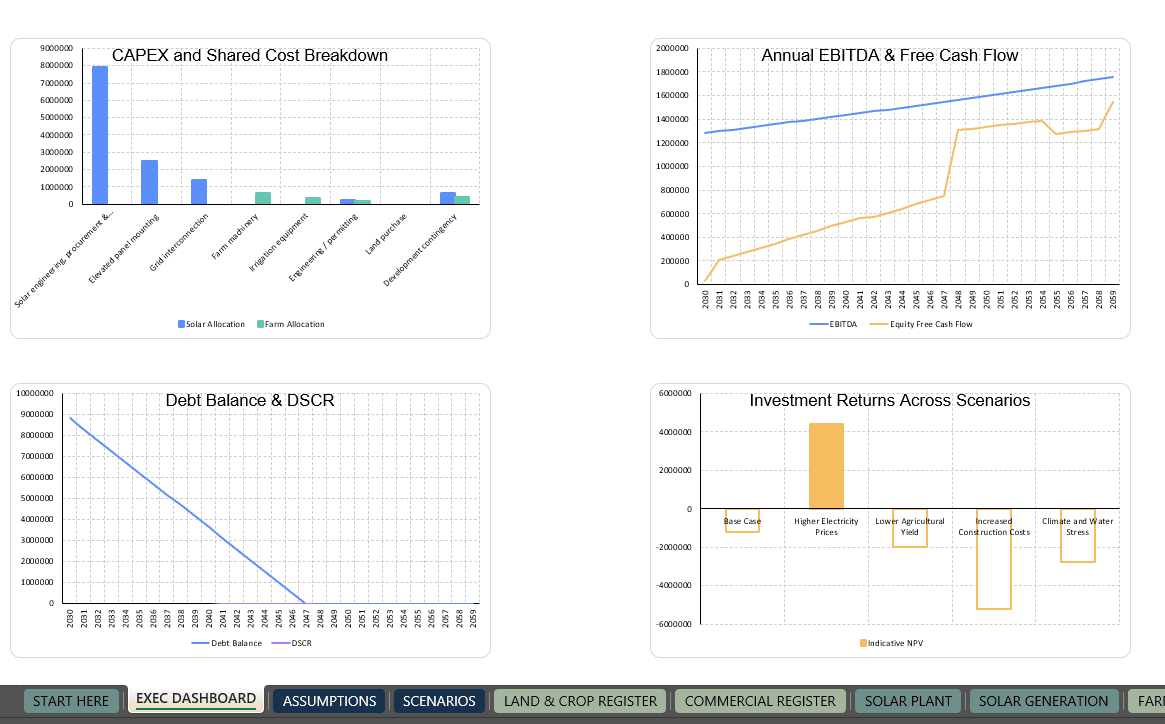
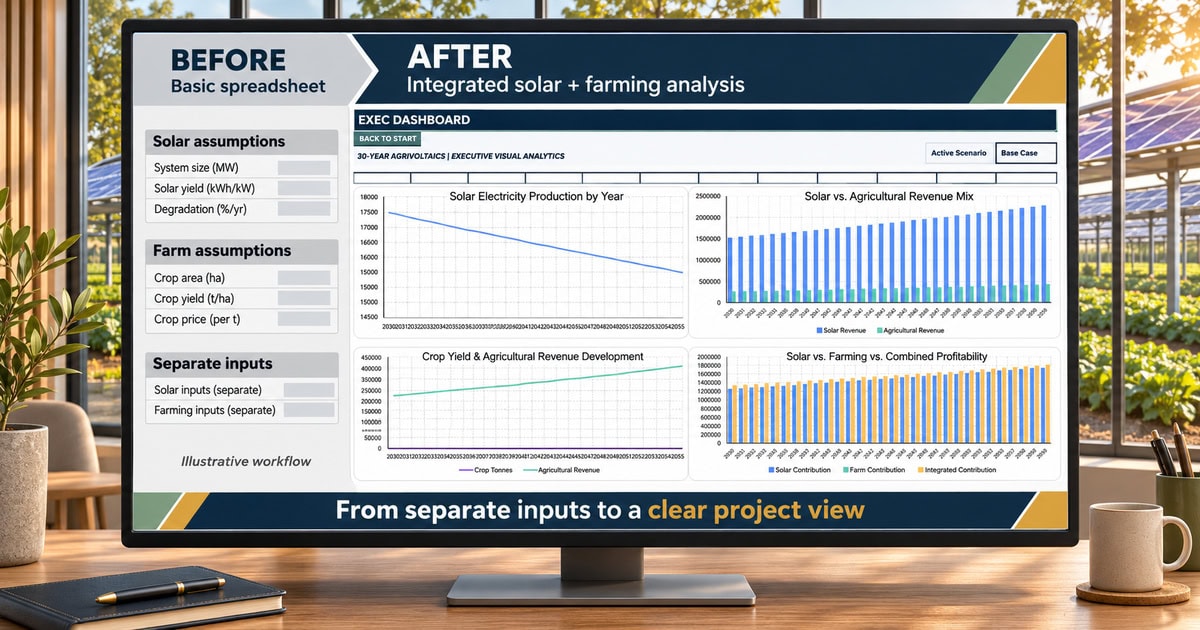
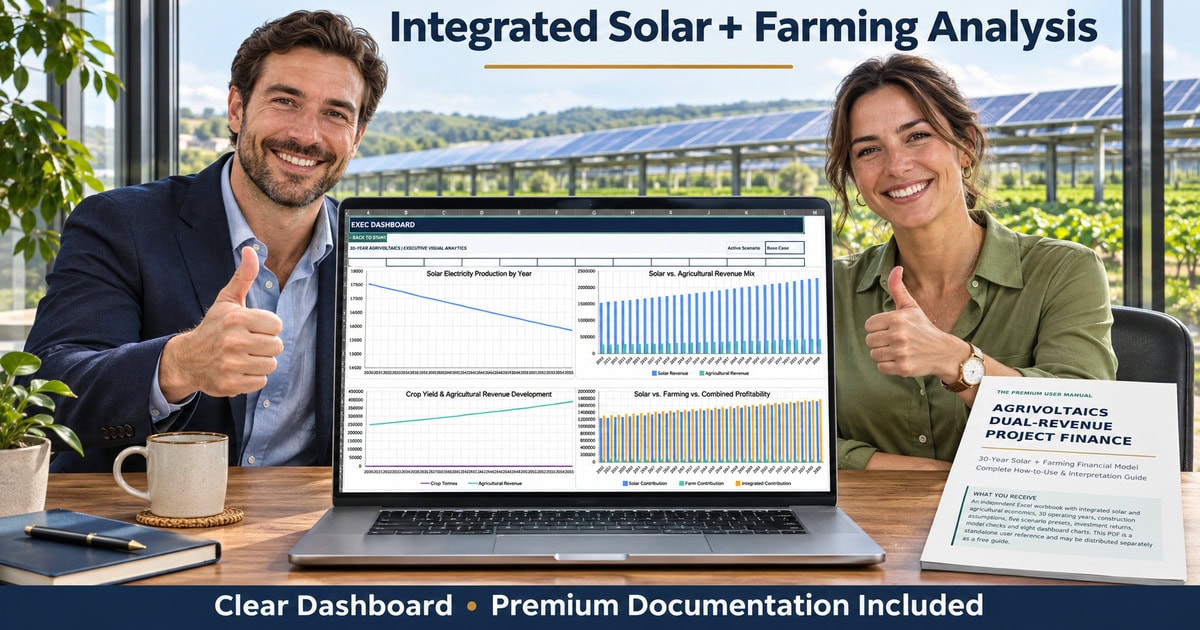
The dedicated Executive Dashboard features eight native, data-linked Excel charts:
• Solar Electricity Generation
• Solar vs Agricultural Revenue
• Crop Yield & Agricultural Income
• Solar, Farming & Integrated Contribution
• Development CAPEX Breakdown
• EBITDA vs Free Cash Flow
• Outstanding Debt & DSCR
• Indicative Scenario Investment Comparison
All charts connect to the model’s financial and operational calculations, with supporting data maintained on a hidden helper worksheet.
Review production, operating performance, capital requirements and financing risks through one coordinated visual interface.
☀ SOLAR GENERATION & ELECTRICITY REVENUE
Build a long-term solar power forecast using editable technical and commercial assumptions.
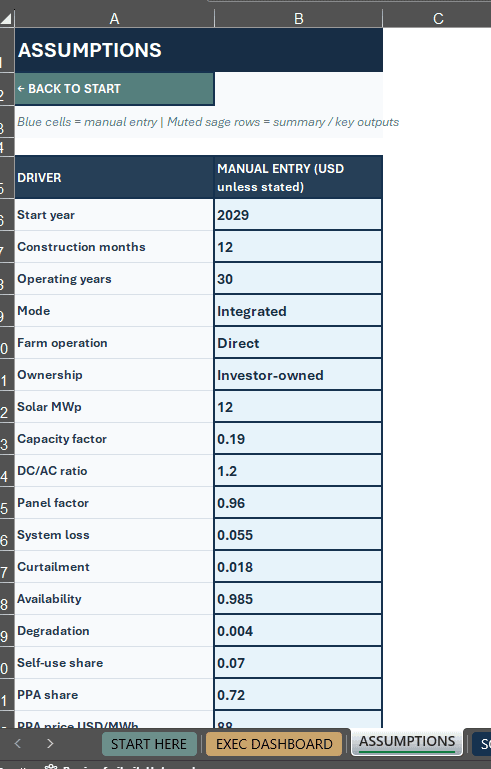
Key modeling drivers include:
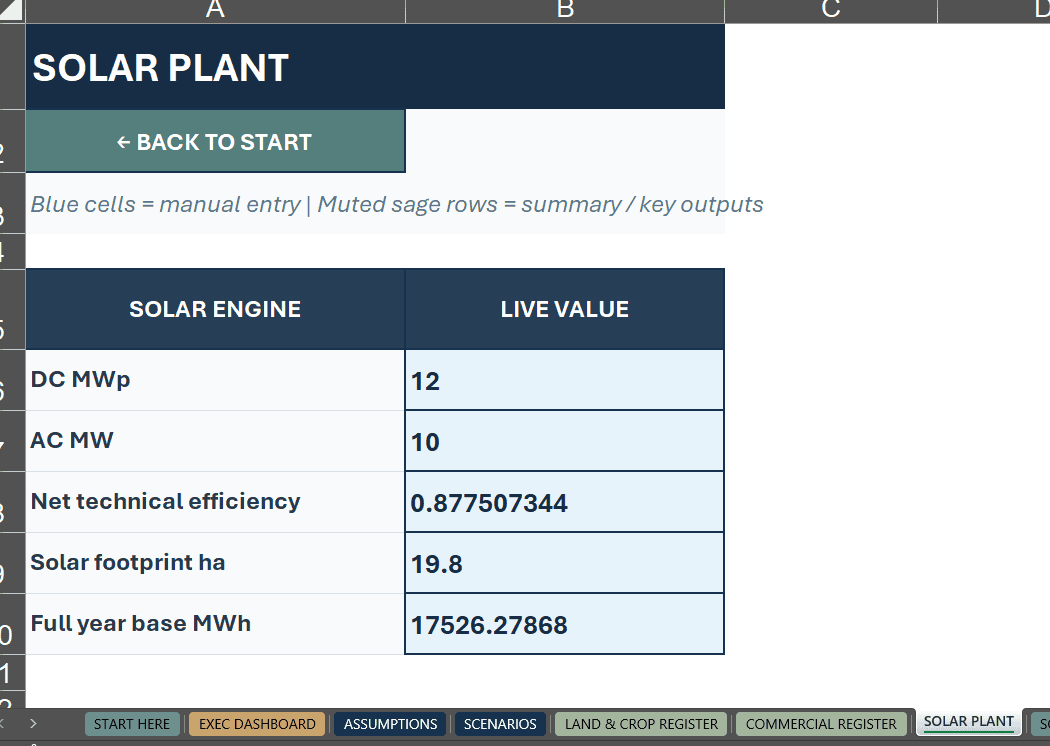
✓ Installed solar capacity (MWp)
✓ DC/AC ratio and capacity factor
✓ Monthly generation seasonality
✓ System losses and availability
✓ Curtailment and annual degradation
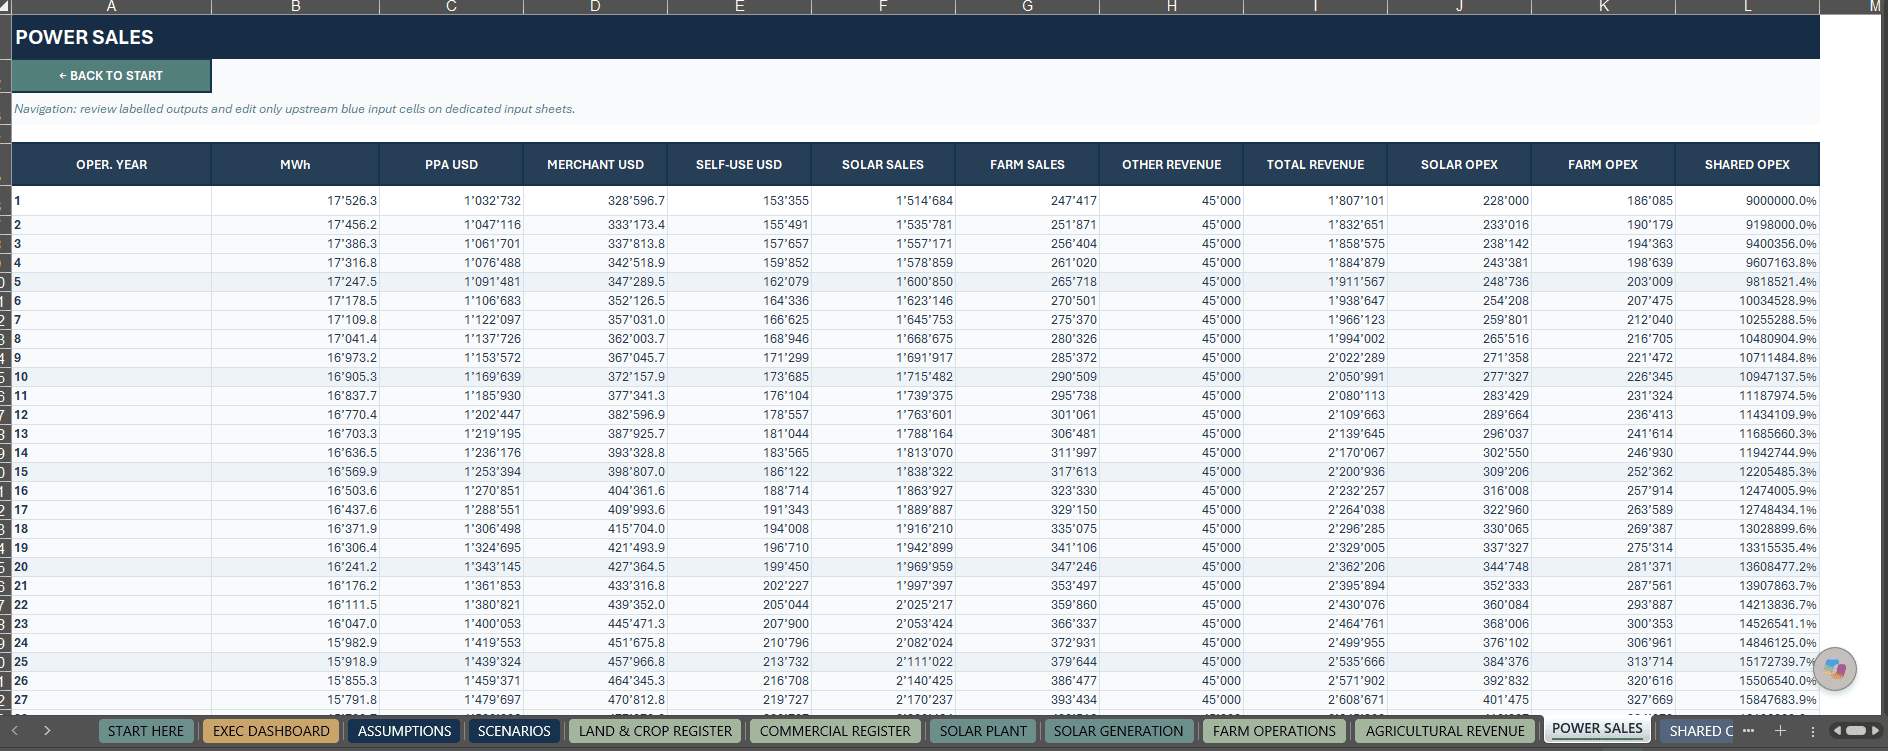
✓ Power Purchase Agreement (PPA) pricing
✓ Merchant electricity sales
✓ On-site electricity consumption and value
Follow electricity generation from technical production through commercial allocation, revenue forecasting and project cash flow.
The model distinguishes PPA, merchant and self-consumption components to support transparent electricity revenue planning.
◈ AGRICULTURAL PRODUCTION & LAND ECONOMICS
Understand the financial relationship between solar infrastructure and productive farmland.
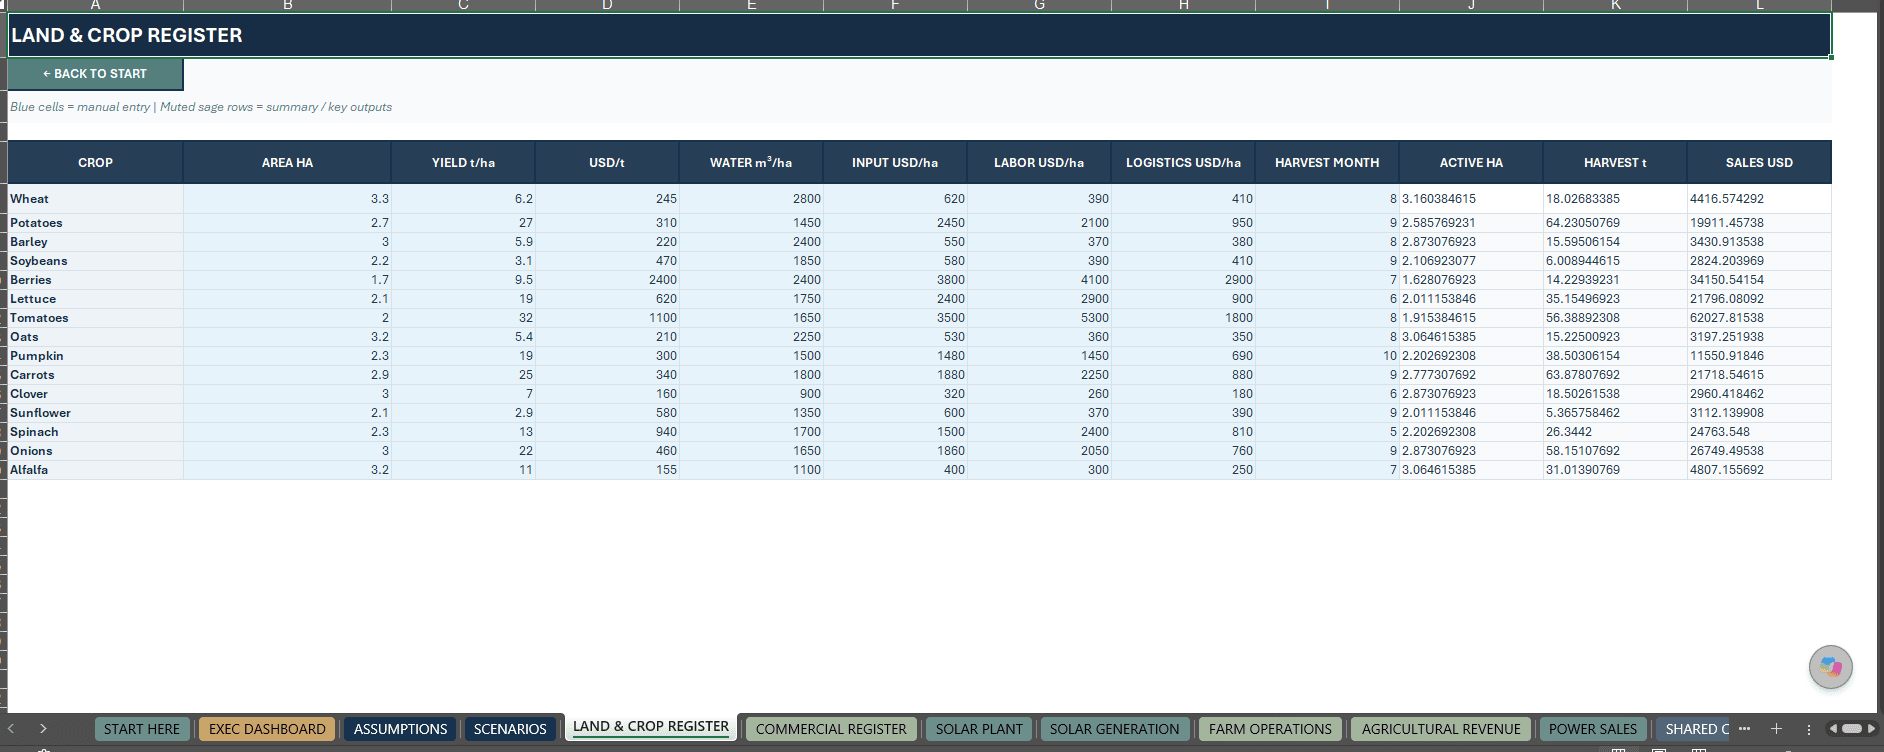
Customize 15 illustrative field and crop records with:
• Land allocation and cultivated hectares
• Crop yields and selling prices
• Solar shading effects
• Irrigation and water consumption
• Agricultural inputs and labor
• Logistics and operating expenses
• Seasonal production and revenue
• Direct-farming or farm-lease arrangements
Evaluate how crop productivity, agricultural prices, water requirements and land-use choices influence farming contribution and integrated project economics.
Compare direct agricultural operations with alternative land-leasing structures.
▤ CAPITAL INVESTMENT & PROJECT FINANCING
Connect development expenditure with long-term funding requirements.
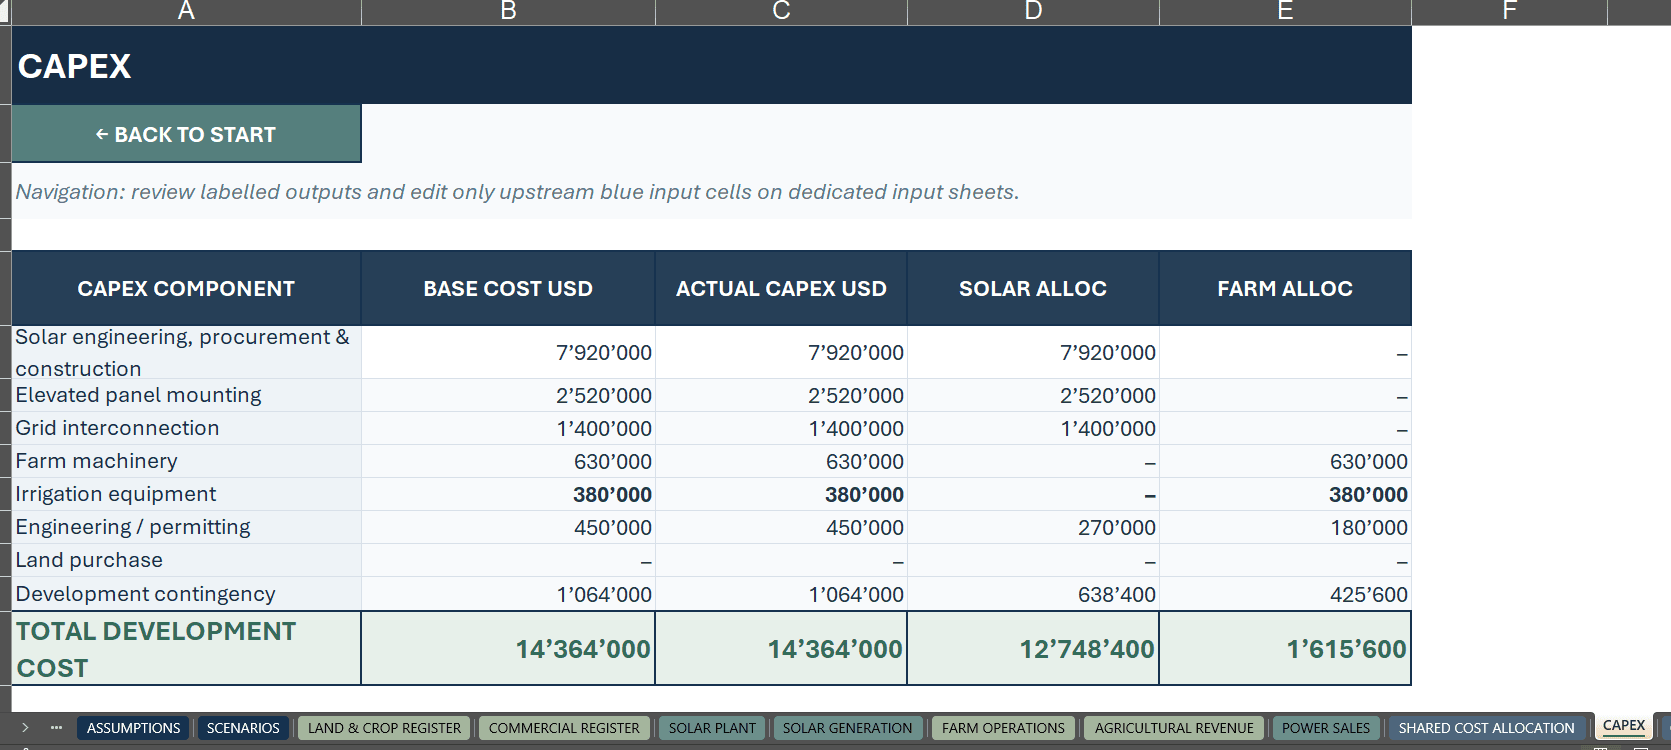
The integrated CAPEX framework covers solar equipment, elevated mounting structures, grid interconnection, agricultural machinery, irrigation systems, engineering, permitting, land acquisition and contingencies.
Dedicated financial schedules include:
✓ Project CAPEX and cost allocation
✓ Operating expenses and shared infrastructure costs
✓ Working capital requirements
✓ Debt drawdowns and outstanding balances
✓ Interest and principal repayments
✓ Debt service and reserve assumptions
✓ Sponsor equity and project cash flows
Assess how investment costs, leverage and financing terms affect liquidity, debt coverage and projected shareholder returns.
↗ THREE FINANCIAL STATEMENTS & INVESTMENT RETURNS
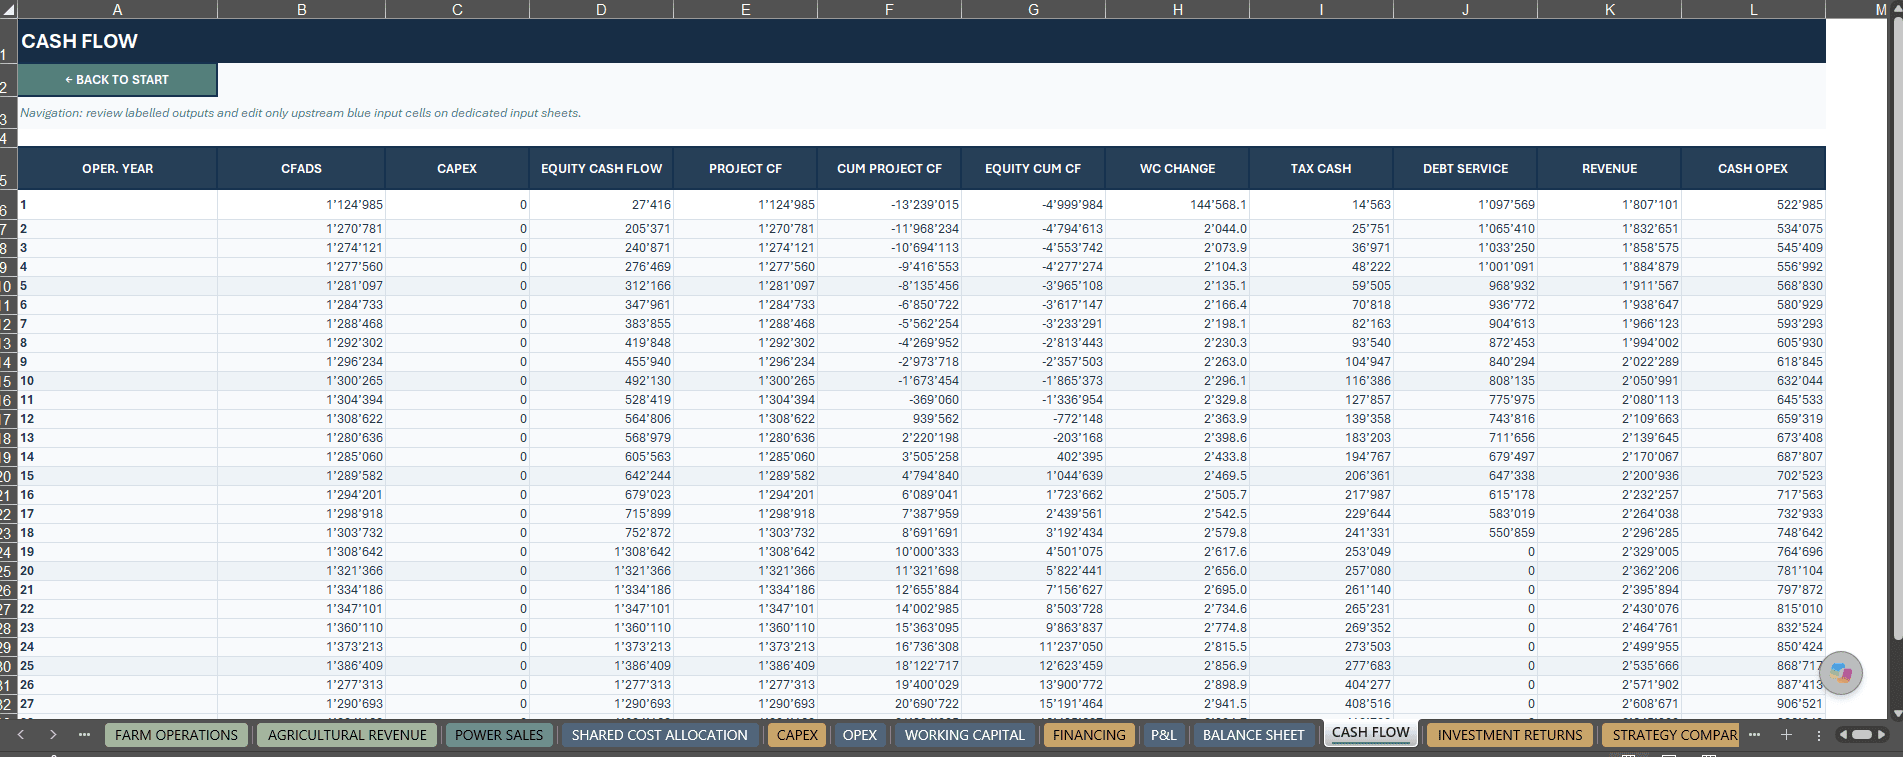
The model connects technical and commercial assumptions with annual financial reporting across 30 operating years.
PROFIT & LOSS — Revenue, operating costs, EBITDA, depreciation, interest, taxes and earnings.
BALANCE SHEET — Project assets, liabilities, debt, reserves and equity.
CASH FLOW — Operating cash generation, working capital, capital expenditure, financing movements and investor cash flows.
Key investment indicators include:
• Project Internal Rate of Return (IRR)
• Equity Internal Rate of Return (IRR)
• Project Net Present Value (NPV)
• Minimum Debt Service Coverage Ratio (DSCR)
• Simplified Levelized Cost of Electricity (LCOE)
• Equity Payback Period
• Total Project CAPEX
• Lifetime Revenue and Solar Generation
Investment results are assumption-driven estimates, not guaranteed returns or independently certified valuations.
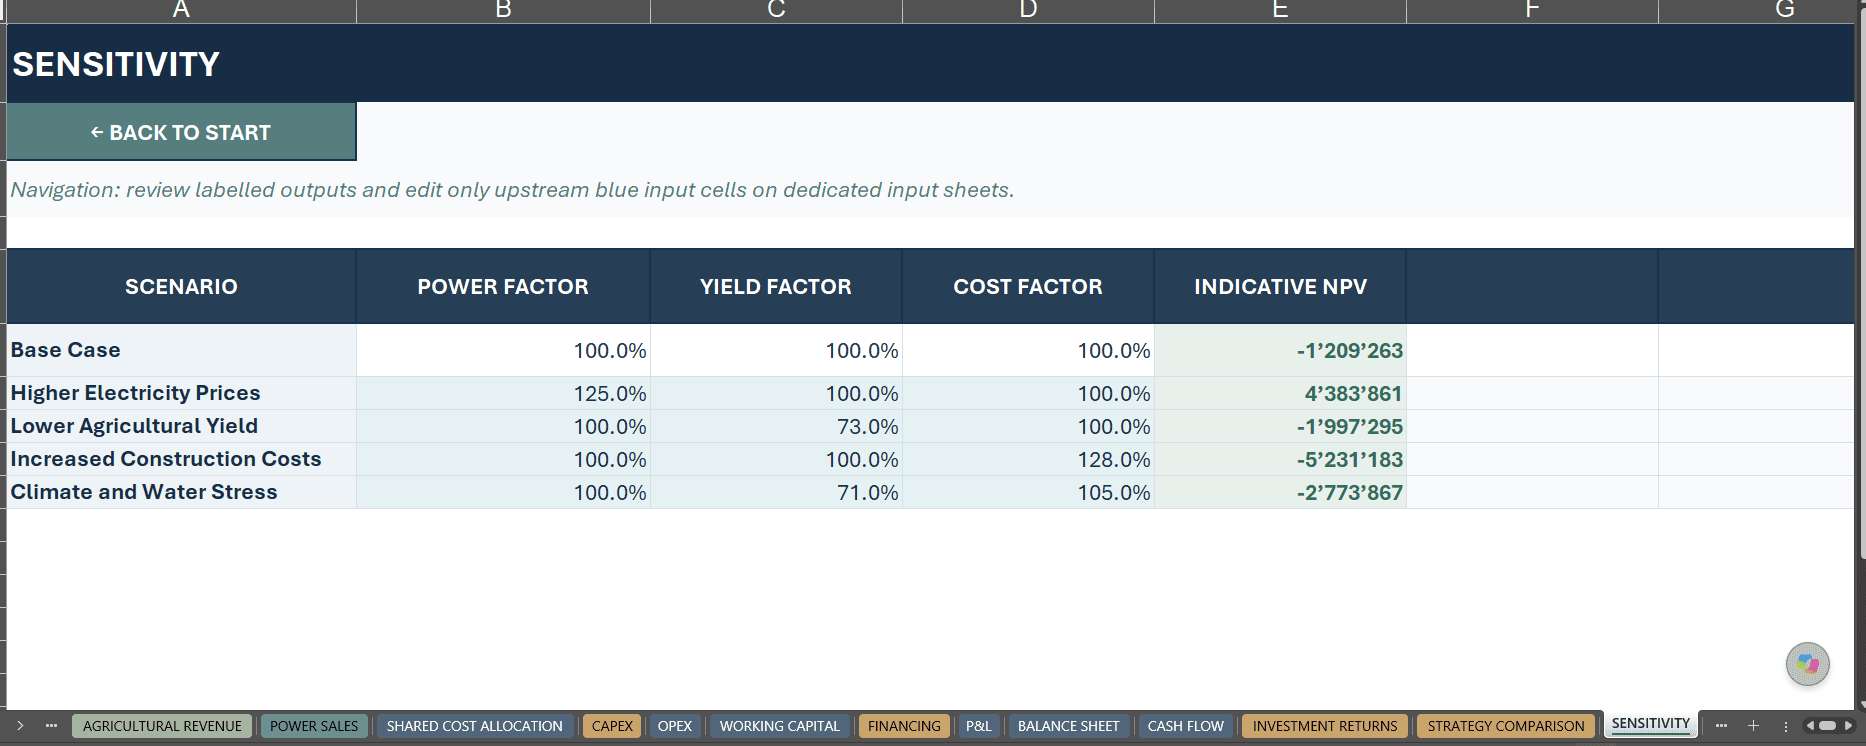
◇ FIVE LIVE SCENARIOS & SENSITIVITY ANALYSIS
Explore how changing market, construction and agricultural conditions affect your project.
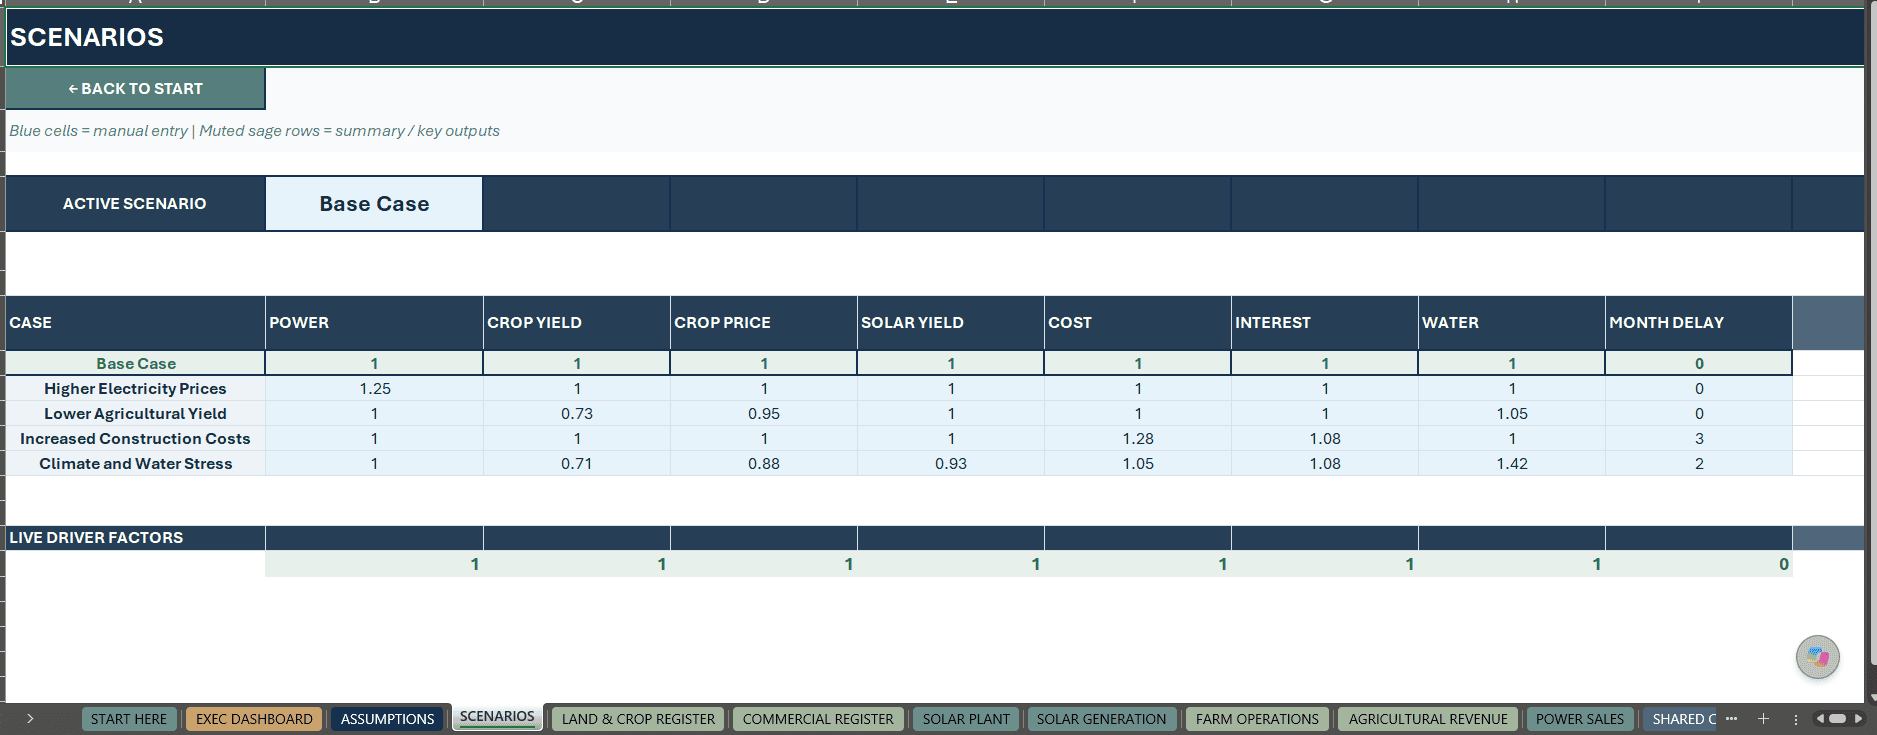
The workbook includes five selectable scenarios:
01 | BASE CASE — Central illustrative project assumptions.
02 | HIGHER ELECTRICITY PRICES — Evaluate stronger power-selling economics.
03 | LOWER AGRICULTURAL YIELD — Assess reduced crop production and farming income.
04 | INCREASED CONSTRUCTION COSTS — Explore higher CAPEX, financing pressure and delays.
05 | CLIMATE & WATER STRESS — Evaluate combined agricultural, irrigation and solar-production risks.
Selecting a scenario updates the connected operating and financial calculations.
A separate sensitivity worksheet provides indicative NPV comparisons. These are simplified approximations, not independently recalculated full project cases.
For detailed comparisons, activate each scenario individually and review its financial outputs.
✓ BUILT-IN MODEL CHECKS & TRANSPARENT INPUTS
The dedicated MODEL CHECKS worksheet supports structured financial and technical review.
Controls cover land allocation, solar generation, electricity reconciliation, capital allocation, operating periods, balance-sheet consistency, shared costs, debt amortization and crop-yield validation.
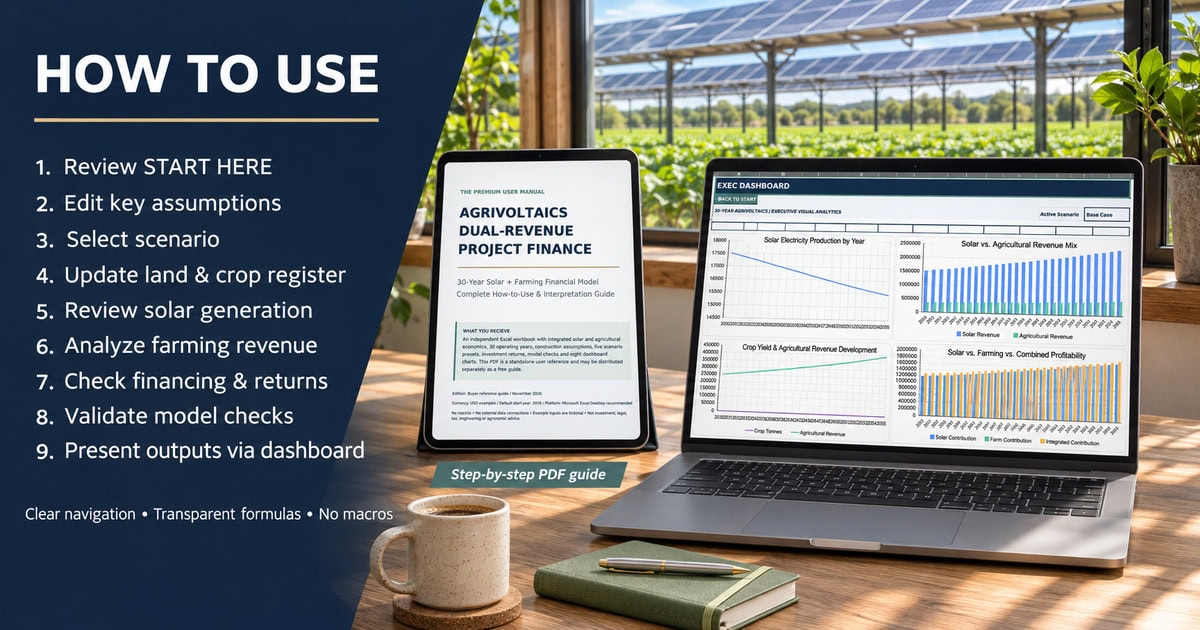
Clearly distinguished manual inputs, visible formulas and START HERE navigation make the workbook easier to understand and customize.
A passing model check confirms selected internal calculations—not guaranteed project feasibility or financing approval.
▥ WHAT’S INCLUDED
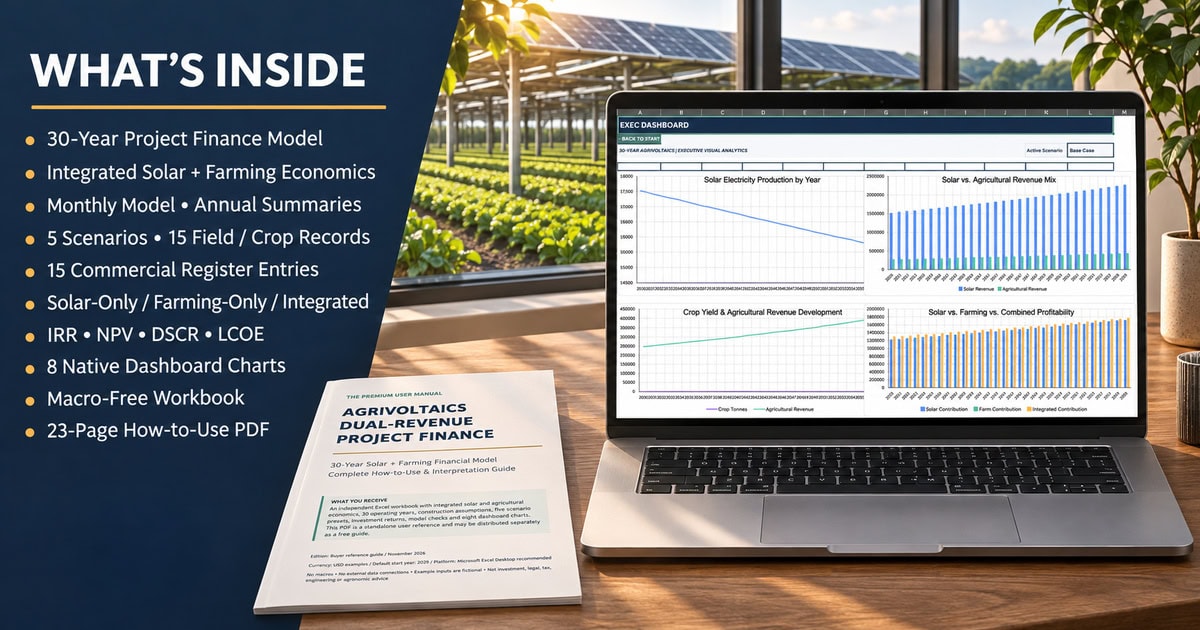
1 × PREMIUM EXCEL FINANCIAL MODEL (.XLSX)
✓ 24 visible worksheets + 1 hidden dashboard-data sheet
✓ 30-year operating forecast
✓ Monthly solar and agricultural schedules
✓ 15 fictional crop and field examples
✓ 15 optional commercial-register categories
✓ Integrated, Solar-only and Farming-only modes
✓ Five selectable financial scenarios
✓ Eight native Excel dashboard charts
✓ CAPEX, OPEX and financing schedules
✓ Three annual financial statements
✓ IRR, NPV, DSCR, LCOE and payback analysis
✓ Built-in model checks
1 × PROFESSIONAL HOW-TO-USE GUIDE (.PDF)
A comprehensive 23-page English instruction manual covering workbook setup, solar production, agricultural economics, land allocation, financing, financial statements, scenarios, dashboard interpretation, troubleshooting and model limitations.
The PDF guide is also available separately as a complimentary reference download. The free guide does not include the editable Excel workbook.
⌁ WHO IS THIS MODEL FOR?
• Agrivoltaic project developers
• Renewable-energy investment analysts
• Solar infrastructure investors
• Agricultural businesses and landowners
• Project finance professionals
• Energy and sustainability consultants
• Financial modeling educators and students
Suitable for preliminary project feasibility, land-use evaluation, dual-revenue planning, financing discussions and illustrative investment analysis.
⚙ SOFTWARE, COMPATIBILITY & MODEL SCOPE
Format: Microsoft Excel (.xlsx)
Forecast: 30 operating years
Default Start Year: 2029
Scenarios: Five live presets
Macros / VBA: None
External Data Connections: None required
Recommended Software: Microsoft Excel Desktop
Google Sheets import has not been independently verified. Formulas, charts and formatting should be reviewed after conversion.
The model uses simplified construction financing, debt reserve, taxation and LCOE conventions. It is intended for structured planning, not certified engineering design, agronomic assessment or lender-approved underwriting.
Optional commercial-register entries should be checked for actual formula linkage before being treated as consolidated financial results.
◈ INDEPENDENT TEMPLATE DISCLAIMER
This is an independent, unofficial financial-planning template created by SheetworksStudio.
All sample inputs, financial projections, crop yields, electricity generation assumptions and investment results are illustrative.
The product is not audited, certified, bank-approved, regulator-approved or officially endorsed by any software provider or professional organization.
It does not constitute financial, investment, accounting, tax, legal, engineering or agronomic advice.
Users must independently verify project assumptions, calculations, contracts, site conditions and regulatory requirements before making business or investment decisions.
No project feasibility, financing availability or investment return is guaranteed.
Digital download only. No physical product or consulting service is included.
ONE LANDSCAPE. TWO REVENUE STREAMS. THIRTY YEARS OF CONNECTED FINANCIAL PLANNING.
Created by SheetworksStudio.
Similar ProductsOther customers were also interested in...


 eFinancialModels
Electric Vehicle (EV) Charging Station Financial M...
With this comprehensive 5- or 10-year monthly tool, investors can assess the viability of setting up... Read more

Financial Model for Mobile App | Mobile App Busine...
The Mobile App Financial Plan Template in Excel allows you to develop financial projections when lau... Read more

 HenrySheykin
Food Truck Financial Model Excel Template
The Food Truck Financial Model helps entrepreneurs, founders, business owners, consultants, and anal... Read more

Green Hydrogen Production from Wind Energy Financi...
The Green Hydrogen from Wind Financial Model aims to comprehensively forecast a horizon of 40 years ... Read more

Simple Mutual Non-Disclosure Agreement Template
Protect your business secrets with ease using our Simple Mutual Non-Disclosure Agreement Template. S... Read more

Solar Energy Financial Model
The Solar Energy Financial Model Spreadsheet Template in Excel assists you in preparing a sophistica... Read more

 Peter Graf
The Customer-Centric Financial Model for Restauran...
Starting a restaurant without a financial plan is like driving a car blindfolded. You wouldn´t do i... Read more
You must log in to submit a review.