0 ITEMS

Cash Flow Statement Excel Template: Guide with SaaS Example

A cash flow statement reports where cash came from and where it went through operating, investing and financing activities, and a growth-stage company can build one in Excel by starting from net income, adjusting for non-cash items and working capital, and tying the result to balance sheet cash. Public companies follow Securities and Exchange Commission Regulation S-X Rule 4-01, which presumes financial statements not prepared under generally accepted accounting principles to be misleading, and FASB ASC 230 sets the same three-activity classification for private companies that report under those principles.
Key Takeaways
- A cash flow statement reconciles net income to the change in cash through operating, investing and financing activities.
- Build it in Excel from two balance sheets and one income statement, then add a check cell proving ending cash ties out.
- In the worked example, a SaaS company with USD 10 million revenue lost USD 380,000 yet generated USD 1,740,000 of operating cash.
- Annual prepayments added USD 1,000,000 of that operating cash, while USD 1,600,000 of capital spending left free cash flow at USD 140,000.
- A cash flow projection answers how long cash lasts; a three-statement model is needed when lenders, investors or scenarios must tie to the balance sheet.
What Is a Cash Flow Statement & Why It Matters
A cash flow statement is the financial statement that explains how a business moved from opening cash to closing cash during a period. Under Accounting Standards Codification (ASC) Topic 230, issued by the Financial Accounting Standards Board (FASB), most entities present it with a full set of financial statements and classify every cash receipt and payment as operating, investing or financing.
The U.S. Small Business Administration’s Office of Advocacy counts 36,207,130 small businesses in the United States in its 2026 edition. The Federal Reserve’s 2026 Small Business Credit Survey report on employer firms found that nearly half of firms source at least some inputs from outside the United States, and a large majority of those firms said input prices rose from 2024 to 2025. Cost pressure of that kind makes the timing of cash, not reported profit, the number that decides whether payroll and suppliers get paid.
The Three-Activity Framework: Operating, Investing, Financing
Every cash movement falls into one of three activities, and the three subtotals add up to the net change in cash.
Operating activities cover cash from running the business: customer receipts, supplier and payroll payments, interest paid and taxes. The indirect method, which starts from net income and adjusts for non-cash items and changes in working capital, is the usual way to present them. Working capital is the set of short-term operating assets and liabilities, such as receivables, payables and deferred revenue. Deferred revenue, which is cash billed to customers before the service is delivered, sits inside working capital.
Investing activities cover cash spent on long-term assets: property and equipment, acquisitions and capitalised software, which is development cost recorded as an asset rather than expensed. Financing activities cover cash exchanged with lenders and owners: loan proceeds and repayments, equity issued, dividends and owner draws.
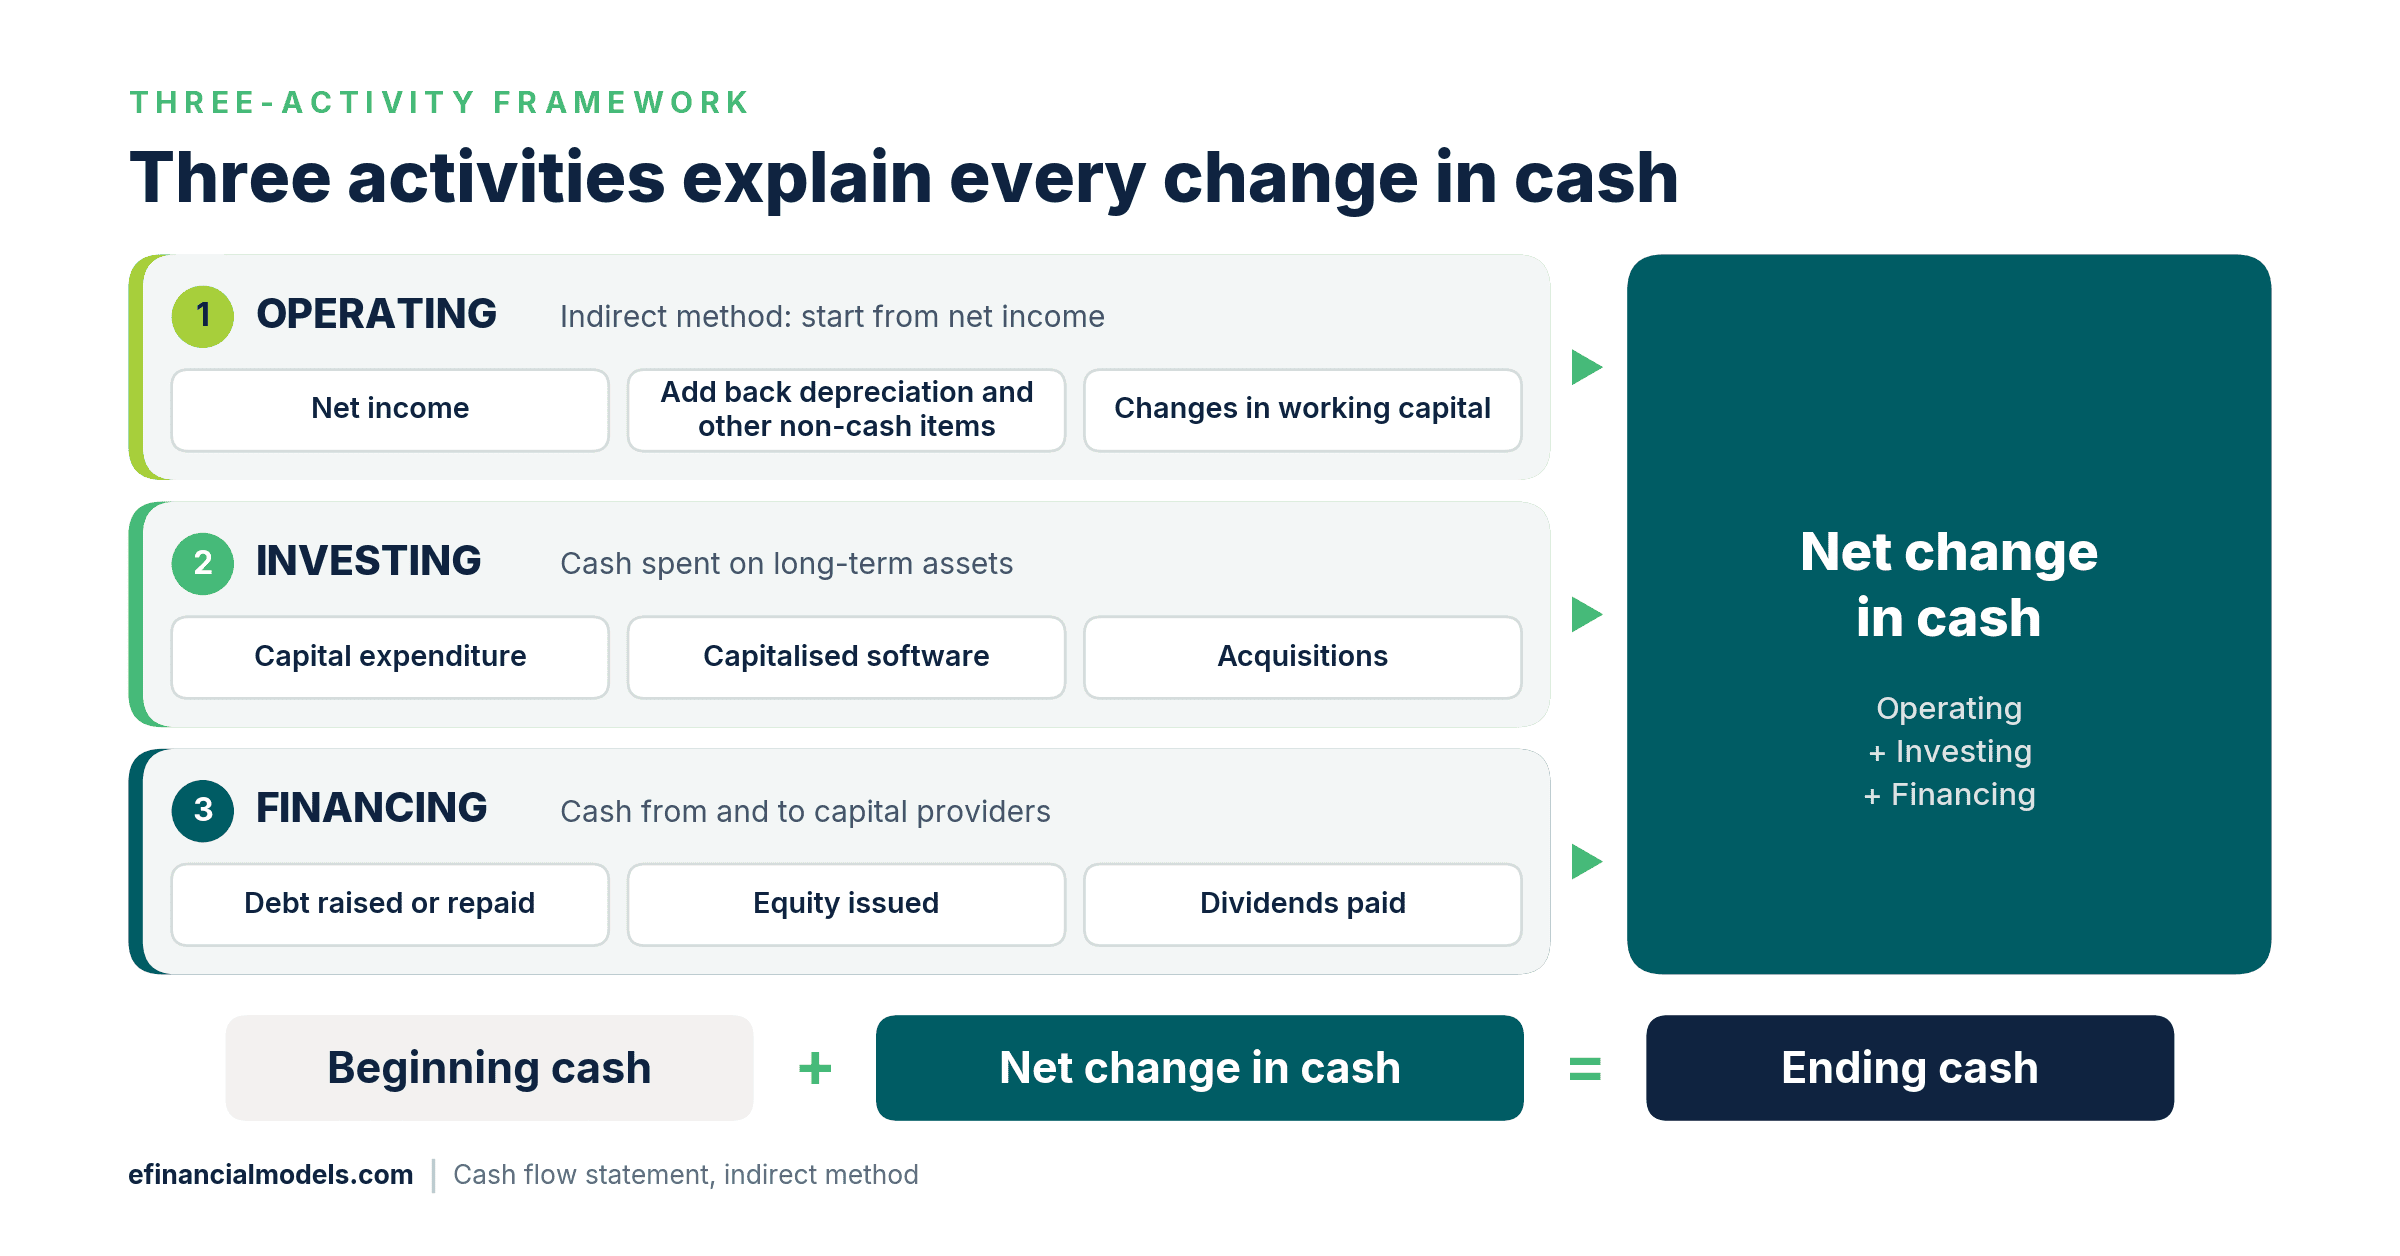
Each activity feeds the net change in cash, which links opening and closing balances. Source: eFinancialModels Analysis
How to Build a Cash Flow Statement in Excel: Step by Step
Six steps produce a statement that reconciles to the balance sheet, and every number after the inputs comes from a formula.
- Separate inputs from calculations. Keep assumptions on an Inputs sheet in blue, formulas on a Calculation sheet and summary metrics on a Results sheet.
- Load two balance sheets and one income statement. Opening and closing balances turn each working capital change into a simple difference.
- Start from net income and add back non-cash expense. Depreciation, amortisation and stock-based compensation reduced profit without using cash.
- Apply the sign rule to working capital. An increase in an asset, such as receivables, uses cash, so subtract it. An increase in a liability, such as deferred revenue, supplies cash, so add it.
- Link investing and financing lines to inputs. Show outflows as negatives so each subtotal is a plain sum.
- Reconcile. Ending cash equals beginning cash plus the net change, and a check cell flags any gap to the balance sheet.
| Line | Excel formula in the example | Logic |
|---|---|---|
| Change in accounts receivable | =-(D25-C25) | Asset up, cash down |
| Change in deferred revenue | =D32-C32 | Liability up, cash up |
| Cash from operating activities | =C44+C45+C46+C47+C48+C49+C50+C51 | Net income plus adjustments |
| Net change in cash | =C52+C56+C61 | Operating plus investing plus financing |
| Ending cash | =C63+C62 | Beginning cash plus net change |
| Ending cash minus balance sheet cash | =C64-D24 | Must equal zero, and the check cell then reads OK |
Worked Example: $10M SaaS Company with 40% YoY Growth
The example is a software-as-a-service (SaaS) company with USD 10,000,000 of revenue in 2026, up 40% year over year from USD 7,142,857. Assume cost of revenue of USD 2,300,000 and operating expenses of USD 7,800,000, including USD 600,000 of depreciation and amortisation and USD 700,000 of stock-based compensation, which is employee pay settled in shares and options. Operating income is a loss of USD 100,000, and interest of USD 240,000 plus tax of USD 40,000 bring the net loss to USD 380,000. Every input is illustrative, and the inputs and formulas shown let readers rebuild the model in any spreadsheet.
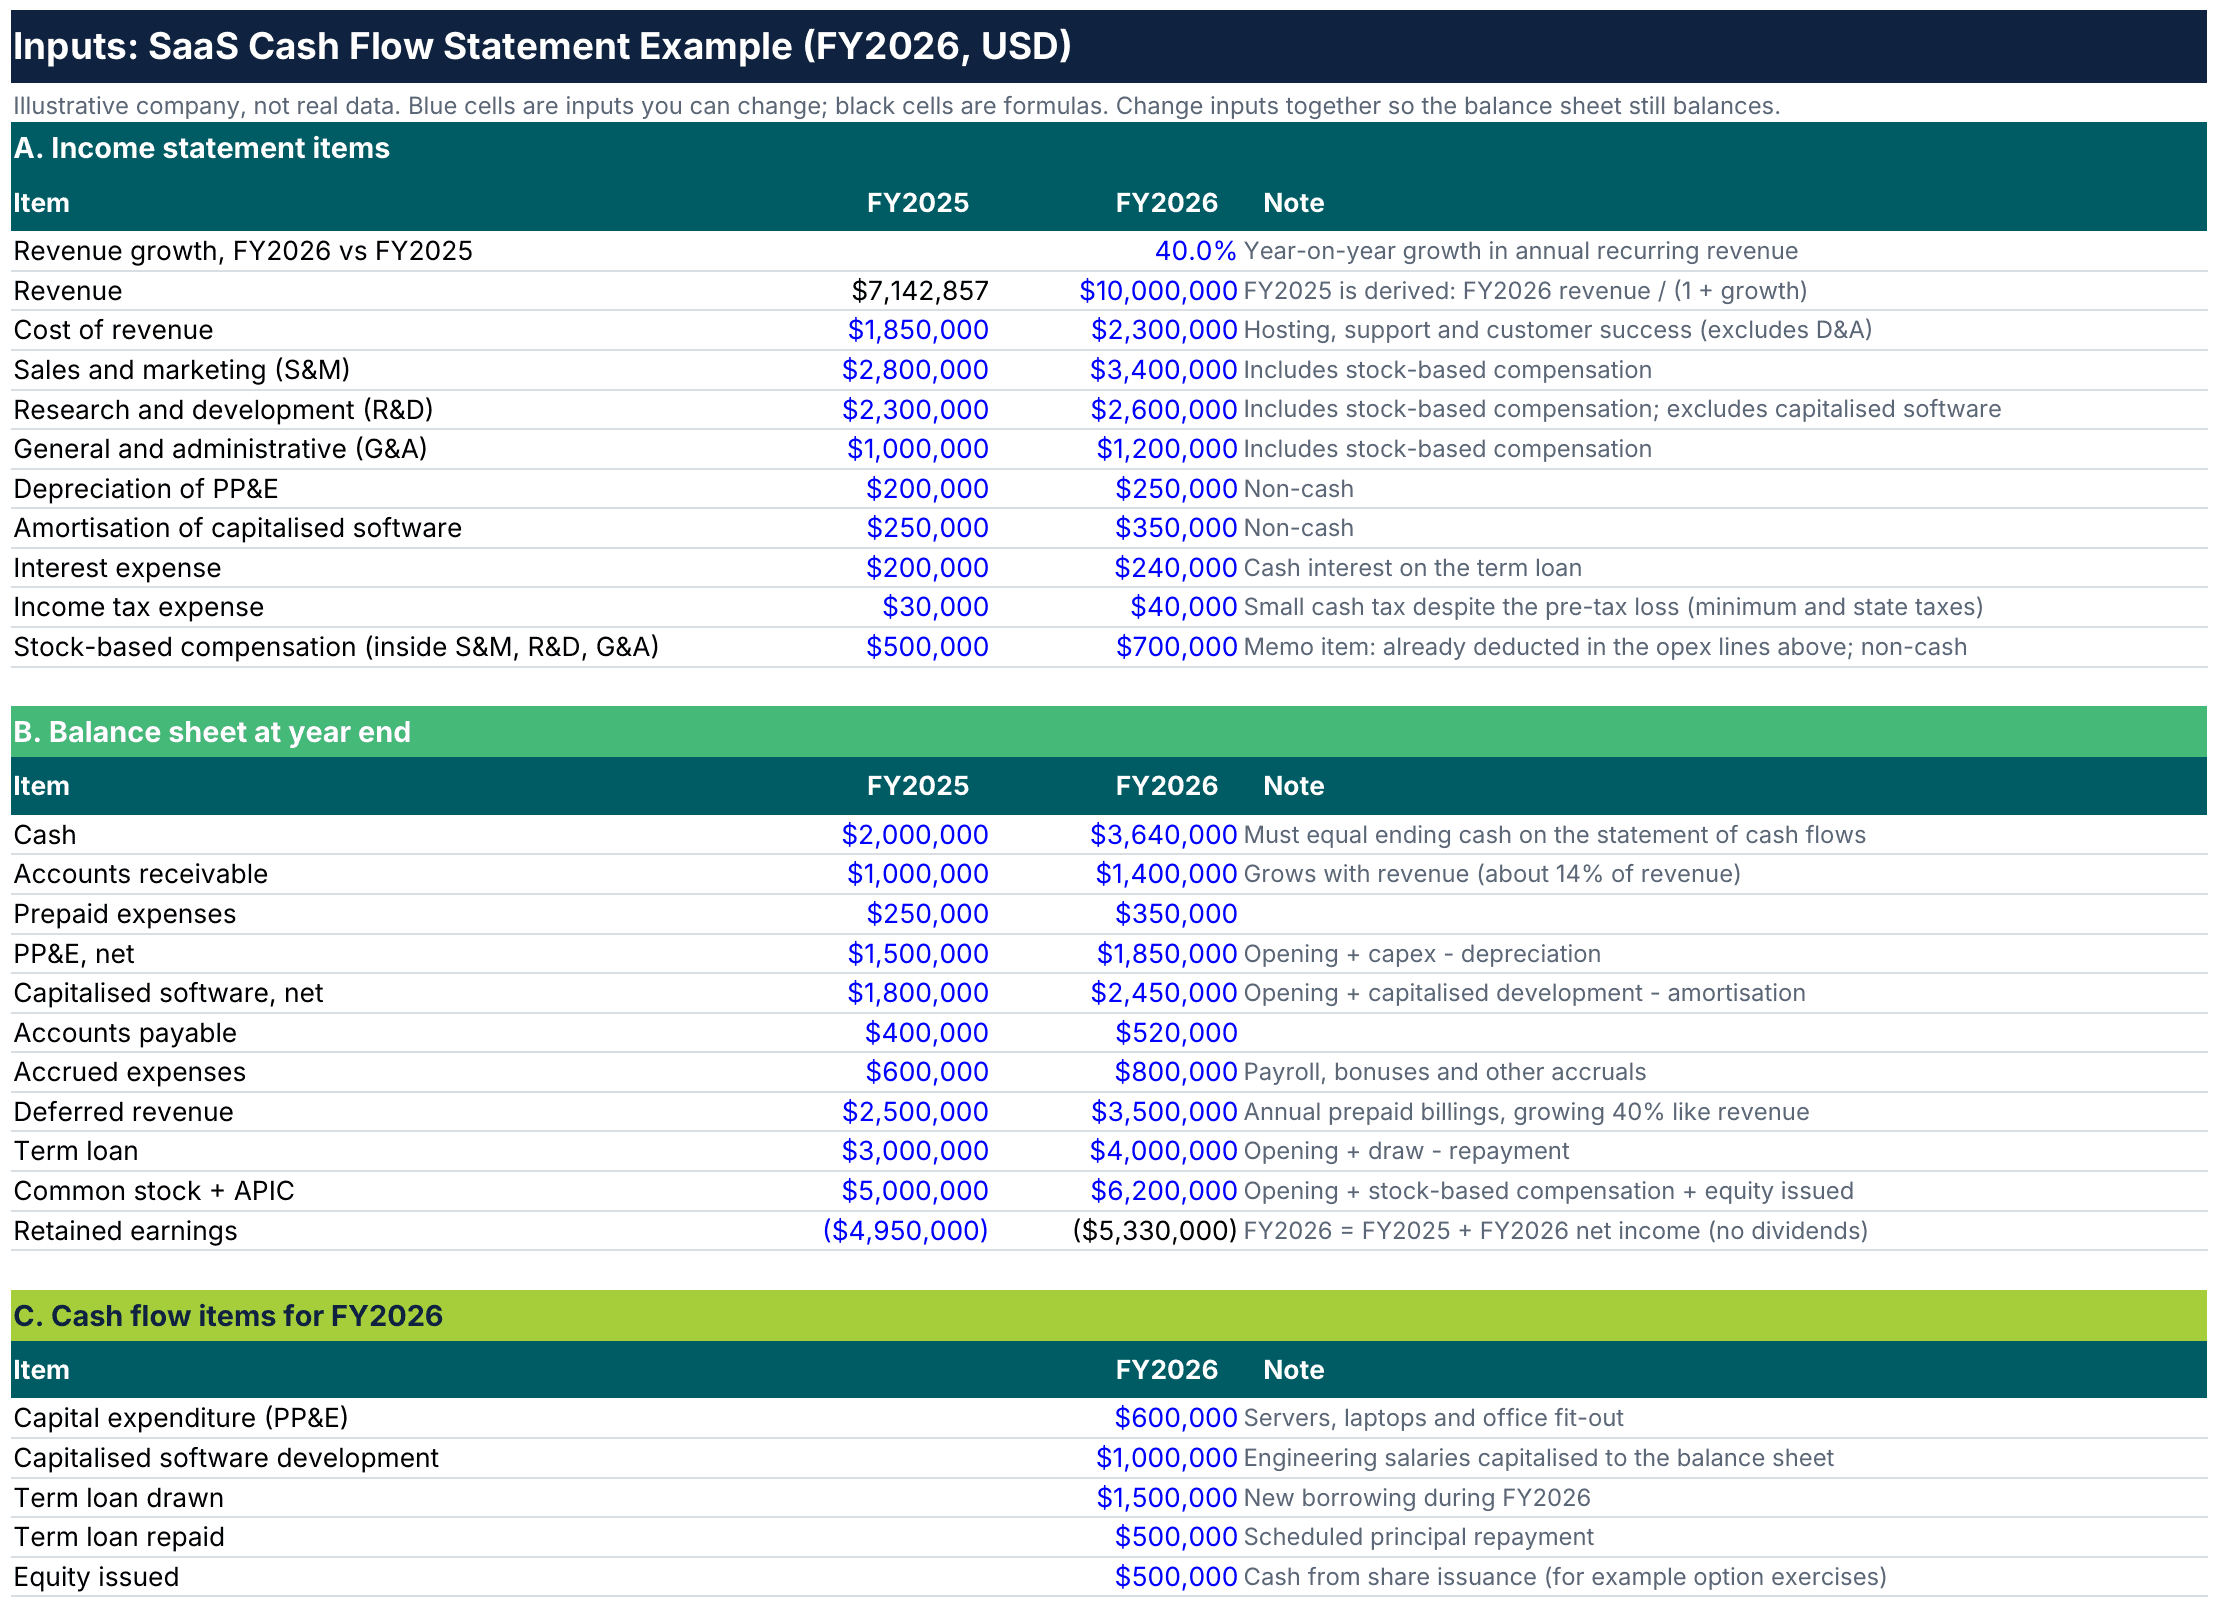
Every assumption sits on one inputs sheet, and each blue cell can be changed. Source: eFinancialModels Analysis
The calculation sheet turns that loss into cash. Non-cash add-backs of USD 1,300,000 and working capital of USD 820,000 lift operating cash flow to USD 1,740,000. Annual prepayments make deferred revenue the largest working capital item: it rose from USD 2,500,000 to USD 3,500,000, a USD 1,000,000 inflow, while receivables grew by USD 400,000.
| Line | USD |
|---|---|
| Net loss | -380,000 |
| Depreciation and amortisation | 600,000 |
| Stock-based compensation | 700,000 |
| Change in accounts receivable | -400,000 |
| Change in prepaid expenses | -100,000 |
| Change in accounts payable | 120,000 |
| Change in accrued expenses | 200,000 |
| Change in deferred revenue | 1,000,000 |
| Cash from operating activities | 1,740,000 |
| Purchases of property and equipment | -600,000 |
| Capitalised software development | -1,000,000 |
| Cash from investing activities | -1,600,000 |
| Term loan proceeds | 1,500,000 |
| Term loan repayments | -500,000 |
| Equity issued | 500,000 |
| Cash from financing activities | 1,500,000 |
| Net change in cash | 1,640,000 |
| Beginning cash | 2,000,000 |
| Ending cash | 3,640,000 |
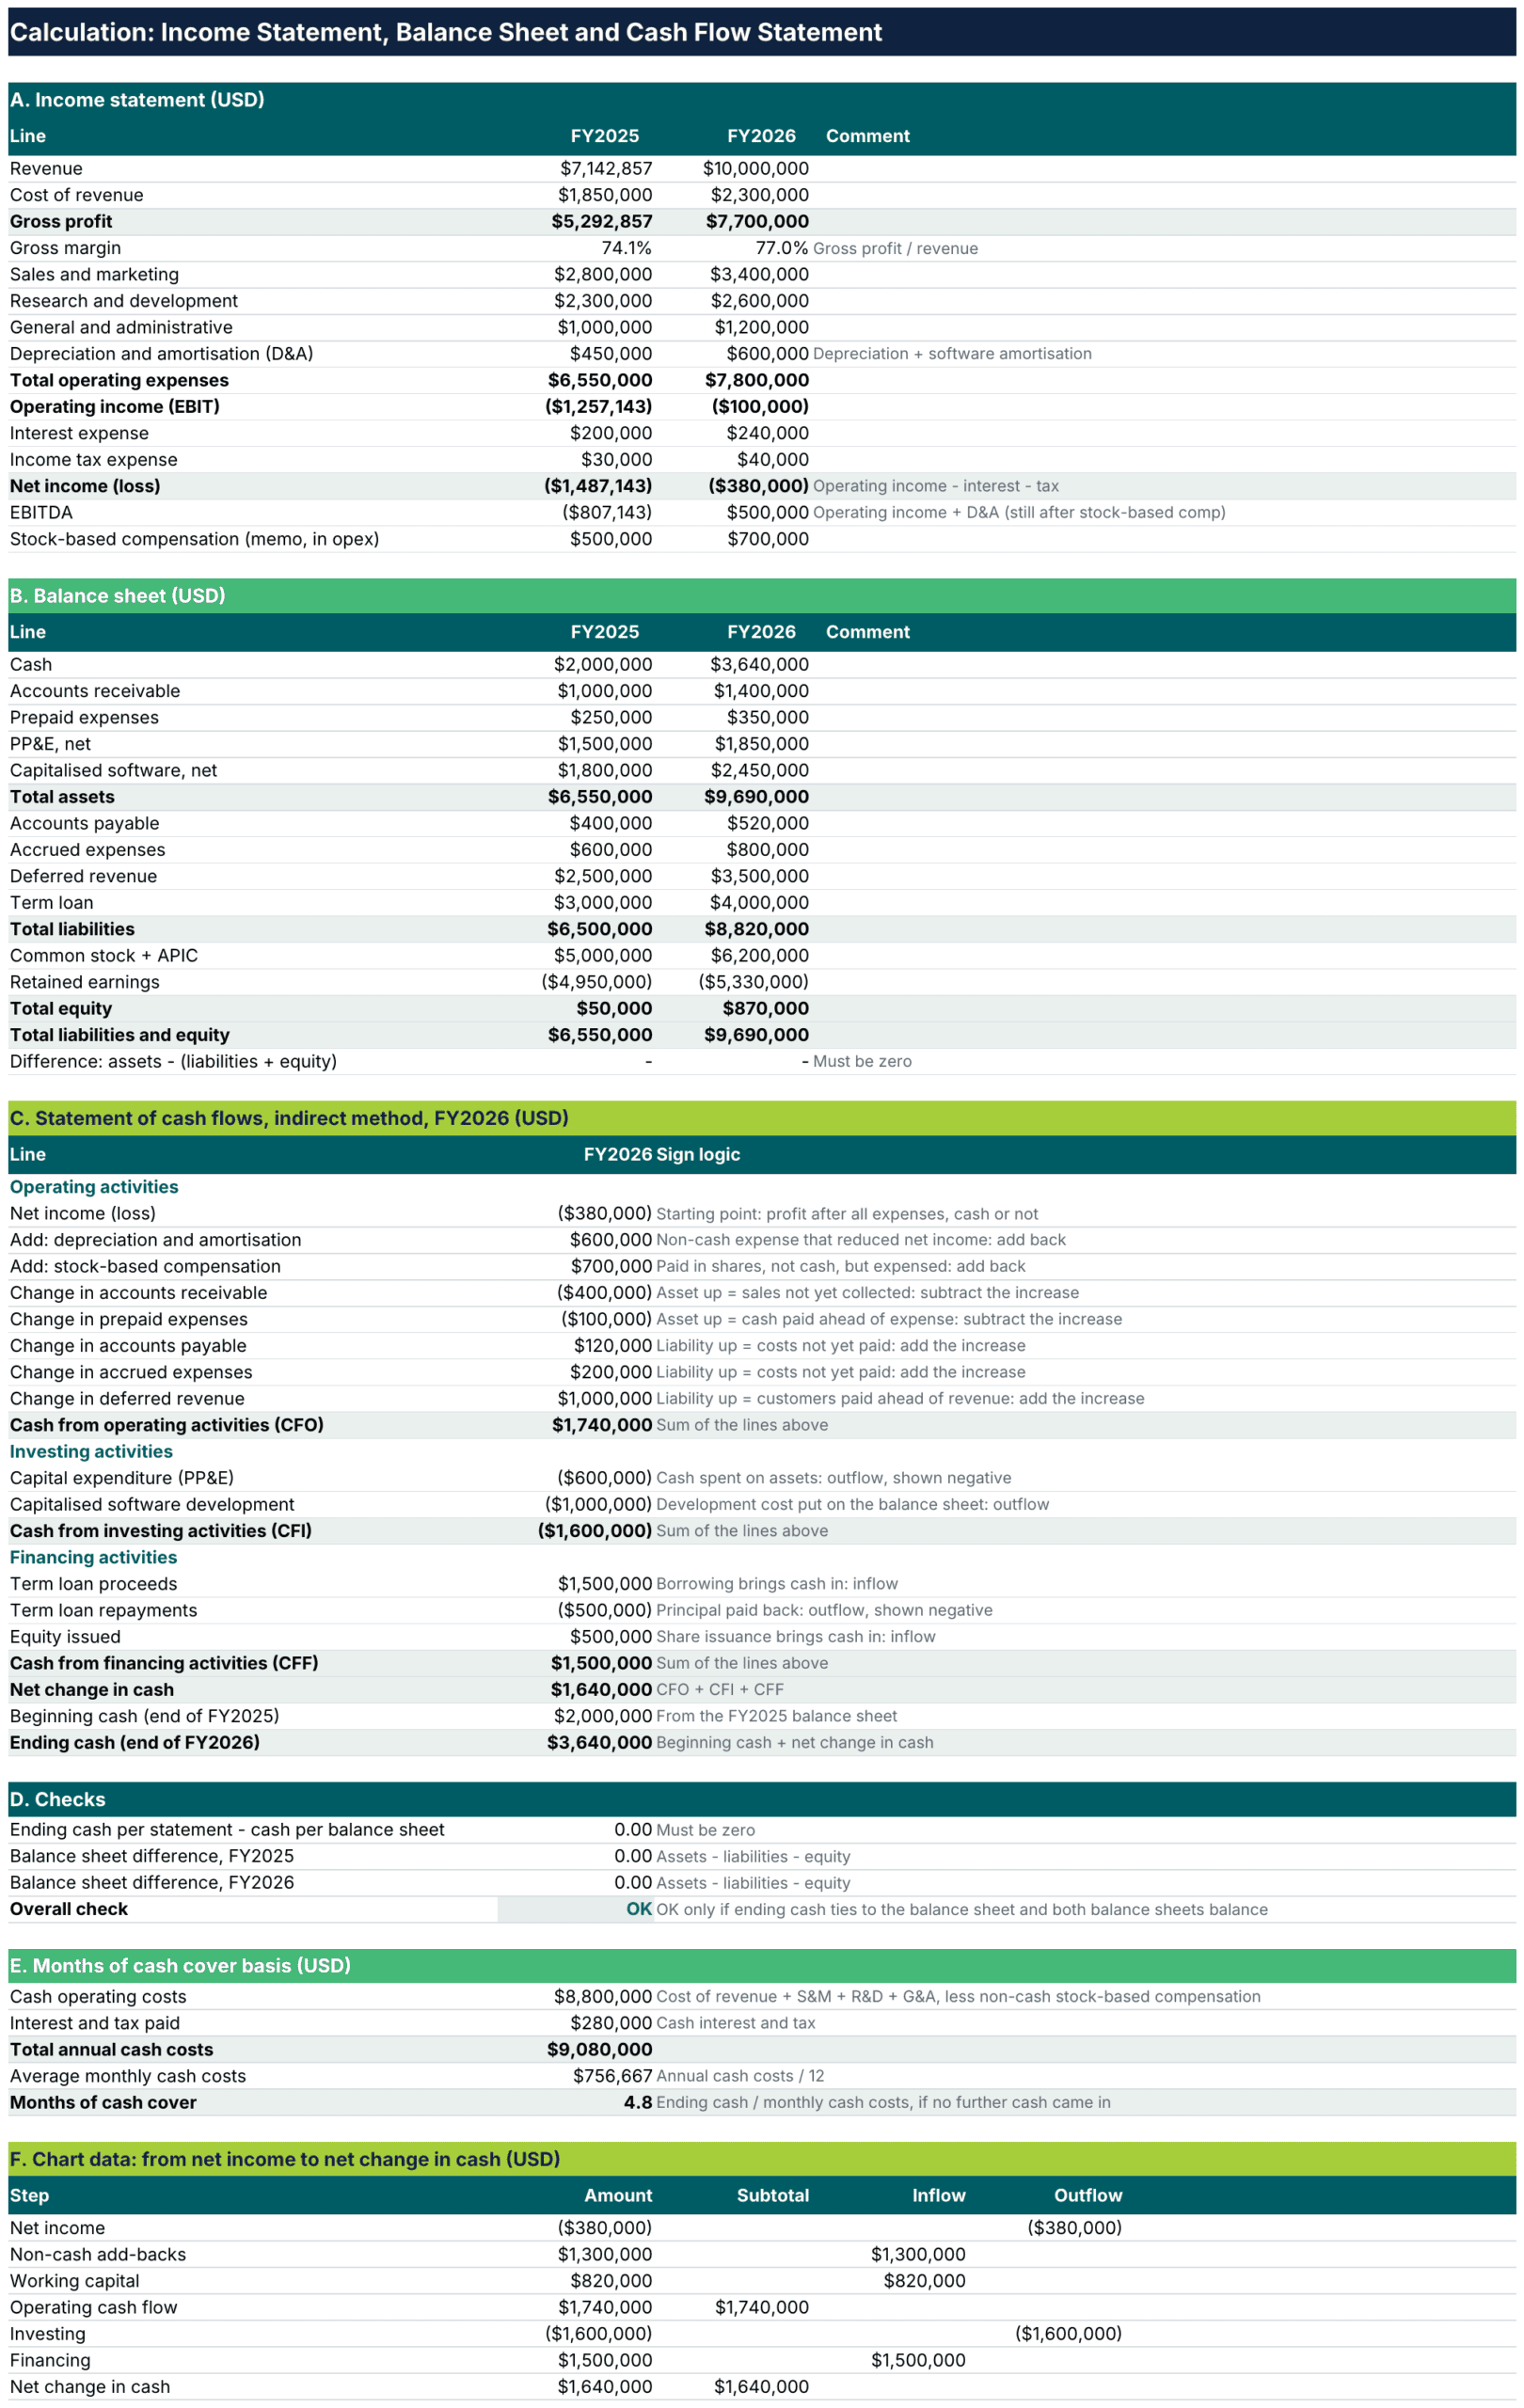
The calculation sheet moves from net loss to ending cash and proves the result with a check cell. Source: eFinancialModels Analysis
Investing absorbed USD 1,600,000, of which USD 1,000,000 was capitalised software, and financing supplied USD 1,500,000. Adding the three subtotals, 1,740,000 + (-1,600,000) + 1,500,000, gives a net change of USD 1,640,000, and beginning cash of USD 2,000,000 plus that change equals ending cash of USD 3,640,000. Free cash flow, which is operating cash flow minus capital spending (purchases of property and equipment plus capitalised software), was only USD 140,000, and deducting the USD 700,000 of stock-based compensation, an expense paid in shares, would turn it to negative USD 560,000.
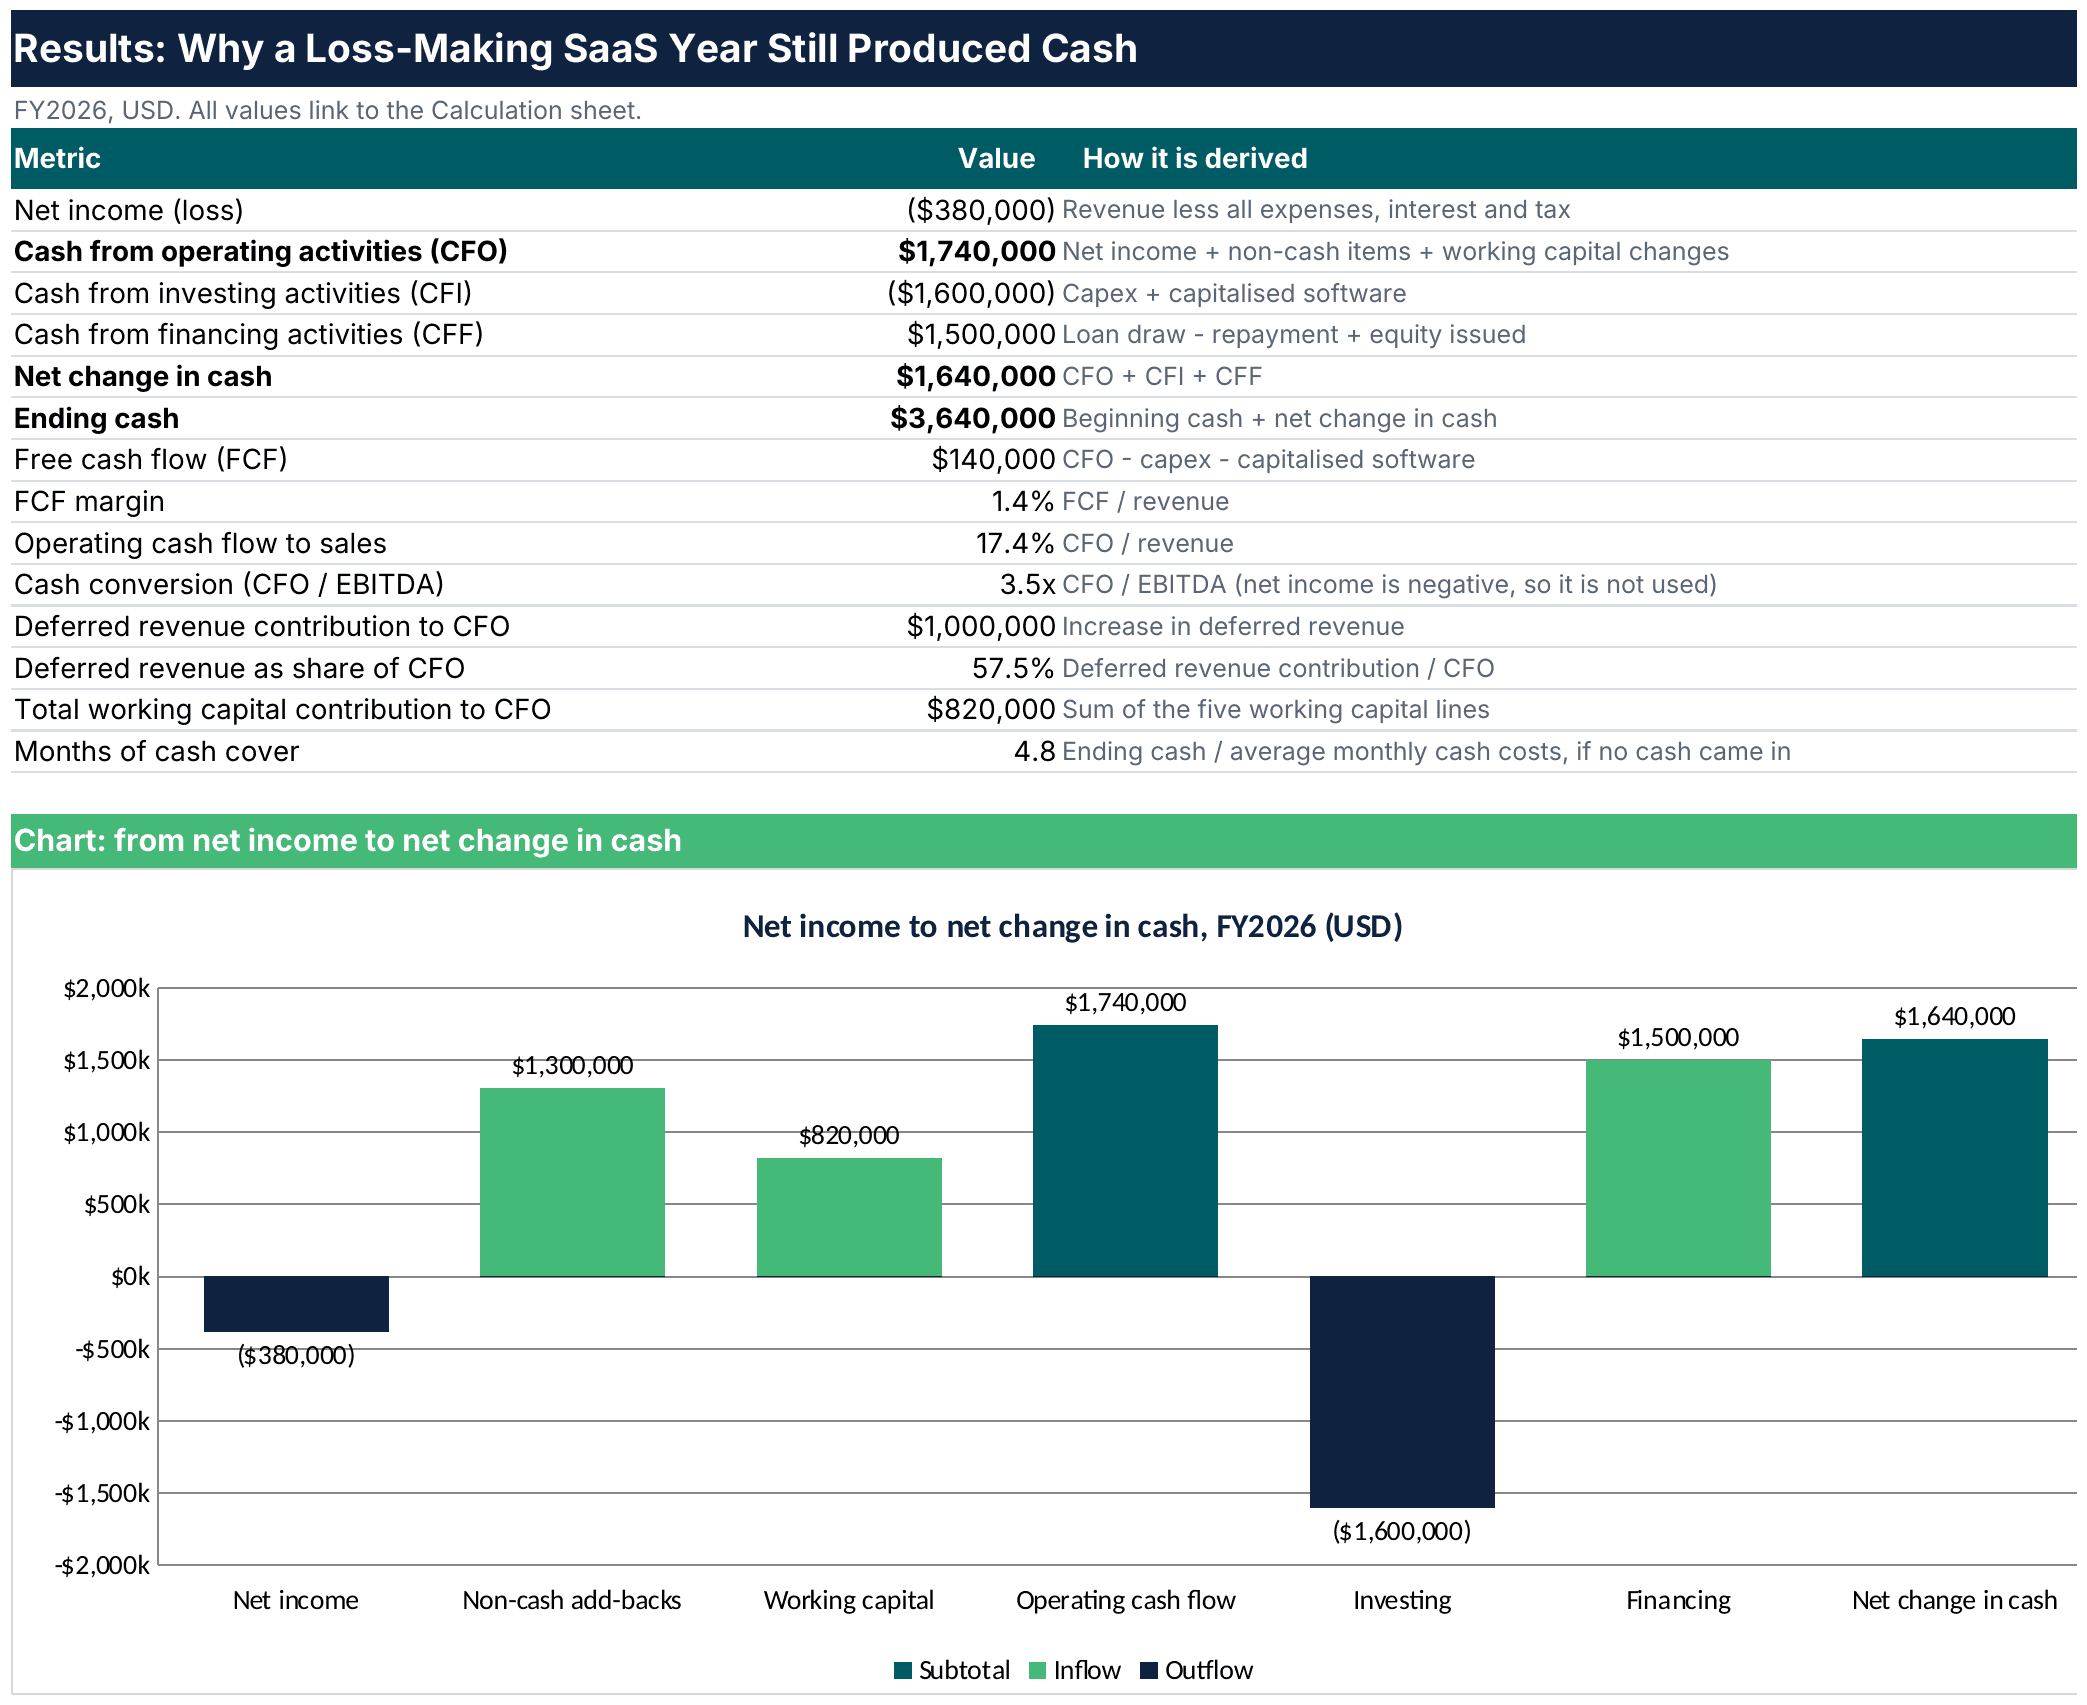
The results sheet shows operating cash flow of USD 1,740,000 against a net loss of USD 380,000. Source: eFinancialModels Analysis
Owners who want to extend this structure into linked forecasts can browse the cash flow analysis models at eFinancialModels.
Cash Flow Analysis Ratios & Industry Benchmarks
Three ratios turn the statement into a decision tool: operating cash flow to sales (operating cash flow divided by revenue), the free cash flow margin (free cash flow divided by revenue) and months of cash cover (ending cash divided by average monthly cash costs). Tracking them side by side is easier with the financial ratios collection.
| Ratio | Formula | Worked example |
|---|---|---|
| Operating cash flow to sales | Operating cash flow / revenue | 1,740,000 / 10,000,000 = 17.4% |
| Free cash flow margin | Free cash flow / revenue | 140,000 / 10,000,000 = 1.4% |
| Months of cash cover | Ending cash / average monthly cash costs | 3,640,000 / 756,667 = 4.8 months |
Monthly cash costs in the example are annual costs excluding stock-based compensation and depreciation and amortisation, plus interest and tax, divided by 12, and the ratio assumes no further receipts.
Public filings show how widely the first ratio varies. Salesforce reported USD 14,996 million of operating cash flow on USD 41,525 million of revenue for the fiscal year ended 31 January 2026, which is 36.1%, while Caterpillar reported USD 11.7 billion of enterprise operating cash flow on USD 67.6 billion of sales and revenues for 2025, about 17%. Each is a single large company, not an industry average. Aswath Damodaran’s January 2026 US industry data lists free cash flow to equity before debt cash flows of 82,068.68 against net income of 162,155.45 for software (system and application) companies, and 22,524.53 against 20,804.48 for machinery companies, with the page stating no units. Software converts about half of net income into that measure and machinery slightly more than all of it, a context that is not comparable to a loss-making year but shows that sector mix matters.
Common Cash Flow Statement Mistakes (and How to Avoid Them)
Five errors cause most reconciliation failures:
- Wrong working capital signs. Subtract asset increases and add liability increases.
- Misclassified lines. Capital expenditure and capitalised software belong in investing, while inventory builds and deferred revenue belong in operating.
- Profit presented as cash. Net income ignores timing, so only the statement shows cash after working capital.
- No reconciliation. Ending cash must equal balance sheet cash every period.
- Forgotten non-cash items. Stock-based compensation and amortisation need add-backs.
Regulators see the same problems. Paul Munter, Chief Accountant of the U.S. Securities and Exchange Commission (SEC), stated in December 2023 that the statement of cash flows has consistently been a leading area of restatements, and the Public Company Accounting Oversight Board’s 2025 inspection report on KPMG (a large audit firm), dated 21 May 2026, lists testing of the statement of cash flows among its target-team focus areas.
Industry Variations: Manufacturing vs. SaaS
| Driver | Manufacturing | SaaS |
|---|---|---|
| Largest working capital line | Inventory and receivables | Deferred revenue and receivables |
| Typical investing outflow | Machinery and plant | Capitalised software and equipment |
| Main timing risk | Cash tied up in stock before sale | Prepayments lifting operating cash ahead of revenue |
Manufacturers build inventory before a sale, an operating outflow, and spend heavily on equipment in investing. SaaS companies often bill ahead: Salesforce’s operating cash flow for the year ended 31 January 2026 included a USD 2,924 million increase in unearned revenue, the line the company uses for amounts invoiced before revenue is recognised.
Tools & Templates to Automate Your Cash Flow Analysis
A cash flow projection is enough when the question is how long cash lasts; a three-statement model is needed when the same numbers must feed a lender, an investor or a scenario comparison.
| Situation | Better fit | Reason |
|---|---|---|
| Only the weeks or months of remaining cash matter | Cash flow projection | Receipts and payments by period, no balance sheet needed |
| A short timing gap, such as a month before annual renewals are billed | Cash flow projection | A weekly view shows the low point |
| A term loan or covenants, like the example’s USD 4,000,000 loan | Three-statement model | Debt, interest and ratios must tie to the balance sheet |
| An equity raise or investor reporting | Three-statement model | Investors read profit, balance sheet and cash together |
| Comparing growth, pricing or collection scenarios | Three-statement model | One change flows through profit, working capital and cash |
On the same SaaS inputs, a projection would stop at the cash path and the 4.8 months of cover, while a three-statement model also shows that deferred revenue supplied USD 1,000,000 of the USD 1,740,000 operating cash and keeps the balance sheet in balance. Companies with covenants or audited reporting should confirm requirements with their lender or accountant.
Owners can test growth, pricing and collection assumptions with scenario analysis models, and subscription businesses can start from the SaaS financial model category.
Frequently Asked Questions
Does the IRS require a cash flow statement?
The Internal Revenue Service (IRS) explains accounting methods in Publication 538, which says that under the cash method income is generally reported in the tax year it is received and under the accrual method in the year it is earned. The publication does not mention a statement of cash flows, so the statement works as a management and financing document rather than a tax form. The chosen tax method still shapes when income is taxed.
Should a growth-stage company use the direct or the indirect method?
The indirect method suits companies that keep accrual books, because it starts from the net income the accounting system already produces and needs no ledger of cash received by customer. The direct method lists cash collected from customers and paid to suppliers, which shows collections clearly but requires tagging every bank transaction. Many growth-stage teams report with the indirect statement and keep a direct weekly forecast for treasury decisions.
How often should the statement be prepared?
Monthly is the practical rhythm for a company with tight liquidity or a lender covenant, because working capital moves quickly during rapid growth. Quarterly preparation is common for investor reporting, but the terms of the investor or lender agreement decide. Rolling twelve-month views help owners spot seasonality, and a short variance note beside each close, explaining why receivables or prepayments moved, makes the next forecast more reliable than the numbers alone.
What is the difference between a cash flow statement and a cash flow projection?
The statement reports what already happened and reconciles to the closing balance sheet. The projection estimates future receipts and payments, often week by week over thirteen weeks, and guides decisions on hiring, spending and borrowing. Comparing projected cash with actual cash after each close is the quickest way to improve forecast accuracy, since every persistent gap points to a wrong collection or payment assumption.
How should owner draws and loan repayments be classified?
Principal repayments, owner draws and dividends belong in financing activities, as do loan proceeds and owner contributions. Interest paid stays in operating activities under U.S. accounting standards, even though the loan itself is financing. When a loan funds equipment, show the loan proceeds in financing and the purchase in investing as two gross lines instead of netting them, so each activity remains a true picture of its own cash.
Conclusion & Next Steps
A reliable cash flow statement needs net income adjusted for non-cash items and working capital, correct classification into the three activities and a check cell that ties ending cash to the balance sheet. Growth-stage subscription owners who want the income statement, balance sheet and cash flow statement linked in one monthly and annual forecast can explore the eFinancialModels SaaS Business Financial Model, which prepares a three-statement forecast.