
0 ITEMS

Restaurant Menu Costing & Break-Even Excel Model – Food Costs, Contribution Margin & Pricing Dashboard
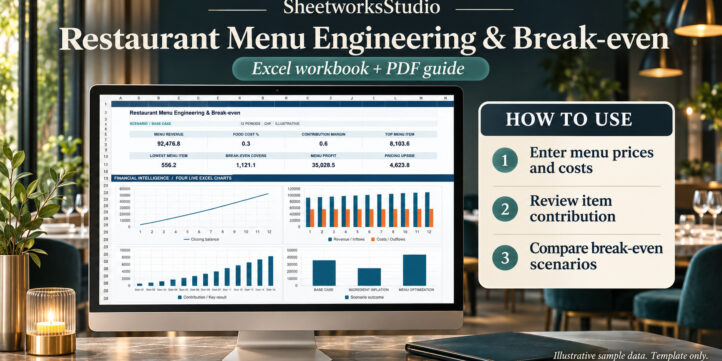
Professional Excel template for restaurant menu costing, food cost analysis, dish-level contribution and break-even planning. Includes 100 menu item rows, yield and waste assumptions, a 12-period operating forecast, three financial scenarios, an executive dashboard with four charts, and a six-page PDF guide.
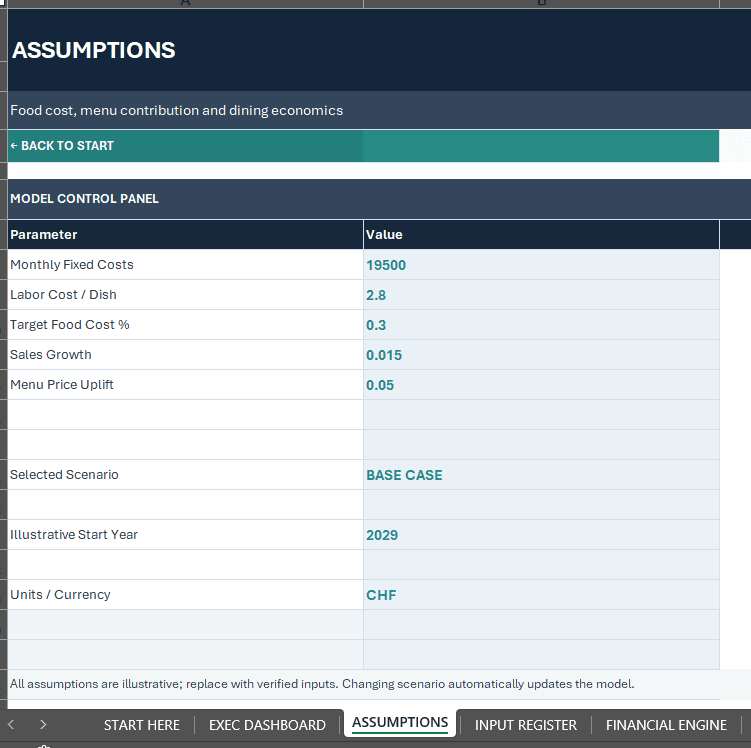
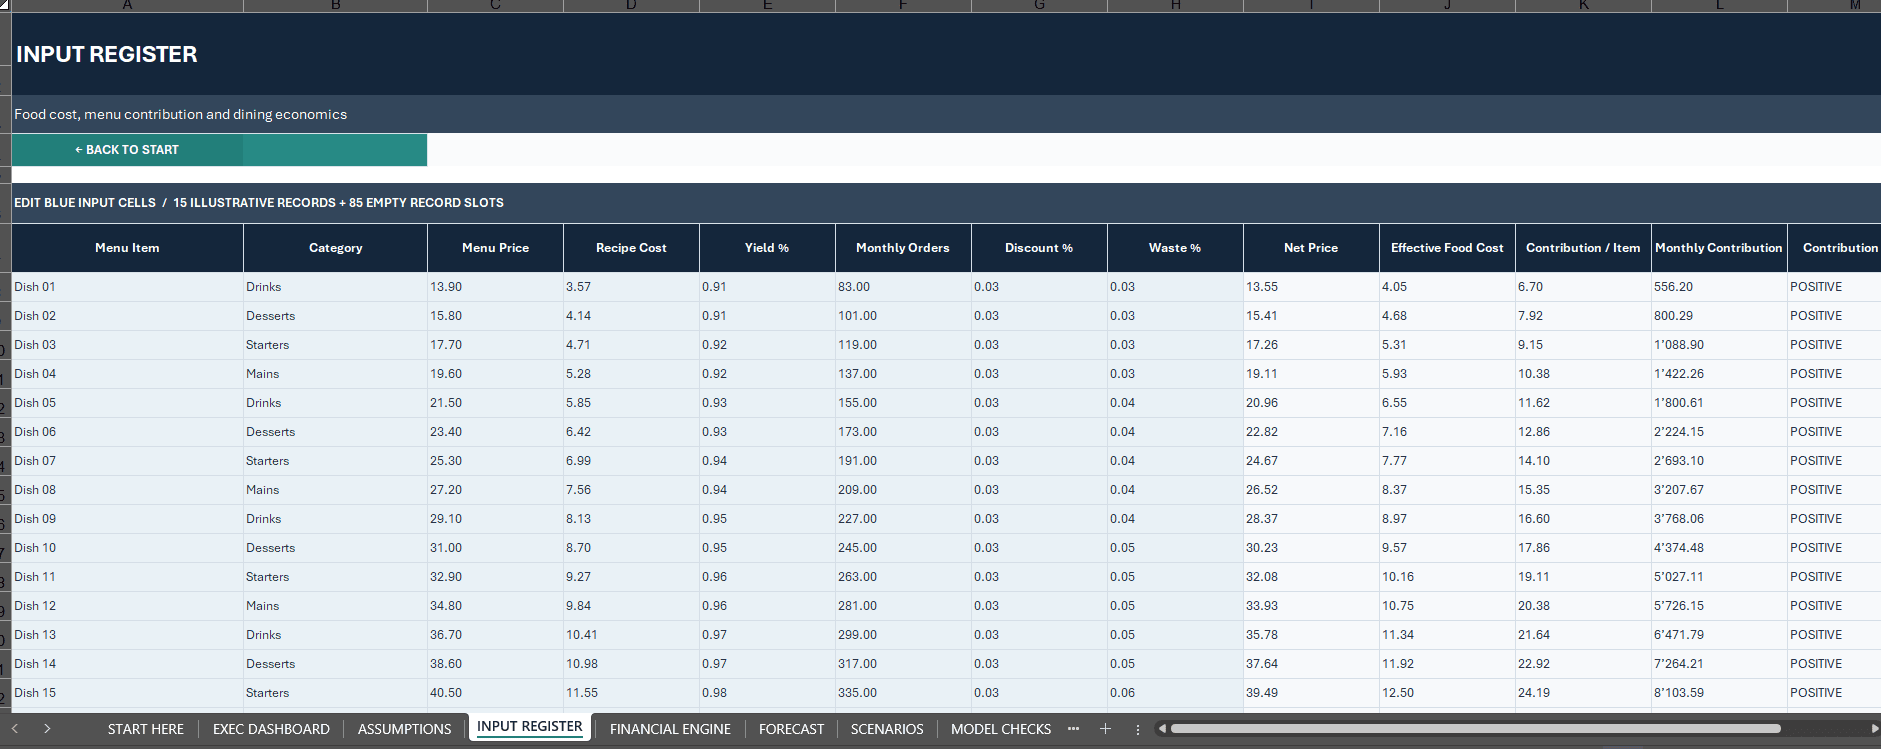
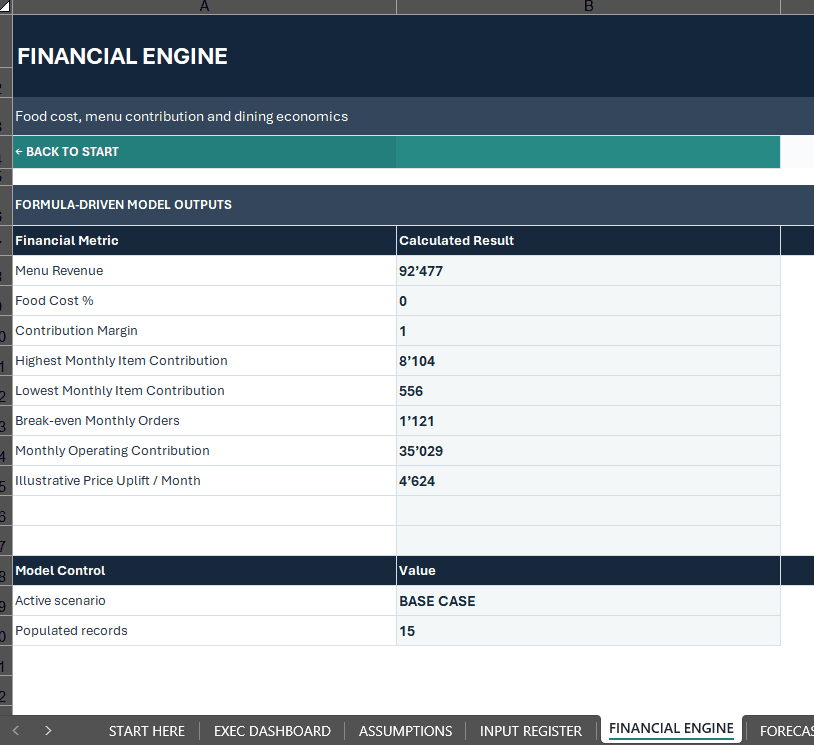
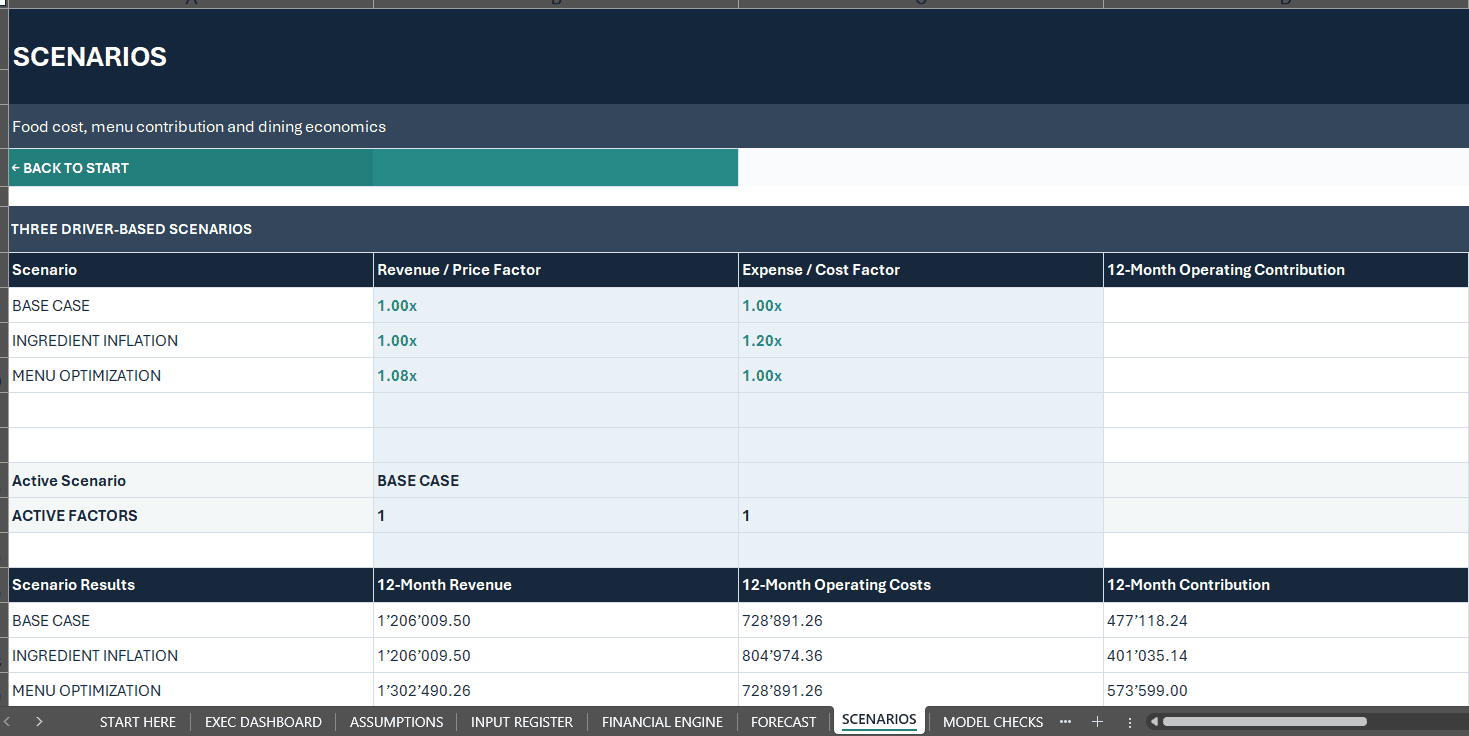
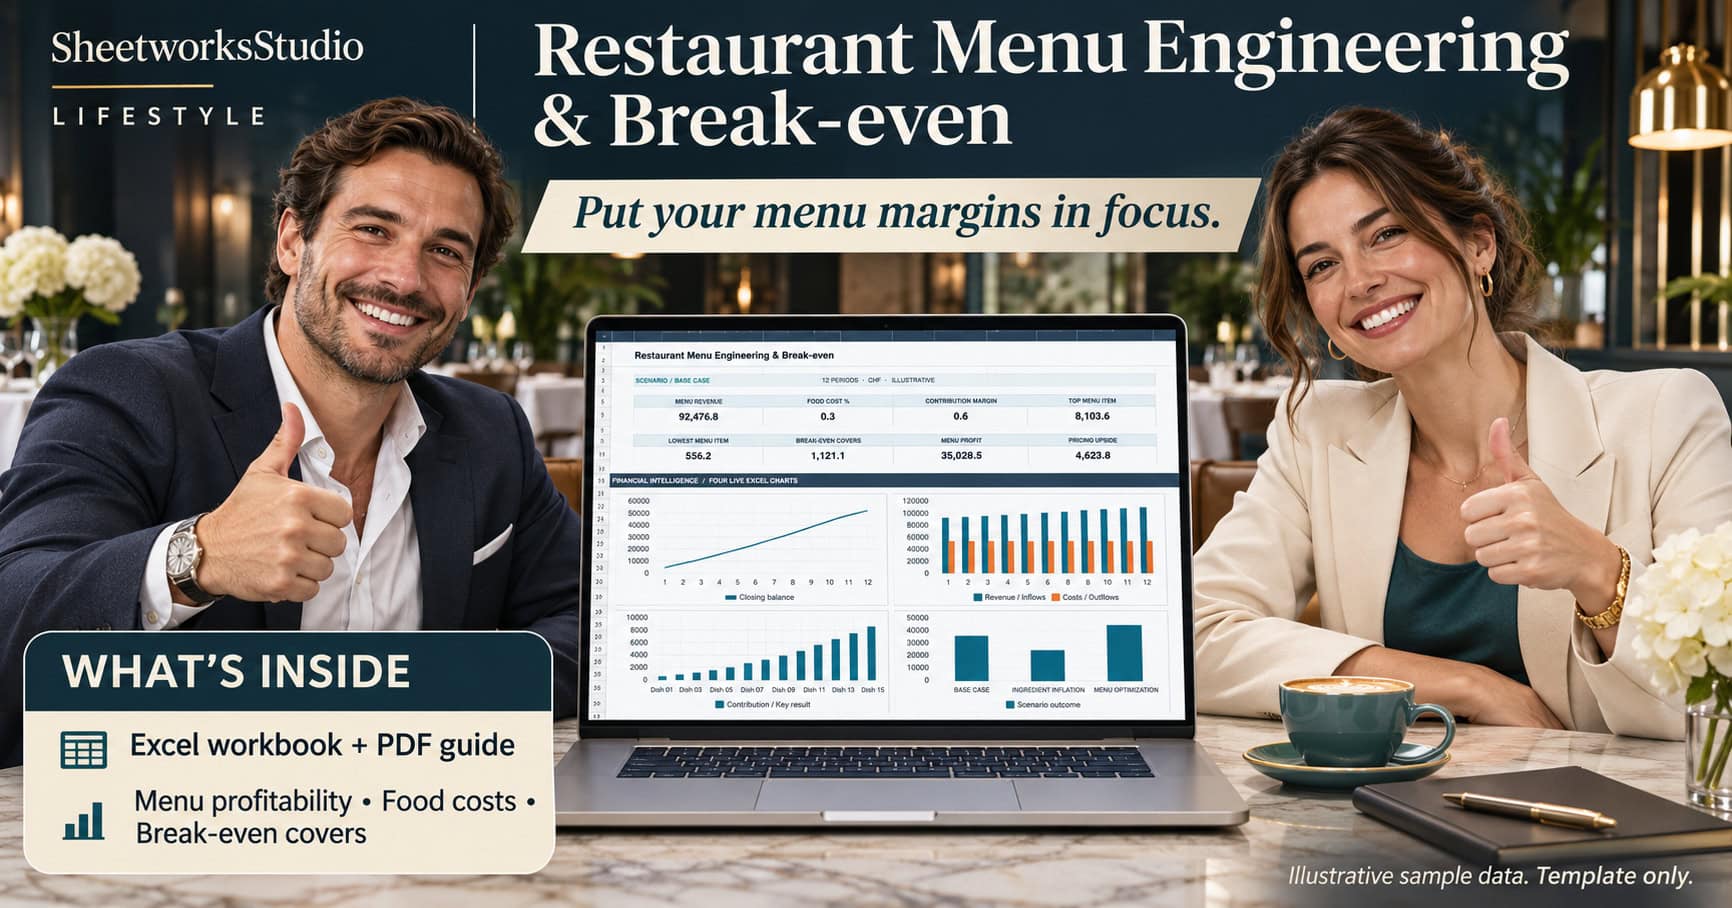
🍽️ RESTAURANT MENU COSTING & CONTRIBUTION MODEL
Premium Excel Template | Food Cost Analysis • Menu Pricing • Contribution Margin • Break-Even Planning
Understand your menu costs. Evaluate dish profitability. Make more informed pricing and operating decisions.
The Restaurant Menu Costing & Contribution Model by SheetworksStudio is a professional, fully editable Excel planning tool designed for restaurant owners, café operators, hospitality managers, food-service entrepreneurs, and business consultants.
Bring your menu selling prices, ingredient costs, preparation yields, waste allowances, discounts, expected order volumes, and operating expenses into one structured financial planning workbook.
Analyze dish-level contribution, review food-cost percentages, estimate break-even order volumes, and explore how ingredient inflation or menu pricing adjustments could influence modeled operating performance.
With an integrated calculation engine, a 12-period operating forecast, three financial scenarios, and a visual executive dashboard, this template provides a practical foundation for preliminary restaurant menu profitability analysis.
📊 KEY FEATURES & CAPABILITIES
🍽️ 1. Menu Item & Category Management
Organize your restaurant’s menu economics through a flexible, editable register.
- 100 menu item input rows
- 15 fictional example dishes
- 85 additional input slots
- Menu item names and categories
- Individual selling prices
- Recipe ingredient costs
- Preparation yield percentages
- Expected monthly order volumes
- Customer discount assumptions
- Food waste allowances
Designed to support structured menu reviews across appetizers, main courses, desserts, beverages, and other product categories.
💰 2. Food Cost & Dish Contribution Analysis
Understand the modeled financial contribution of each menu item after its direct costs.
Included Calculations
- Net Selling Price
- Effective Food Cost
- Food Cost Percentage
- Contribution per Dish
- Monthly Dish Contribution
- Total Menu Revenue
- Weighted Contribution Margin
- Monthly Operating Contribution
Effective food costs take preparation yield and waste allowances into account.
A configurable labor cost per dish helps estimate contribution after direct ingredient and assigned labor costs.
📈 3. Restaurant Break-Even Planning
Explore how many monthly dish orders may be required to cover the restaurant’s modeled fixed operating expenses.
Break-Even Indicators
- Monthly Fixed Operating Costs
- Average Contribution per Order
- Estimated Break-Even Monthly Orders
- Monthly Menu Revenue
- Monthly Operating Contribution
- Illustrative Pricing Upside
The break-even estimate uses the current weighted menu contribution and expected sales mix.
Actual results depend on customer demand, menu mix, staffing, operational efficiency, and the accuracy of cost assumptions.
🔄 4. Three Financial Scenarios
Compare alternative operating assumptions to understand their effect on restaurant menu profitability.
BASE CASE
Evaluate the modeled menu using existing selling prices, recipe costs, and operating assumptions.
INGREDIENT INFLATION
Explore the effect of a 20% increase in modeled ingredient costs while keeping the baseline price assumptions unchanged.
MENU OPTIMIZATION
Assess an illustrative 8% selling-price increase without automatically assuming changes in customer demand.
Each scenario provides comparable 12-month revenue, operating cost, and contribution estimates.
Ingredient inflation is applied to modeled food costs, not automatically to fixed operating expenses or labor allowances.
📉 5. 12-Period Operating Forecast
Explore an illustrative twelve-month view of menu revenue and operating contribution.
- Monthly modeled revenue
- Food and direct labor cost projections
- Monthly fixed operating expenses
- Monthly operating contribution
- Cumulative operating contribution
- Illustrative revenue sensitivity
- Base Case versus selected scenario comparison
The forecast applies simplified monthly growth assumptions to revenue and variable operating costs.
Cumulative operating contribution is not an actual bank cash balance or complete accounting profit measure.
📊 6. Executive Restaurant Dashboard
Review modeled restaurant menu performance through an integrated executive dashboard.
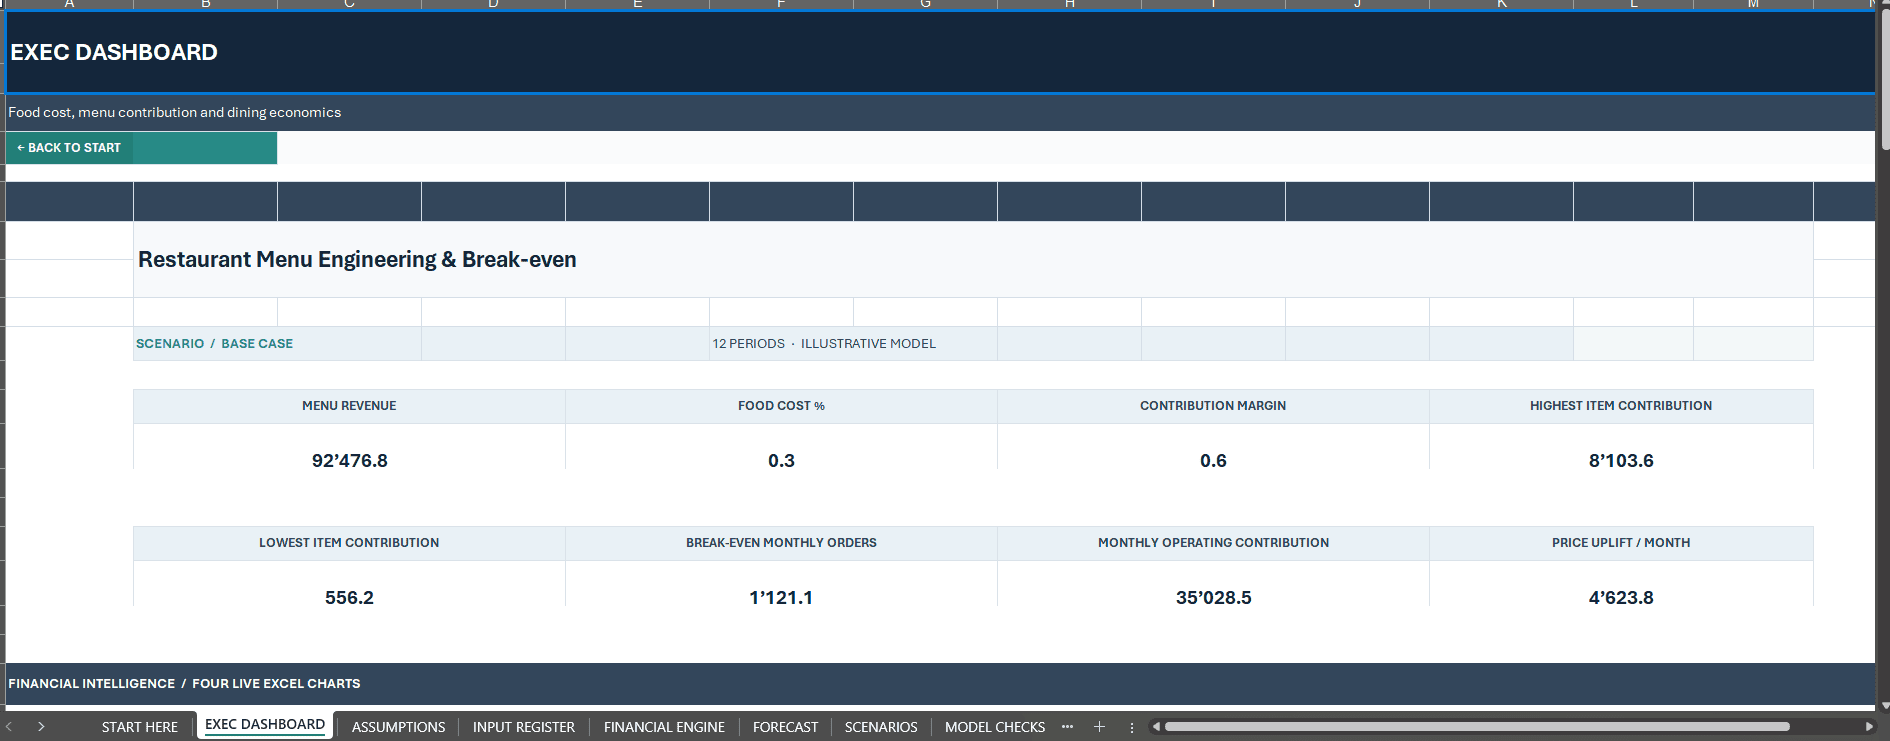
8 Financial KPI Cards
- Menu Revenue
- Food Cost Percentage
- Contribution Margin
- Highest Monthly Item Contribution
- Lowest Monthly Item Contribution
- Break-Even Monthly Orders
- Monthly Operating Contribution
- Illustrative Pricing Upside
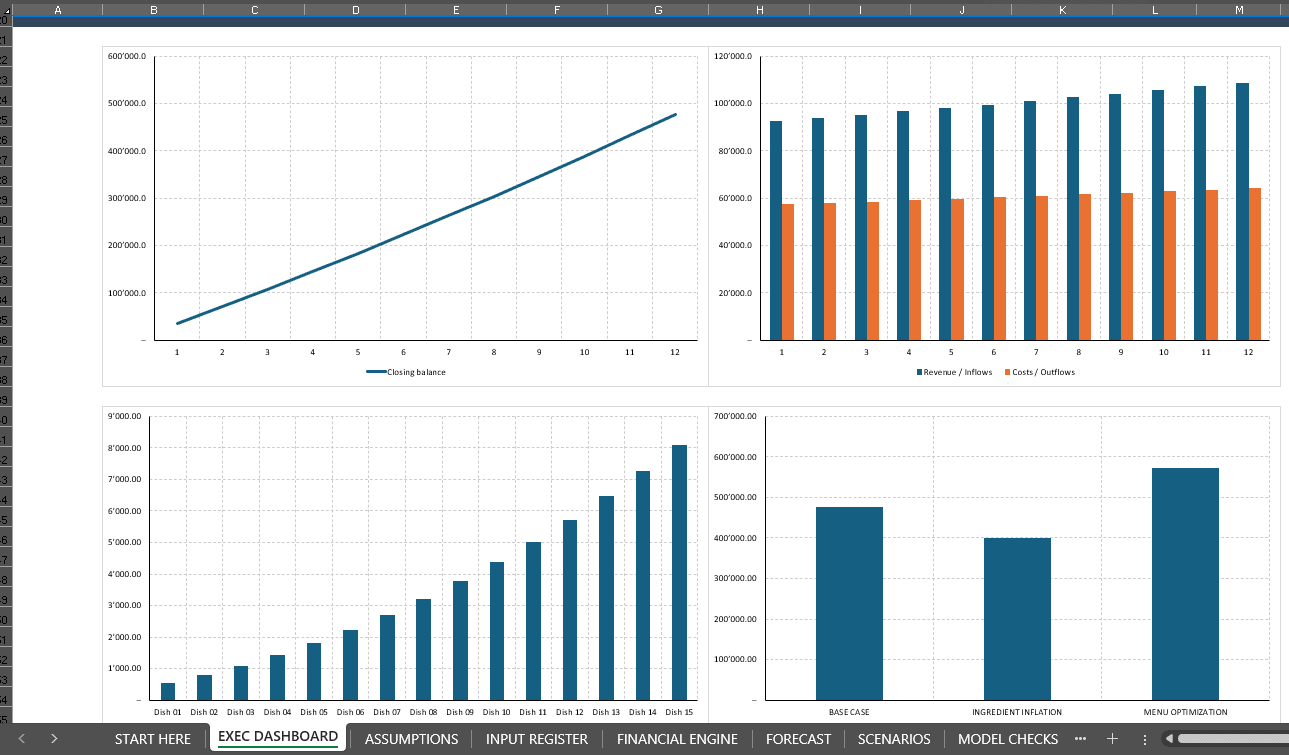
4 Native Excel Charts
Visualize financial trends, menu contributions, and scenario-based results directly within the workbook.
The dashboard is linked to the financial engine and updates when underlying assumptions and input records change.
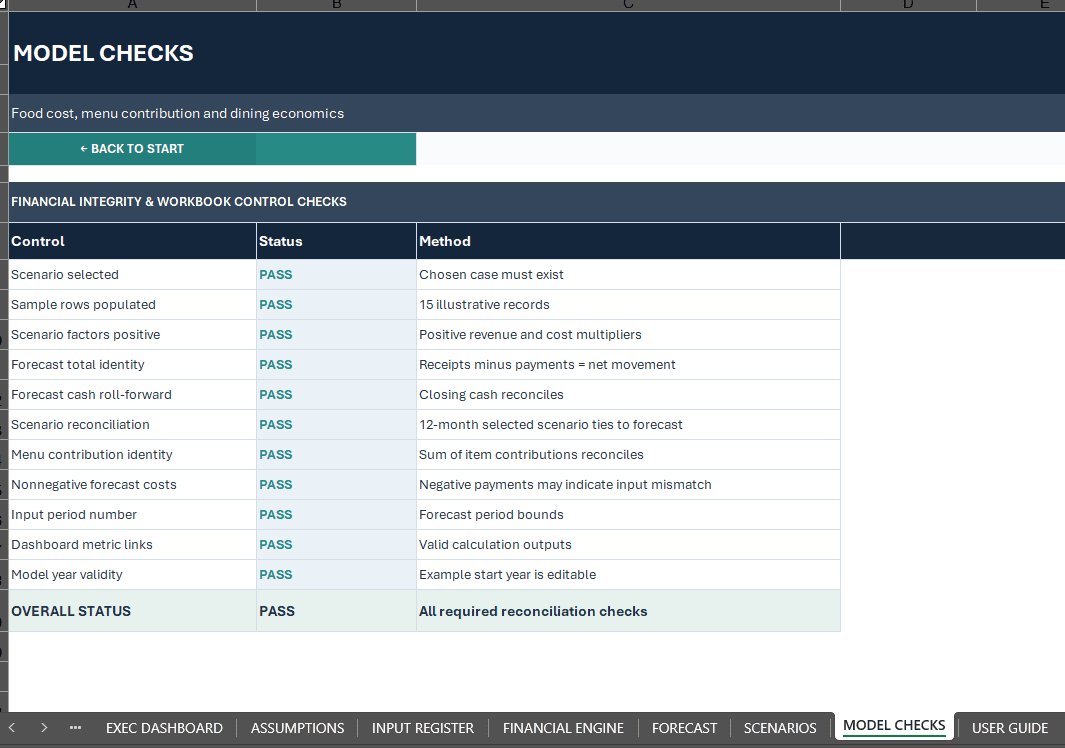
✅ 7. Built-In Model Integrity Controls
Dedicated checks help support transparent workbook operation.
- Scenario selection validation
- Positive scenario-factor checks
- Menu contribution reconciliation
- Forecast revenue and cost identity
- Cumulative contribution roll-forward
- Selected scenario reconciliation
- Input and forecast-period checks
- Overall model status indicator
These checks support internal workbook review but do not constitute an independent financial audit.
📁 WHAT’S INCLUDED
Your purchase includes:
✅ 1 Premium Editable Excel Workbook (.xlsx)
✅ 9 Interconnected Worksheets
✅ 1 Professional Six-Page PDF How-to-Use Guide
✅ 100 Menu Item Input Rows
✅ 15 Fictional Menu Examples
✅ 85 Additional Input Rows
✅ Food Cost & Contribution Calculations
✅ Simplified Break-Even Analysis
✅ 12-Period Illustrative Operating Forecast
✅ 3 Financial Scenarios
✅ Executive Dashboard with 8 KPIs
✅ 4 Native Excel Charts
✅ Built-In Model Integrity Checks
All example menu items and financial values are fictional and provided for demonstration purposes.
⚙️ HOW TO USE THE MODEL
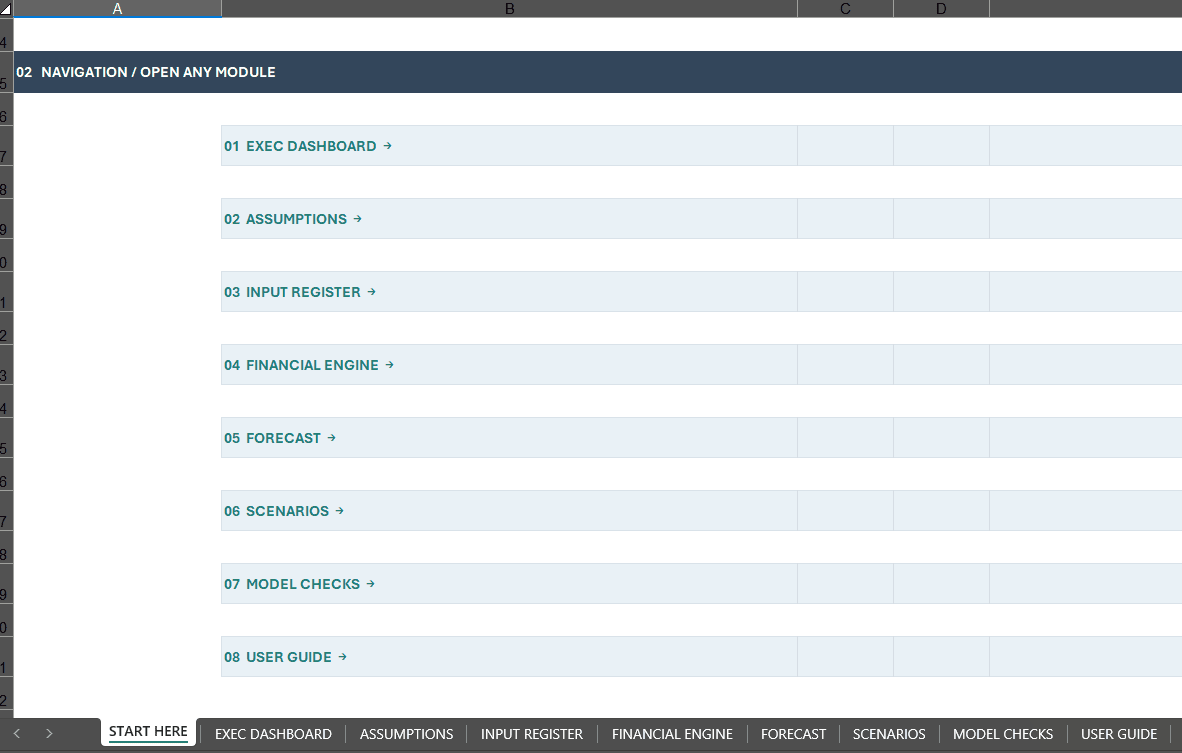
STEP 1 — START HERE
Review the workbook structure, navigation, and key instructions.
STEP 2 — CONFIGURE ASSUMPTIONS
Enter monthly fixed costs, labor cost per dish, target food-cost percentage, sales growth, and potential menu price uplift.
STEP 3 — UPDATE THE MENU REGISTER
Replace fictional menu items with your own selling prices, recipe costs, yields, monthly orders, discount rates, and waste allowances.
STEP 4 — ANALYZE DISH CONTRIBUTION
Review effective food costs, contribution per dish, and estimated monthly menu contribution.
STEP 5 — REVIEW BREAK-EVEN RESULTS
Examine modeled revenue, operating contribution, and estimated break-even order requirements.
STEP 6 — EXPLORE THE FORECAST
Review the illustrative twelve-period operating results and cumulative contribution.
STEP 7 — COMPARE SCENARIOS
Evaluate Base Case, Ingredient Inflation, and Menu Optimization outcomes.
STEP 8 — REVIEW THE DASHBOARD
Explore consolidated restaurant metrics and Excel charts.
STEP 9 — VALIDATE MODEL RESULTS
Check the model integrity indicators and review any warnings or failed controls.
No macros or programming knowledge required.
👥 WHO IS THIS TEMPLATE FOR?
Designed for:
- Restaurant Owners
- Café and Bistro Operators
- Hospitality Business Managers
- Food-Service Entrepreneurs
- Restaurant Financial Analysts
- Restaurant Operations Managers
- Hospitality Consultants
- Small Restaurant Groups
- Independent Food Businesses
Typical Applications
- Restaurant Menu Costing
- Dish-Level Contribution Analysis
- Food Cost Percentage Review
- Menu Pricing Discussions
- Restaurant Break-Even Planning
- Ingredient Cost Sensitivity
- Menu Profitability Analysis
- Restaurant Operating Budget Discussions
- Preliminary Menu Optimization
💻 TECHNICAL SPECIFICATIONS
Specification Details File Format Microsoft Excel XLSX Worksheets 9 Menu Input Capacity 100 Rows Fictional Examples 15 Additional Input Rows 85 Forecast Horizon 12 Monthly Periods Financial Scenarios 3 Dashboard KPI Cards 8 Native Excel Charts 4 PDF User Guide 6 Pages Illustrative Start Year 2029 Macros None External Data Connections None Recommended Software Microsoft Excel Desktop Language English
Google Sheets import has not been independently validated. Some formulas, chart formatting, or validation functionality may differ after import.
⚠️ IMPORTANT MODEL SCOPE & LIMITATIONS
This workbook is designed for simplified restaurant menu costing, dish-level contribution analysis, and preliminary operating break-even planning.
It is not a complete restaurant accounting system, POS integration, inventory management solution, detailed recipe ingredient database, or comprehensive restaurant financial model.
Recipe costs, yields, waste assumptions, and labor allowances require independent verification. Users should avoid double-counting ingredients or losses already included in source costs.
The contribution flags distinguish positive, zero, and negative per-item contribution. They do not represent a comprehensive four-quadrant menu engineering classification based on profitability and popularity.
Break-even calculations use a simplified weighted menu mix and contribution approach. Actual required sales volumes may differ.
The menu optimization scenario illustrates price changes without automatically modeling customer demand elasticity.
The twelve-period forecast represents modeled operating contribution, not actual bank cash flow, recognized accounting profit, or audited financial performance.
All assumptions and calculated results should be independently reviewed before making operational, pricing, or financial decisions.
🛡️ INDEPENDENT TEMPLATE & LEGAL NOTICE
Digital product only — no physical item will be shipped.
This product is an independent, unofficial Excel planning template developed by SheetworksStudio.
It is not certified, independently audited, or officially endorsed by any restaurant industry organization, financial institution, software provider, or regulatory authority.
The workbook does not constitute financial, investment, accounting, tax, or legal advice.
All example information is fictional. Buyers are responsible for independently verifying assumptions, formulas, calculations, and outputs before using the template for business decisions.
No specific sales, profitability, cost savings, break-even achievement, or business outcome is guaranteed.
SHEETWORKSSTUDIO
Calm design. Clear logic.
Professional Financial Templates • Structured Analysis • Smarter Planning
Similar ProductsOther customers were also interested in...



 eFinancialModels
Electric Vehicle (EV) Charging Station Financial M...
With this comprehensive 5- or 10-year monthly tool, investors can assess the viability of setting up... Read more

Financial Model for Mobile App | Mobile App Busine...
The Mobile App Financial Plan Template in Excel allows you to develop financial projections when lau... Read more

 HenrySheykin
Food Truck Financial Model Excel Template
The Food Truck Financial Model helps entrepreneurs, founders, business owners, consultants, and anal... Read more

Green Hydrogen Production from Wind Energy Financi...
The Green Hydrogen from Wind Financial Model aims to comprehensively forecast a horizon of 40 years ... Read more

Simple Mutual Non-Disclosure Agreement Template
Protect your business secrets with ease using our Simple Mutual Non-Disclosure Agreement Template. S... Read more

Solar Energy Financial Model
The Solar Energy Financial Model Spreadsheet Template in Excel assists you in preparing a sophistica... Read more

 Peter Graf
The Customer-Centric Financial Model for Restauran...
Starting a restaurant without a financial plan is like driving a car blindfolded. You wouldn´t do i... Read more
You must log in to submit a review.