
0 ITEMS

Real Estate Private Equity Waterfall Financial Model Excel – 12-Year, European vs American, GP Clawback & LP IRR
A 12-year real estate private equity financial model with 15 investment cases, European whole-fund and American deal-level waterfalls, three GP promote tiers, final clawback, 15 LP allocations, GP carry escrow, fee drag and 7 × 7 exit sensitivity. Includes 21 editable Excel worksheets, eight native charts, 41 financial checks and a comprehensive 34-page PDF guide.





REAL ESTATE PRIVATE EQUITY WATERFALL FINANCIAL MODEL – 12-YEAR SIGNATURE EDITION
Compare European and American distribution waterfalls, GP carried interest and LP investor outcomes across one connected portfolio of real estate investments.
The Real Estate Private Equity Waterfall Financial Model by SheetworksStudio brings acquisition underwriting, annual property cash flows, refinancing, portfolio analysis and investor distribution economics into a transparent, editable Excel workbook.
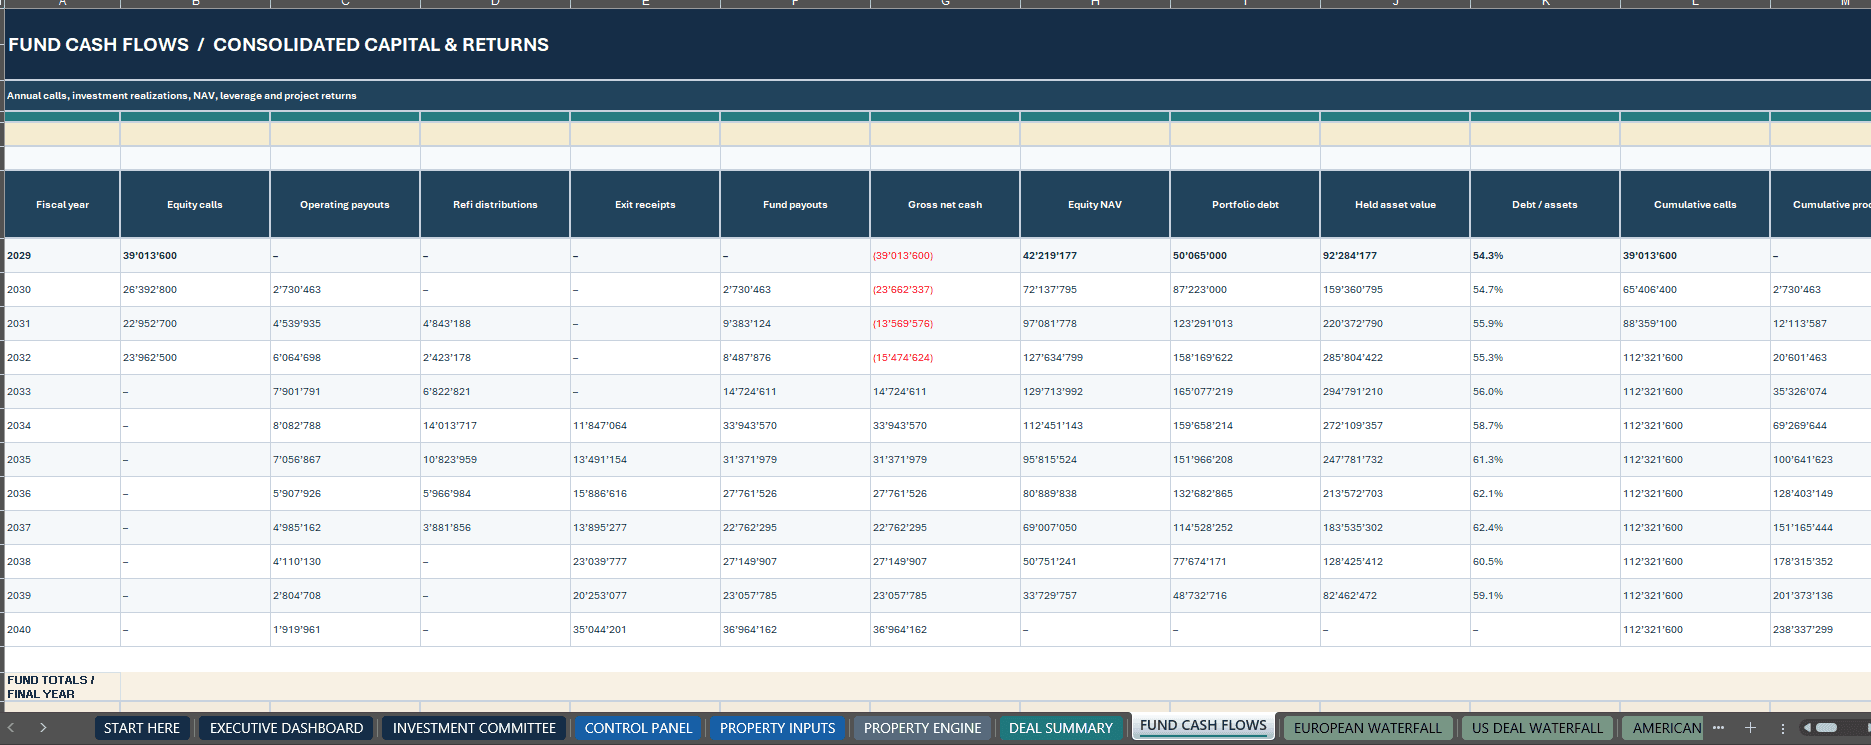
Built around a 12-year annual forecast, the model connects 15 individual investments, European whole-fund and American deal-by-deal waterfall calculations, LP commitments, GP carry and final clawback reconciliation.
It also provides a dedicated Investment Committee view, GP carry escrow and optional fee-drag analysis.
Designed for real estate private equity fund sponsors, investment professionals, asset managers, consultants and advanced finance students who want to understand how property-level investments translate into fund-level investor outcomes.
The package includes 21 connected Excel worksheets, eight native dashboard charts, 41 financial controls and a comprehensive 34-page PDF user guide.
🏢 1. PROPERTY UNDERWRITING & 12-YEAR PORTFOLIO FORECAST
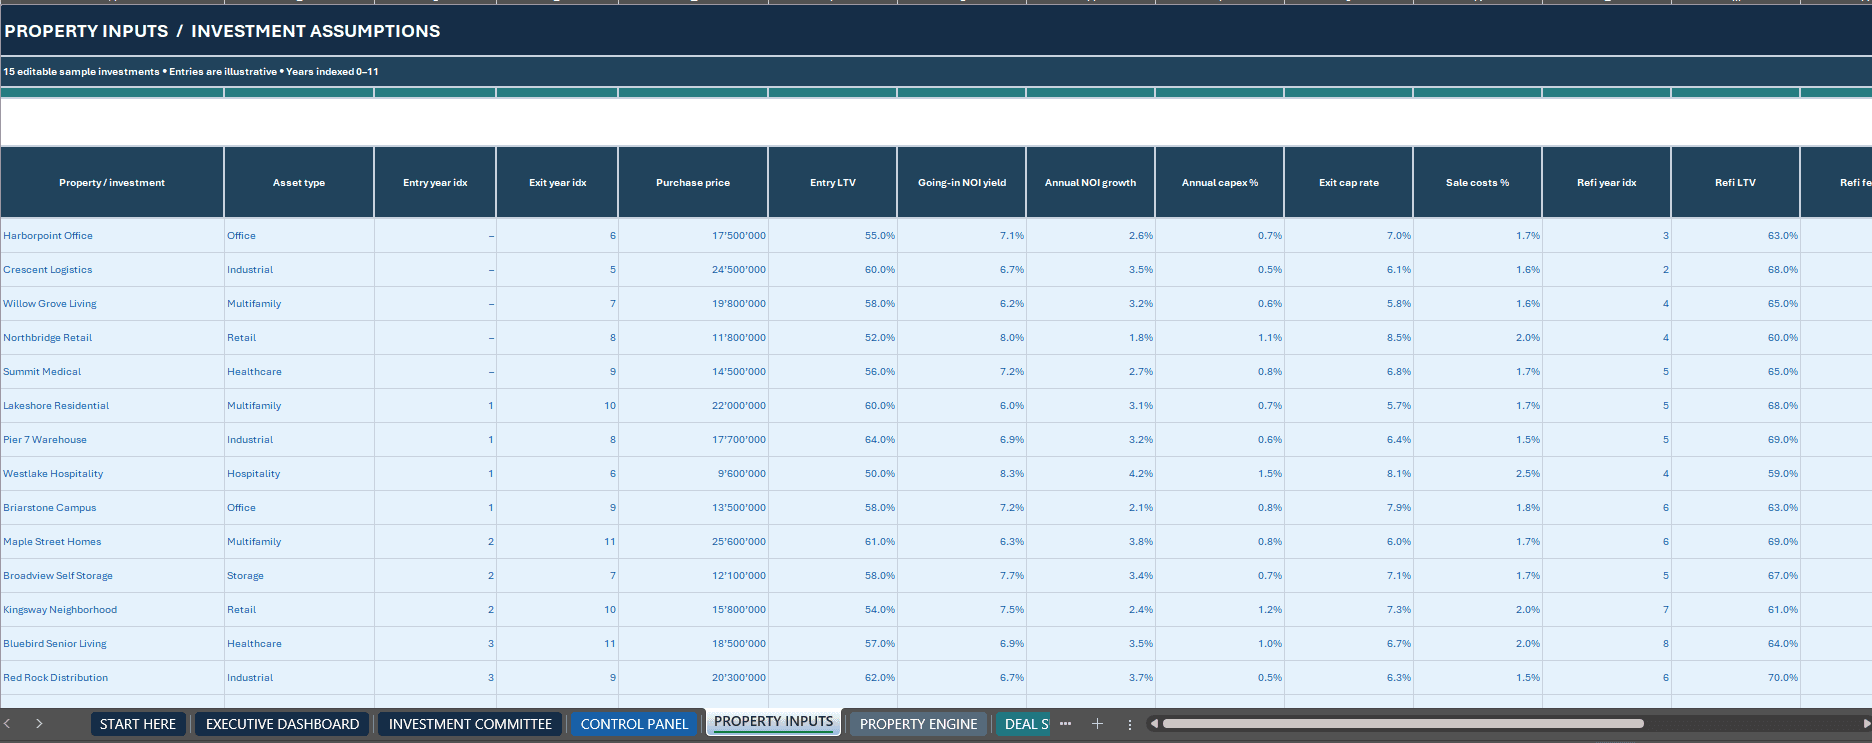
Evaluate 15 individual real estate investments across 12 annual forecast periods, using fictional sample assets that can be replaced with your own assumptions.
Editable Property Investment Drivers:
- Acquisition Prices and Transaction Costs
- Investment Entry and Exit Timing
- Initial Debt and Acquisition Leverage
- Going-In Net Operating Income (NOI) Yields
- Annual NOI Growth
- Reserve Capital Expenditure
- Debt Interest Assumptions
- Refinancing Timing, LTV and Fees
- Exit Capitalization Rates
- Property Selling Costs
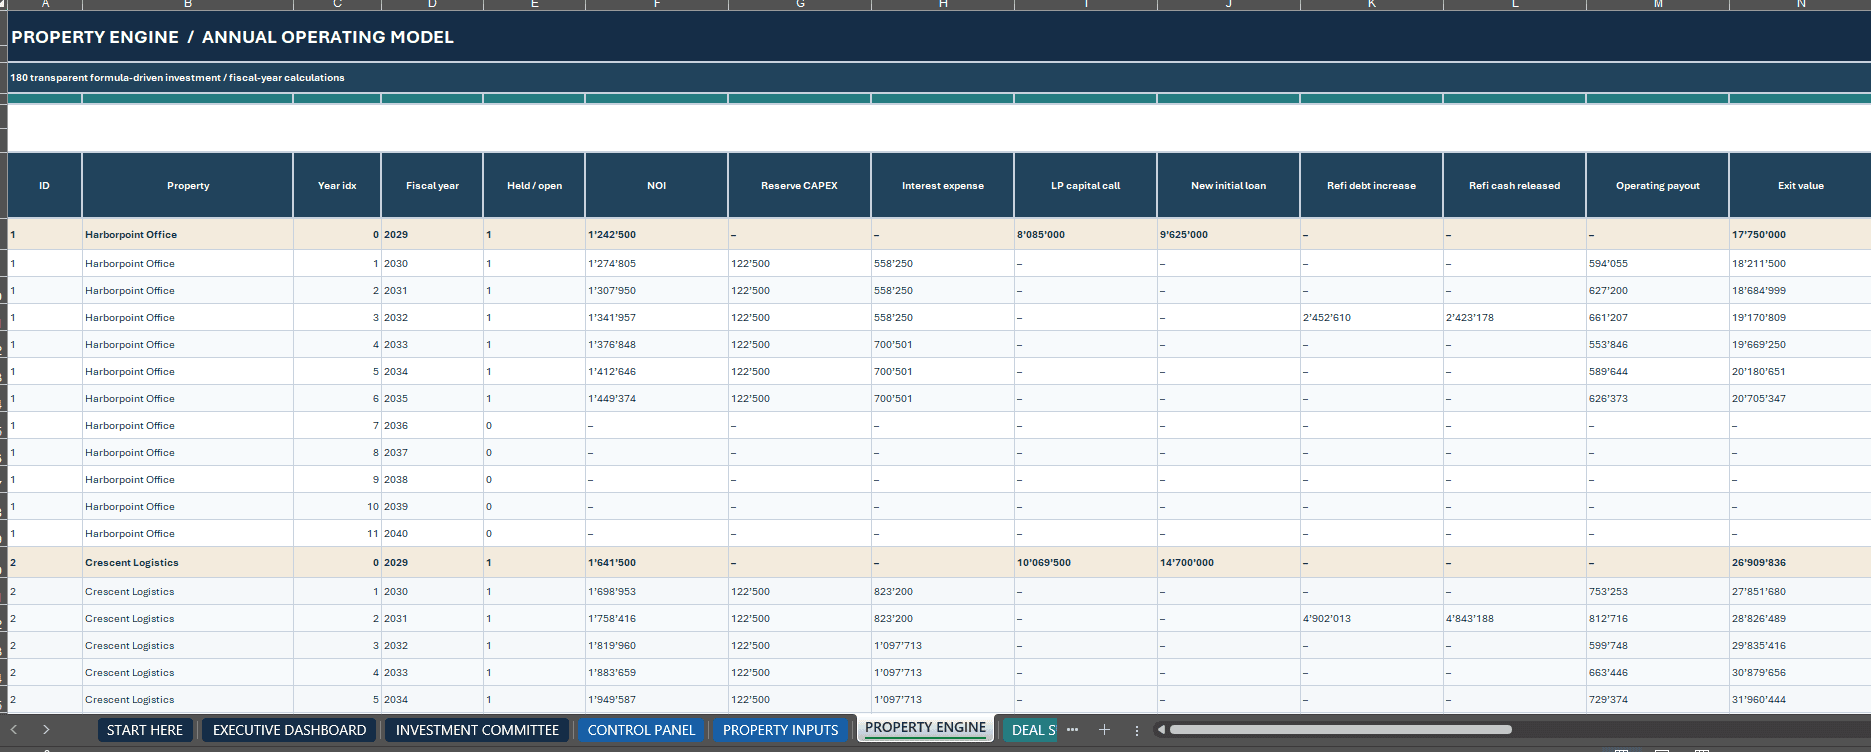
The integrated PROPERTY ENGINE converts investment assumptions into annual operating distributions, refinancing proceeds, sale proceeds, remaining property NAV and investment cash flows.
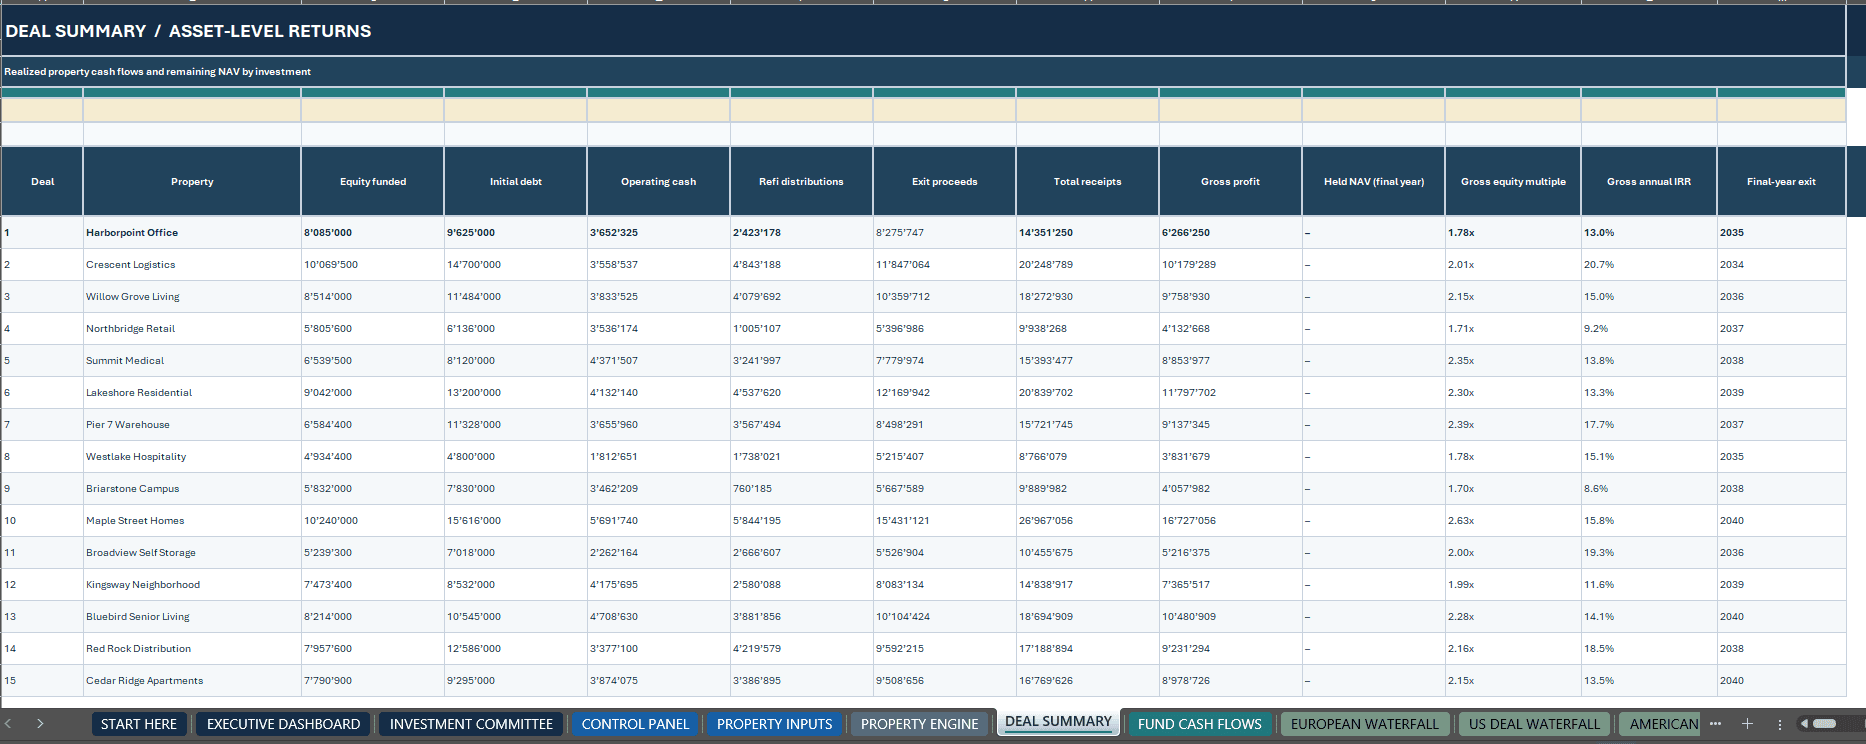
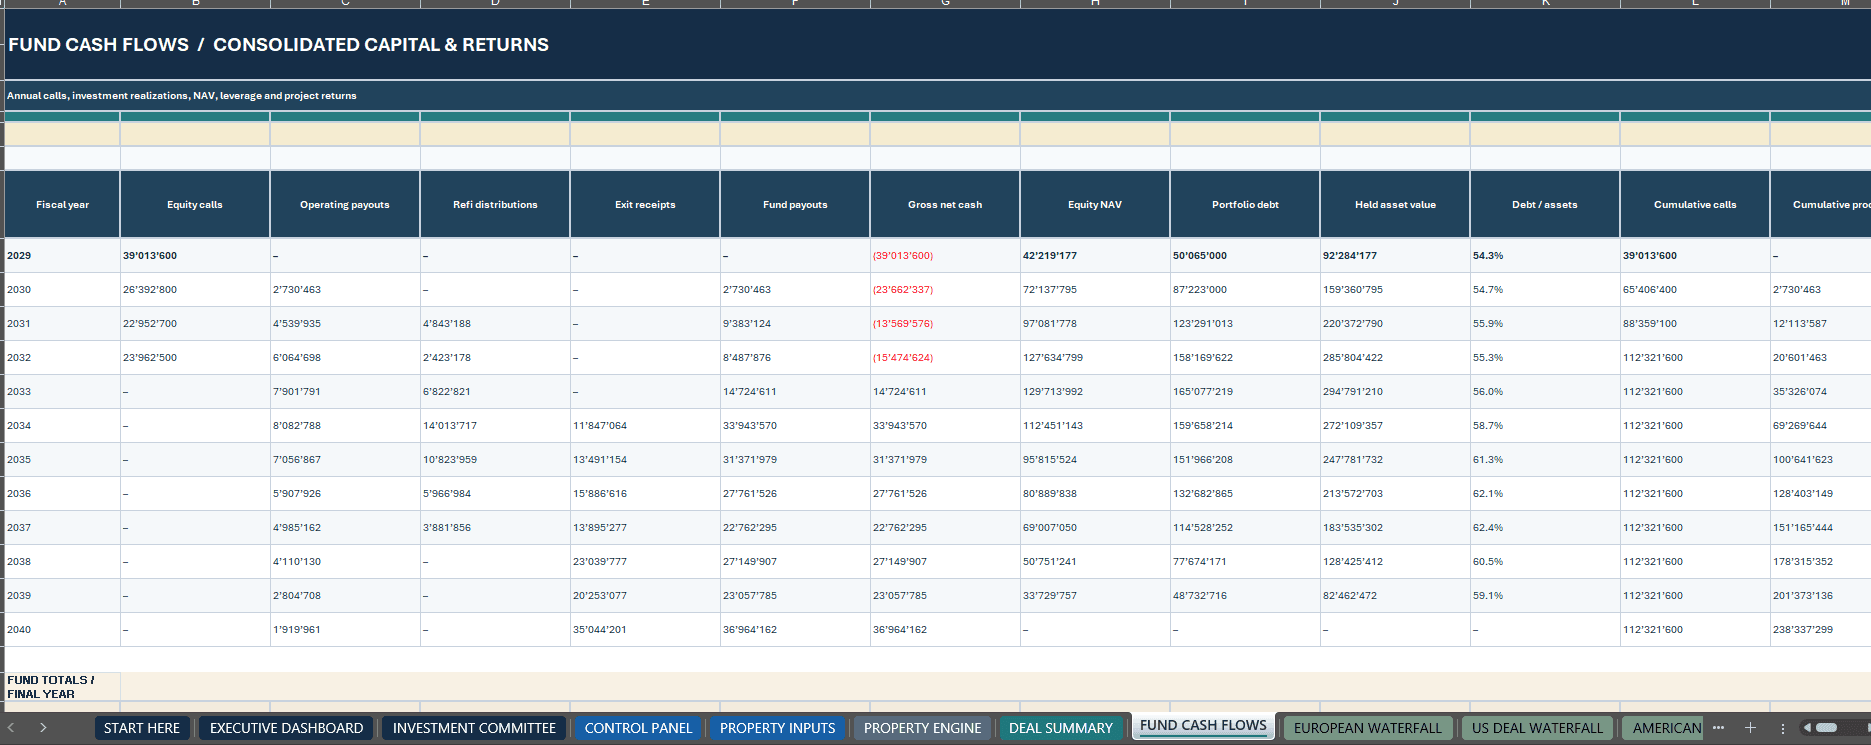
Dedicated DEAL SUMMARY and FUND CASH FLOWS worksheets connect property-level calculations to consolidated portfolio results.
The supplied model supports 15 investments within its prepared calculation framework. Adding further investments requires structural changes to the workbook.
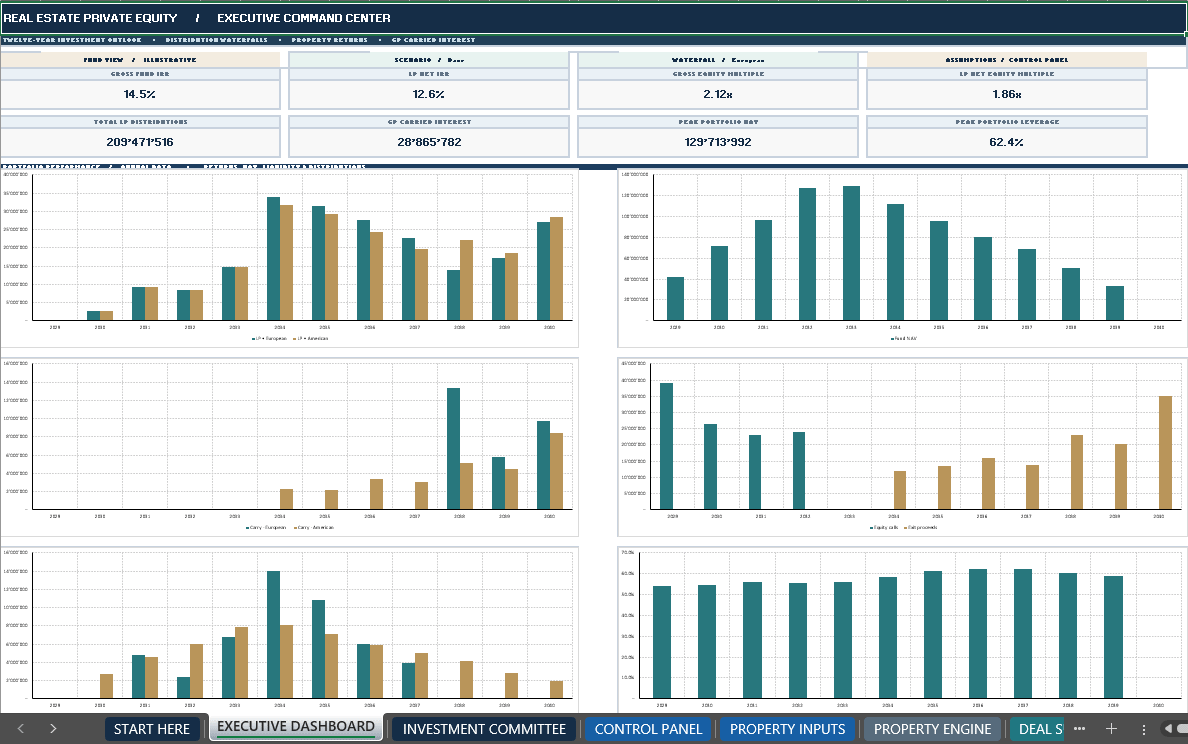
📊 2. EXECUTIVE DASHBOARD & INVESTMENT COMMITTEE
The premium Executive Dashboard presents consolidated portfolio performance and investor economics through a professional financial reporting interface.
Key Performance Indicators Include:
- Gross Fund Internal Rate of Return (IRR)
- LP Net Internal Rate of Return
- Gross Equity Multiple
- LP Net Equity Multiple
- Total LP Distributions
- GP Carried Interest
- Portfolio Net Asset Value
- Portfolio Leverage
Eight native, data-linked Excel charts visualize annual distributions, fund NAV, investment cash flows, LP/GP returns and carried-interest timing.
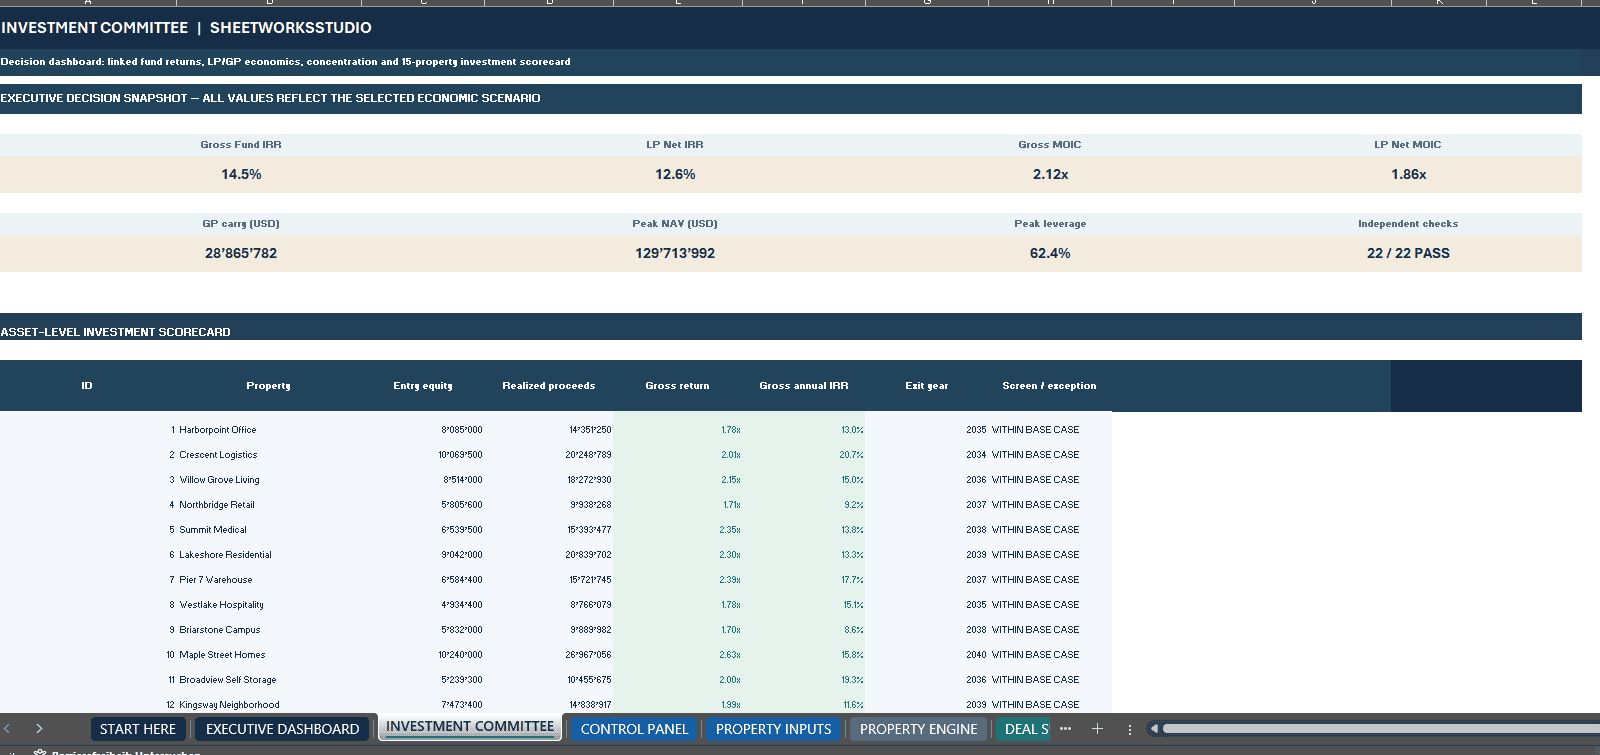
A separate INVESTMENT COMMITTEE worksheet provides asset-level performance comparisons, portfolio concentration indicators, gross investment return analysis and selected underwriting warnings.
This integrated reporting structure supports transparent investment review and financial decision-making.
⚖️ 3. EUROPEAN & AMERICAN DISTRIBUTION WATERFALLS
Analyze how the same underlying real estate investment cash flows can produce different distribution timing and carried-interest outcomes.
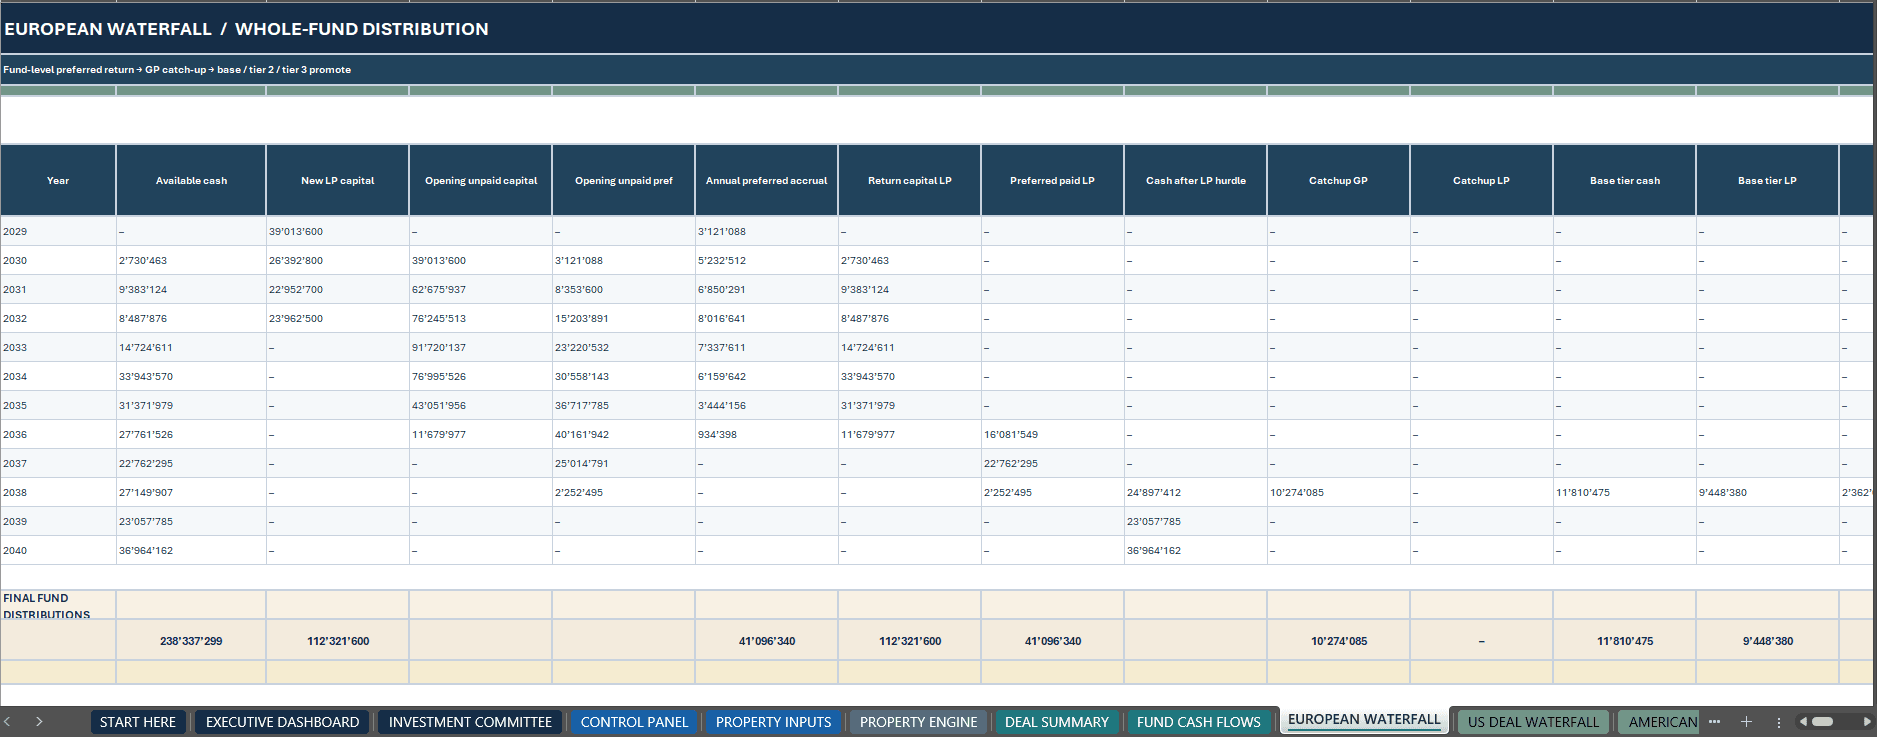
EUROPEAN WATERFALL – WHOLE-FUND DISTRIBUTION
The European methodology pools portfolio proceeds at fund level before distributing cash through the modeled LP capital recovery, preferred-return, GP catch-up and promote structure.
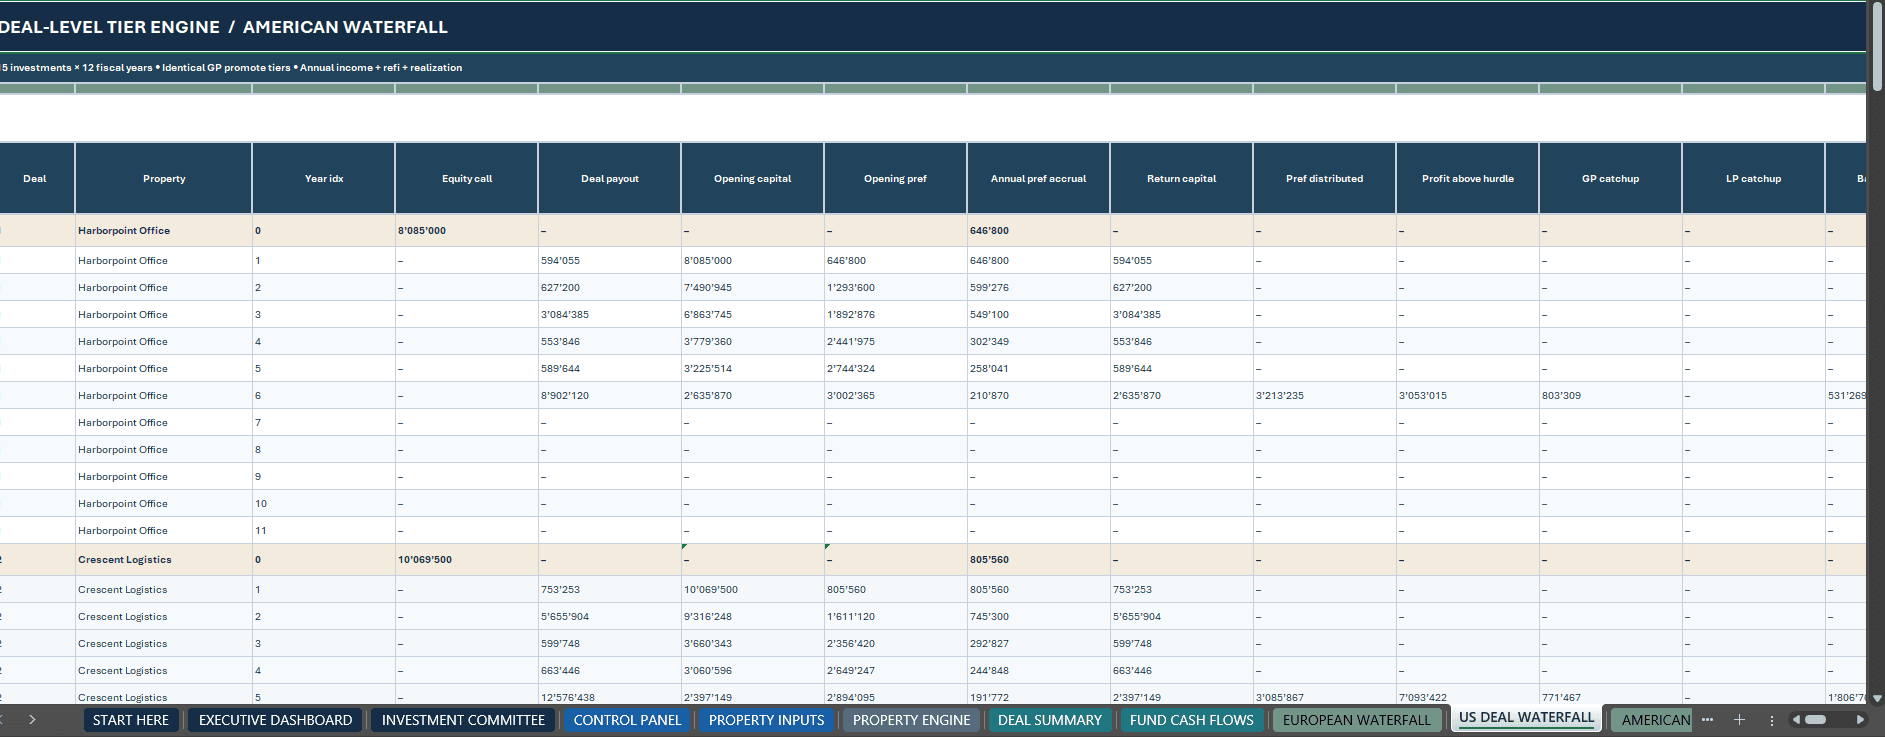
AMERICAN WATERFALL – DEAL-BY-DEAL DISTRIBUTION
The American methodology calculates carried interest at the investment level, allowing GP carry to arise from qualifying individual investment proceeds.
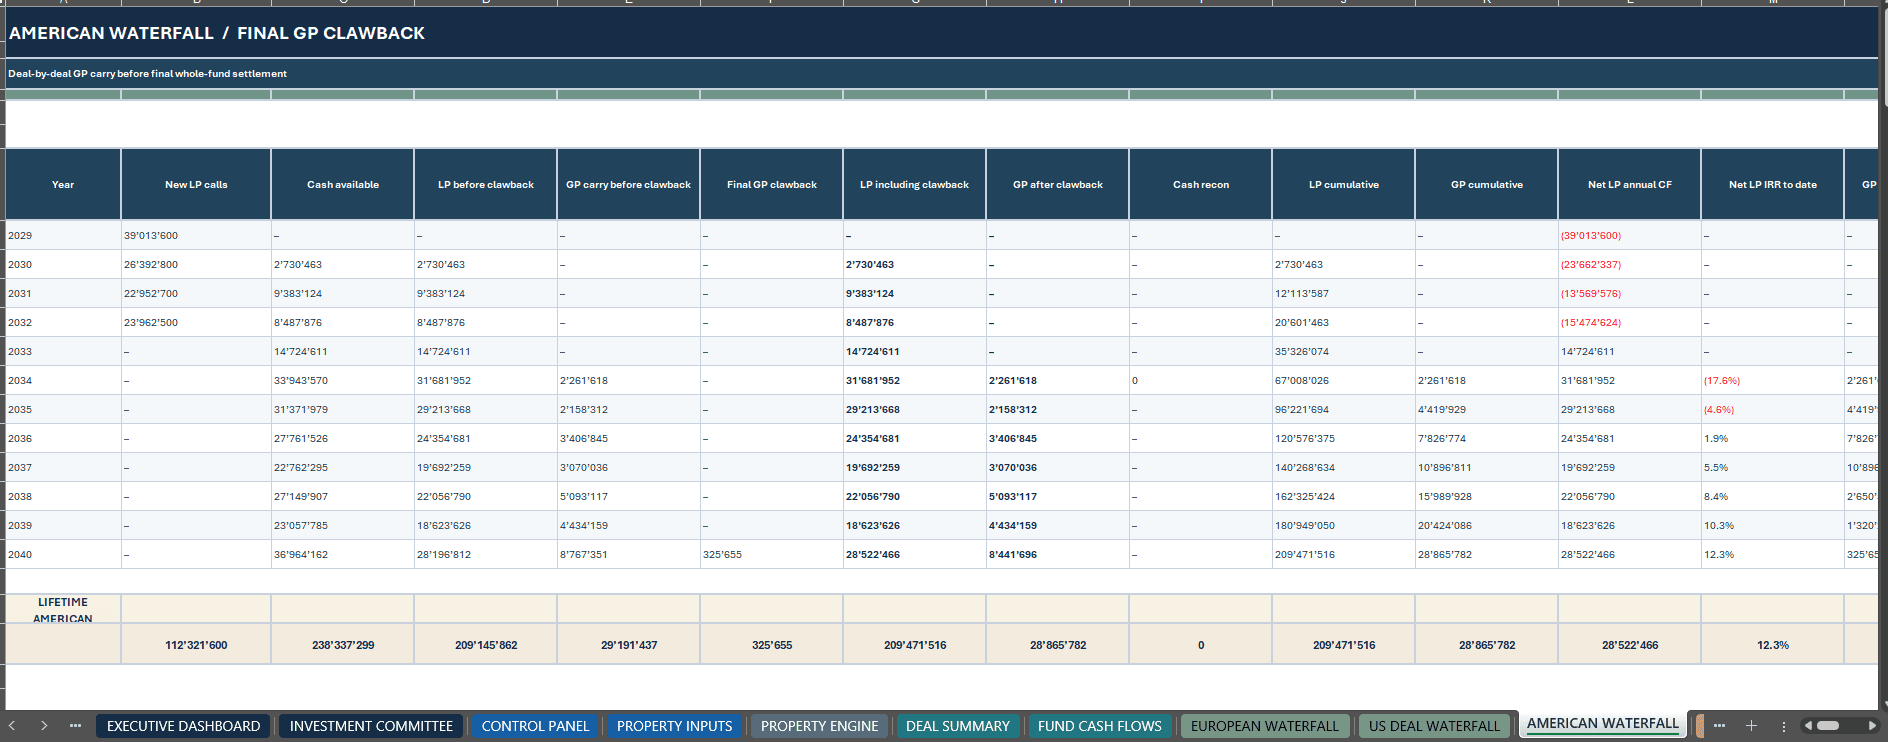
A final fund-level clawback reconciles modeled American carry against the European whole-fund entitlement.
Configurable Distribution Features Include:
- LP Capital Recovery
- Annual LP Preferred Return
- GP Catch-Up Participation
- GP Catch-Up Target Share
- Base GP Carried-Interest Rate
- Tier 2 GP Promote
- Tier 3 GP Promote
- Cumulative LP Distribution Multiple Thresholds
- LP/GP Distribution Allocation
- Final American GP Clawback
- Annual Cash Conservation Checks
The preferred return follows the model’s documented simple, noncompounding accrual methodology on unpaid contributed LP capital.
Important: Promote tiers are determined by cumulative LP distribution-to-contribution multiples, not by IRR hurdles. IRR is reported separately as an investment performance indicator.
👥 4. LP ALLOCATION, INVESTOR STATEMENTS & RETURNS
Evaluate investor economics using 15 illustrative Limited Partner allocations with individually editable capital commitments.
The LP ALLOCATION worksheet calculates proportional ownership, capital contributions, cash distributions and investment performance.
Included LP Reporting Features:
- Individual LP Commitments
- Proportional Ownership Percentages
- Fund Capital Call Allocations
- LP Cash Distribution Allocations
- Annual Investor Cash Flows
- LP-Level Internal Rate of Return
- LP Equity Multiples
- Investor-Attributed Portfolio NAV
- Carried-Interest Attribution
The LP STATEMENT worksheet allows users to select an individual LP and review that investor’s modeled capital calls, annual distributions and investment performance.
This helps users explore the relationship between portfolio cash flows, fund-level allocation assumptions and individual investor outcomes.
💼 5. GP CARRY ESCROW & FEE-DRAG ANALYSIS
Extend the investment analysis with two additional investor-economics modules.
GP CARRY ESCROW
The optional escrow module models:
- Annual GP Carry
- Editable Escrow Retention Percentages
- Carry Holdbacks
- Accumulated Escrow Reserves
- Final Escrow Releases
- Clawback Funding
- Final GP Carry Reconciliation
The escrow structure demonstrates how retaining a portion of carried interest can affect the timing of GP cash receipts and clawback settlement.
FEE DRAG BRIDGE
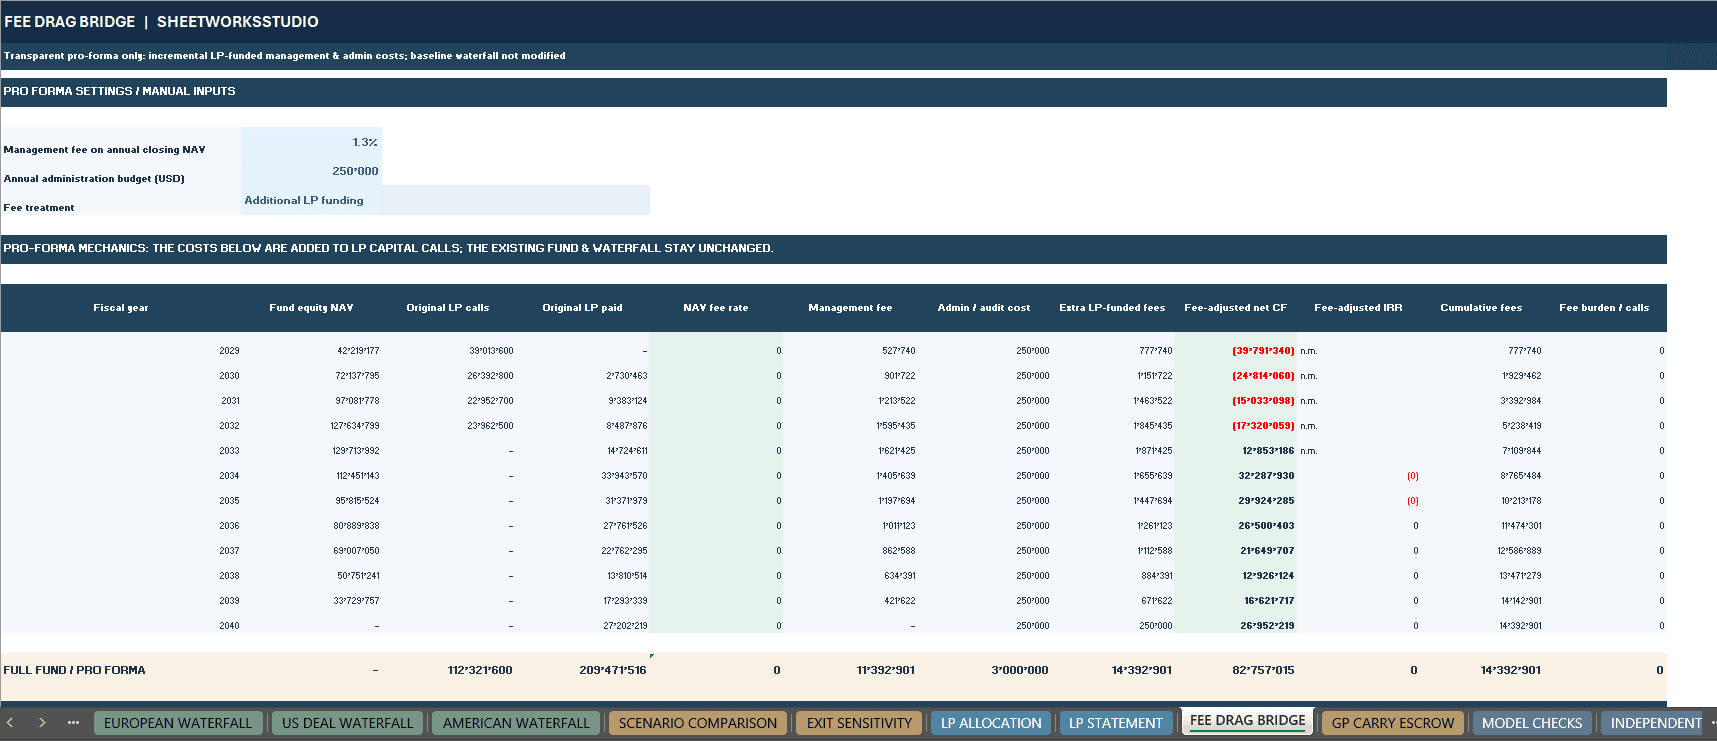
The separate Fee Drag Bridge evaluates additional investor-funded expenses through:
- Management Fee Assumptions
- Annual Administration Costs
- Additional LP Capital Funding
- Fee-Adjusted Investor Cash Flows
- Pro-Forma LP IRR
- Return Drag Analysis
Important: The fee bridge is a standalone pro-forma sensitivity. It does not recalculate the core waterfall with the additional fees incorporated into its contractual distribution structure.
The escrow simulation models cash retention and settlement, not a change in legally earned carried interest.
🔄 6. BASE, UPSIDE & DOWNSIDE SCENARIO ANALYSIS
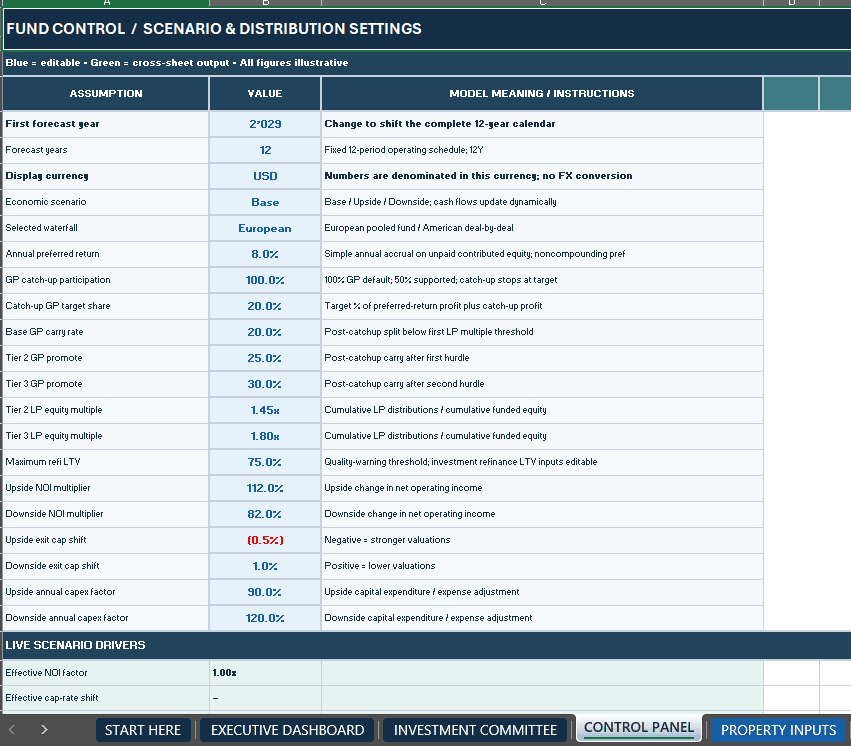
Evaluate portfolio outcomes under three selectable economic scenarios:
- Base
- Upside
- Downside
Scenario Drivers Include:
- Net Operating Income Adjustments
- Exit Capitalization Rate Shifts
- Annual Reserve Capital Expenditure Adjustments
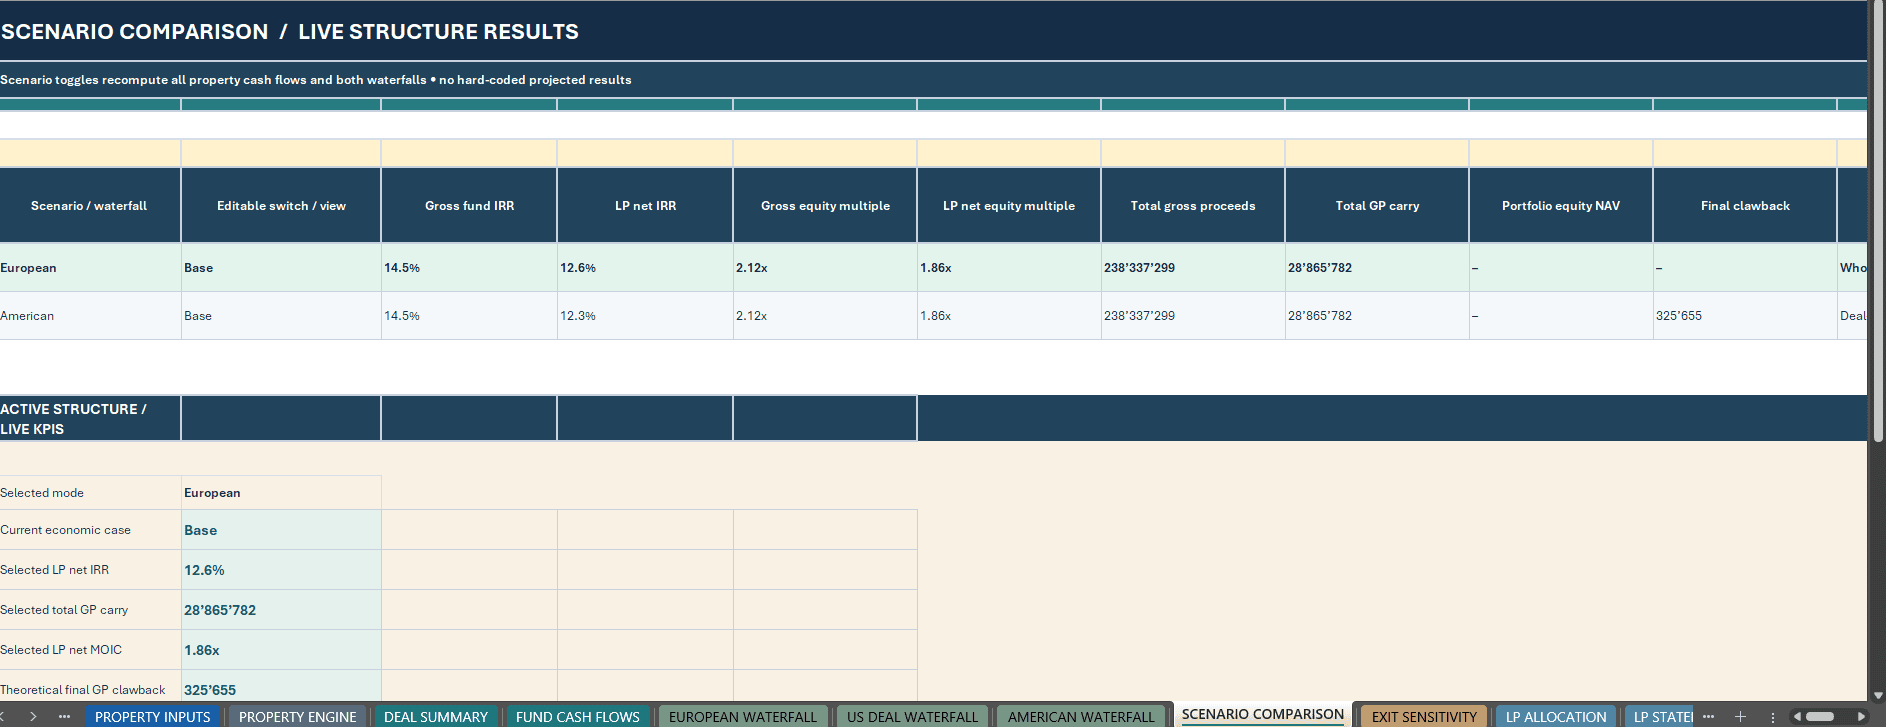
Scenario selections flow into the underlying property calculations, fund cash flows and connected distribution waterfall schedules.
The SCENARIO COMPARISON worksheet provides linked European and American results using the selected economic assumptions.
7 × 7 EXIT VALUATION SENSITIVITY
The workbook also includes a formula-driven exit sensitivity matrix evaluating 49 combinations of NOI changes and exit capitalization rate movements.
This analysis estimates changes in gross investment multiples through adjusted exit proceeds.
The sensitivity grid does not independently recalculate all preferred-return, carry, financing and tax effects. Use the linked scenario and waterfall calculations for broader investor-return analysis.
✅ 7. MODEL VALIDATION & FINANCIAL CONTROLS
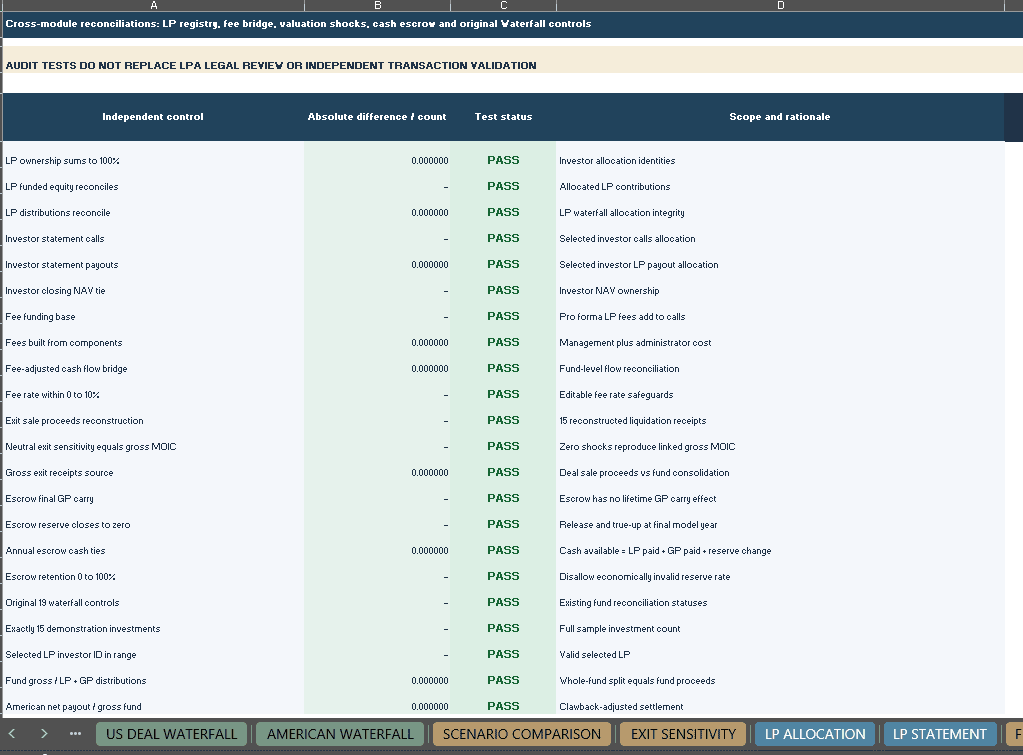
The workbook contains 41 financial integrity controls across two dedicated worksheets.
MODEL CHECKS – 19 CONTROLS
The core checks review:
- European Distribution Reconciliation
- American Waterfall Allocation
- GP Clawback Conservation
- Property Operating Cash Flows
- Fund Capital Contributions
- Fund Distribution Reconciliation
- LP Capital and Preferred Return Continuity
- GP Carry Entitlement
- Investment Entry and Exit Timing
- Refinancing Conditions
- Scenario Validity
INDEPENDENT AUDIT – 22 ADDITIONAL CONTROLS
The additional checks cover:
- LP Ownership Reconciliation
- Investor Capital Contributions
- Investor Distribution Allocations
- Individual LP Statement Consistency
- Fee-Drag Calculations
- Exit Sensitivity Reconciliation
- GP Escrow Balances
- Clawback Settlement
- Distribution Conservation
- Selected Fund and Investor Reporting Controls
The operating cash-flow reconciliation has been strengthened to detect offsetting positive and negative deviations across the property-year calculation engine.
A PASS status confirms the relevant numerical control relationships. Financial warnings, financing risks and contractual limitations must still be evaluated separately.
📦 8. WHAT’S INCLUDED
FILE 1 — REAL ESTATE PRIVATE EQUITY WATERFALL MODEL (.XLSX)
One fully editable Excel workbook containing:
- 21 Connected Worksheets
- 12 Annual Forecast Periods
- 15 Illustrative Real Estate Investments
- 15 Illustrative LP Commitments
- European Whole-Fund Waterfall
- American Deal-by-Deal Waterfall
- LP Preferred Return Calculations
- GP Catch-Up and Three Promote Tiers
- GP Carried Interest and Final Clawback
- Eight Native Excel Charts
- Executive Dashboard
- Investment Committee Reporting
- Property and Fund Cash Flow Calculations
- Individual LP Statements
- GP Carry Escrow Analysis
- Fee Drag Bridge
- Base, Upside and Downside Scenarios
- 7 × 7 Exit Sensitivity Analysis
- 41 Financial Model Checks
FILE 2 — COMPLETE HOW-TO-USE GUIDE (.PDF)
A professionally designed 34-page English user manual covering:
- Initial Model Setup
- Worksheet Navigation
- Property Underwriting Inputs
- Annual Portfolio Cash Flows
- European Distribution Methodology
- American Distribution Methodology
- Preferred Returns and GP Catch-Up
- Carried-Interest Promote Tiers
- GP Clawback Mechanics
- LP Commitments and Investor Statements
- GP Carry Escrow
- Management Fee Drag
- Exit Sensitivity Analysis
- Scenario Testing
- Financial Controls
- Practical Examples
- Troubleshooting
- Financial Modeling Terminology
- Important Conventions and Limitations
Both purchased files are supplied together in one downloadable ZIP package.
The complete 34-page PDF guide can also be obtained separately as a complimentary reference resource. The free guide does not include the paid Excel financial model.
9. WHO IS THIS MODEL FOR?
Designed for:
- Real Estate Private Equity Fund Sponsors
- General Partners and Limited Partners
- Real Estate Acquisition Analysts
- Asset and Portfolio Managers
- Investment Committees
- Fund Investment Analysts
- Real Estate Financial Consultants
- Investment and Finance Professionals
- Advanced Real Estate Finance Students
The model provides a structured framework for evaluating property investments, analyzing fund cash flows and comparing alternative distribution methodologies.
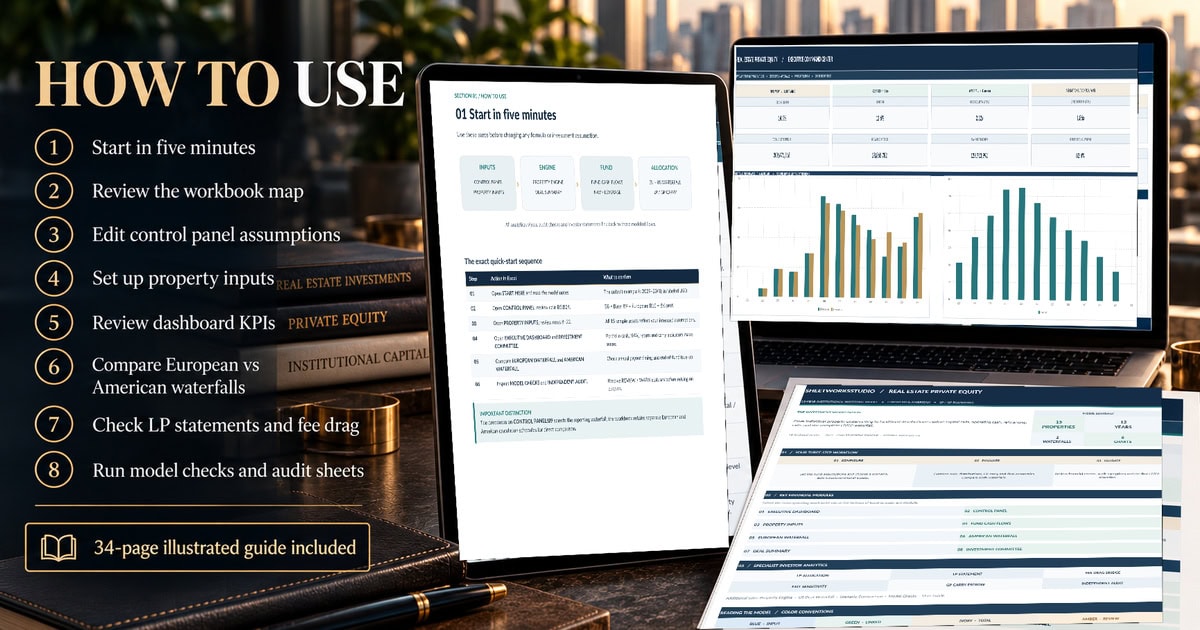
🧭 10. HOW TO USE
STEP 1 — REVIEW THE WORKBOOK
Save a working copy and review START HERE and the accompanying PDF manual.
STEP 2 — CONFIGURE THE FUND
Set the forecast start year, scenario, preferred return, GP catch-up, promote tiers and waterfall structure in CONTROL PANEL.
STEP 3 — CUSTOMIZE PROPERTY ASSUMPTIONS
Replace the fictional investments in PROPERTY INPUTS with project-specific acquisition, NOI, financing, refinancing and exit assumptions.
STEP 4 — REVIEW INVESTMENT PERFORMANCE
Analyze DEAL SUMMARY, FUND CASH FLOWS, the Executive Dashboard and Investment Committee reporting.
STEP 5 — EVALUATE INVESTOR DISTRIBUTIONS
Compare European and American waterfall outcomes, LP allocations, individual investor statements and GP carried interest.
STEP 6 — TEST ASSUMPTIONS & VALIDATE RESULTS
Review scenario comparisons, exit sensitivities, fee drag, carry escrow and both financial control worksheets.
Investigate warnings and verify contractual distribution assumptions against the applicable fund partnership agreement.
11. TECHNICAL SPECIFICATIONS
- Product: Real Estate Private Equity Waterfall Financial Model
- Forecast Horizon: 12 Years
- Illustrative Period: 2029–2040
- Worksheets: 21
- Investments: 15 Prepared Examples
- LP Allocations: 15 Illustrative Investors
- Waterfall Methods: European and American
- Native Dashboard Charts: 8
- Financial Controls: 41
- Scenarios: Base, Upside, Downside
- Exit Sensitivity: 7 × 7 Matrix
- Documentation: 34-Page English PDF Guide
- File Formats: XLSX + PDF
- Recommended Software: Microsoft Excel Desktop
- Macros / VBA: Not Required
- External Workbook Connections: None Required
- Delivery: Digital ZIP Download
Software Compatibility: Microsoft Excel Desktop is recommended. Google Sheets import and functional compatibility have not been independently verified. Equivalent formula calculations, charts, navigation, dropdowns and formatting are therefore not guaranteed.
The currency setting changes the reporting label only and does not perform automatic foreign-exchange conversion.
12. IMPORTANT MODEL LIMITATIONS & DISCLAIMER
The workbook contains fictional illustrative investments and financial results intended for financial modeling, educational and scenario-analysis purposes.
The model uses annual-period cash flows and annual IRR calculations rather than transaction-date XIRR.
The current framework does not include GP co-investment capital accounts, bespoke multi-class LP arrangements, detailed debt amortization, full fund accounting, property or fund taxation, or automatic funding of property operating deficits through additional capital calls.
European and American waterfall calculations use simplified preferred-return, catch-up, promote and clawback conventions. These calculations may differ from actual fund distribution provisions.
A passing model integrity check does not guarantee investment profitability, acceptable leverage, compliance with contractual terms or financial suitability.
This is an independent, unofficial SheetworksStudio template. It is not an official product of any investment fund, lender or financial institution and does not constitute investment, financial, accounting, tax or legal advice.
Users should verify all assumptions, source records and partnership agreement terms before relying on results for professional investment decisions.
UNDERWRITE PROPERTIES. COMPARE WATERFALLS. REVIEW GP CARRY. UNDERSTAND LP RETURNS.
One Connected Excel Model for Real Estate Private Equity and Professional Investor Distribution Analysis.
SheetworksStudio | Professional Financial Modeling Templates
Similar ProductsOther customers were also interested in...



 eFinancialModels
Electric Vehicle (EV) Charging Station Financial M...
With this comprehensive 5- or 10-year monthly tool, investors can assess the viability of setting up... Read more

Financial Model for Mobile App | Mobile App Busine...
The Mobile App Financial Plan Template in Excel allows you to develop financial projections when lau... Read more

 HenrySheykin
Food Truck Financial Model Excel Template
The Food Truck Financial Model helps entrepreneurs, founders, business owners, consultants, and anal... Read more

Green Hydrogen Production from Wind Energy Financi...
The Green Hydrogen from Wind Financial Model aims to comprehensively forecast a horizon of 40 years ... Read more

Simple Mutual Non-Disclosure Agreement Template
Protect your business secrets with ease using our Simple Mutual Non-Disclosure Agreement Template. S... Read more

Solar Energy Financial Model
The Solar Energy Financial Model Spreadsheet Template in Excel assists you in preparing a sophistica... Read more

 Peter Graf
The Customer-Centric Financial Model for Restauran...
Starting a restaurant without a financial plan is like driving a car blindfolded. You wouldn´t do i... Read more
You must log in to submit a review.