
0 ITEMS

Private Equity Fund Financial Model Excel – 12-Year LP/GP Cash Flows, European & American Waterfalls
12-year private equity fund model with 48 quarterly periods, European and American LP/GP waterfalls, five investor classes, capital calls, NAV, carried interest, IRR, DPI, RVPI, TVPI and eight Excel dashboard charts. Includes a 14-page PDF guide.
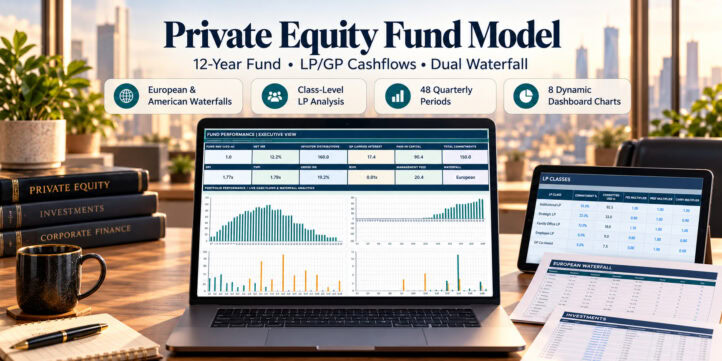

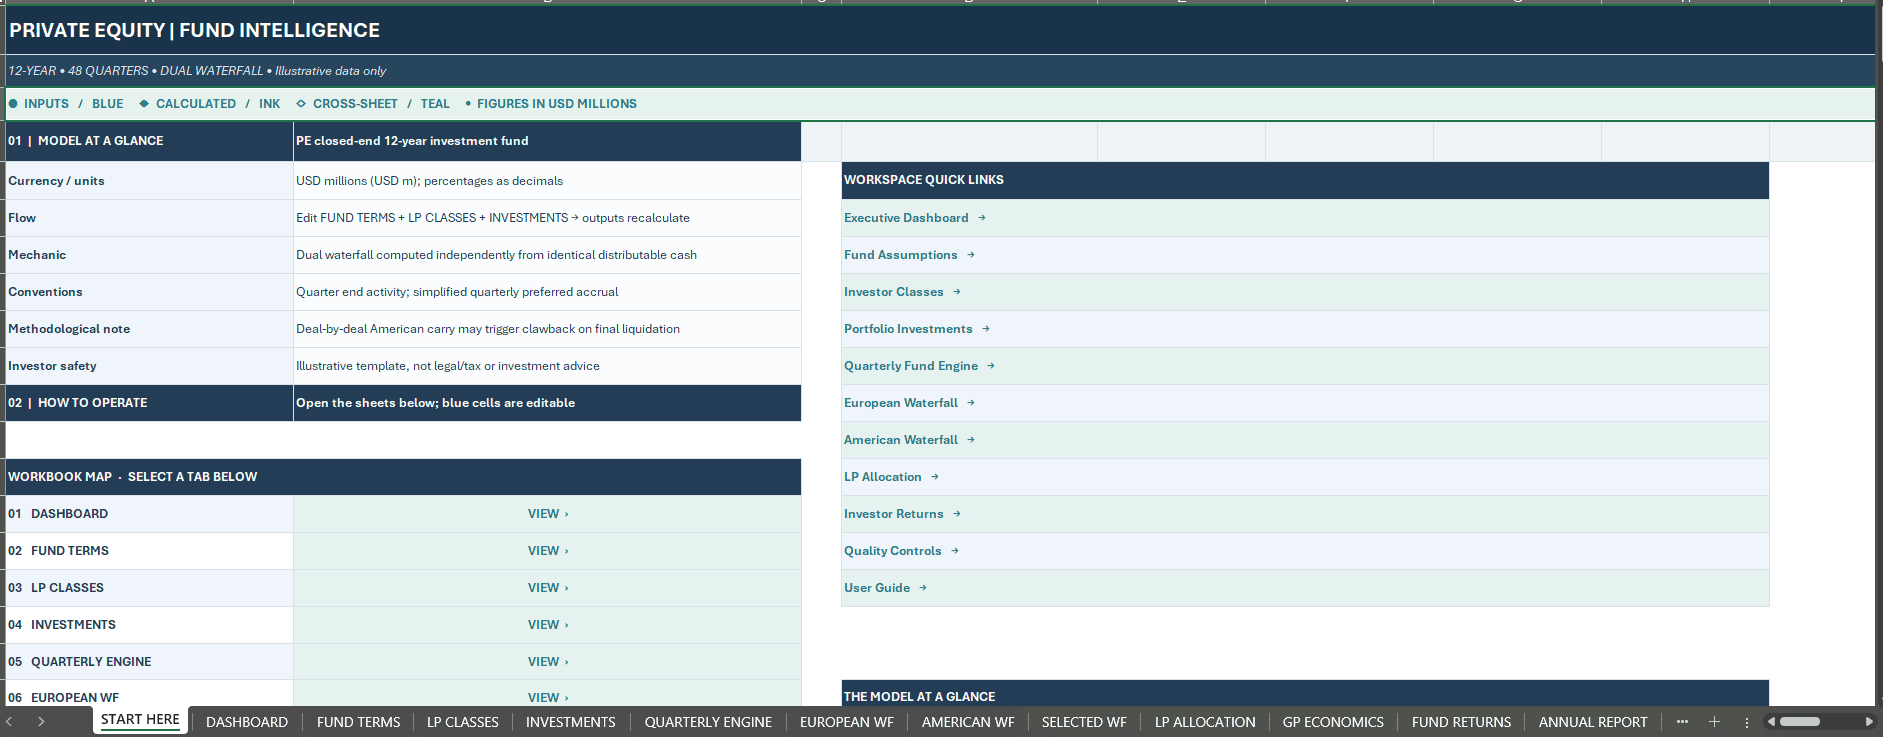
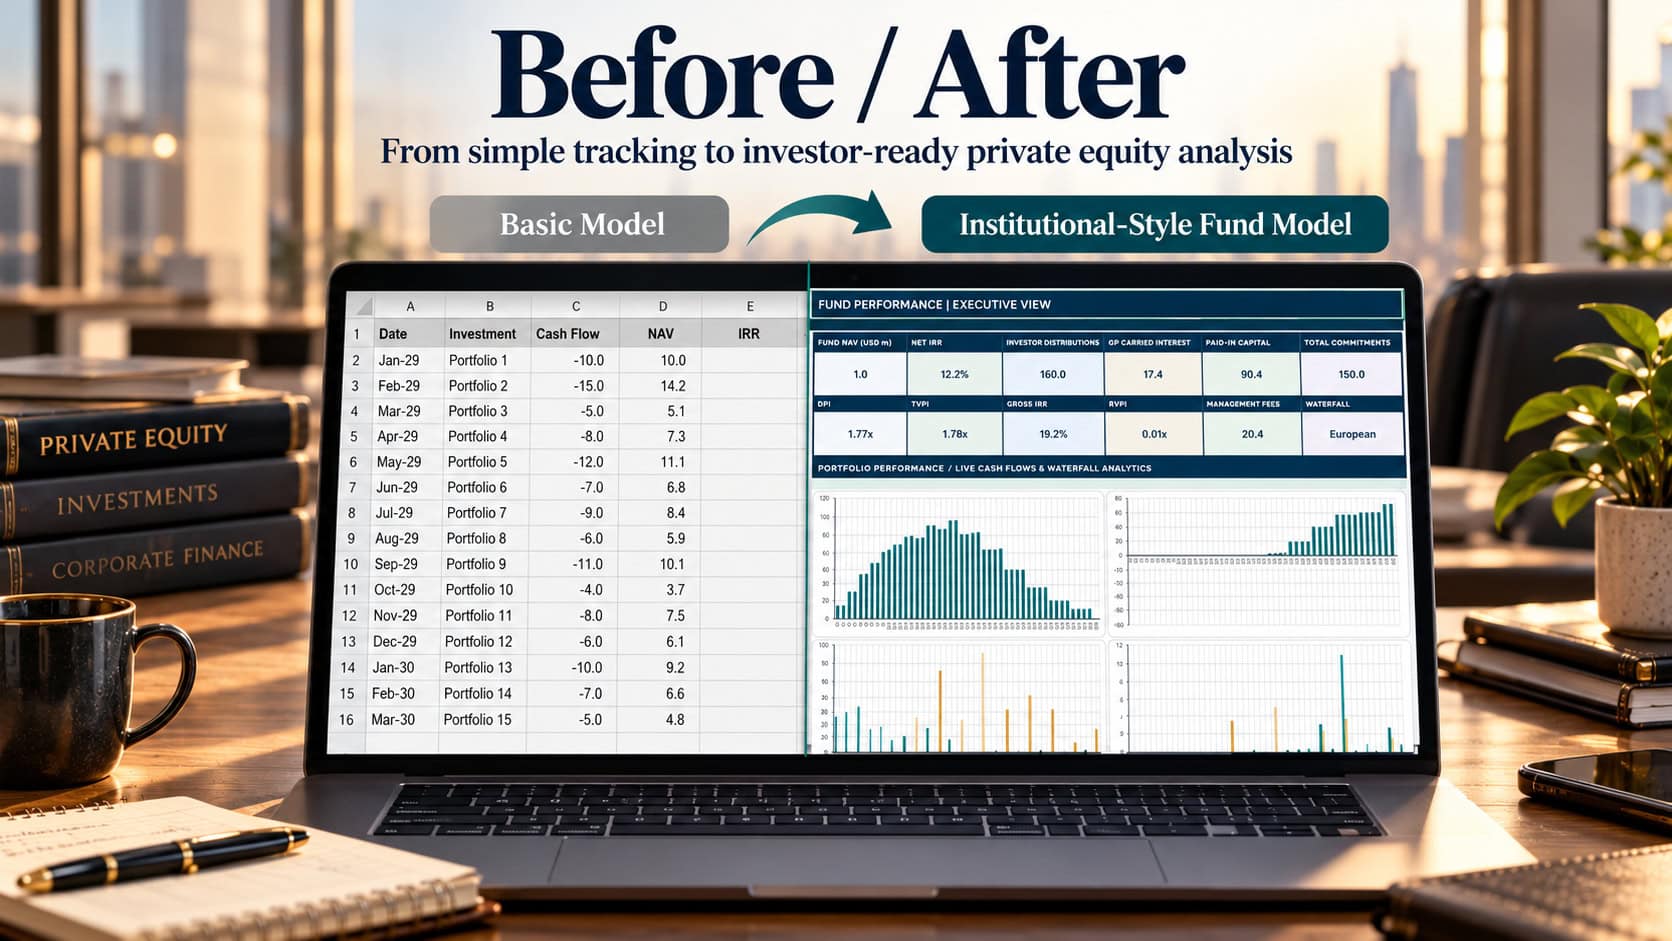

12-Year LP/GP Cash Flow Forecast | European & American Waterfalls | Investor-Class Economics
Analyze capital commitments, fund cash flows, distribution waterfalls and investor returns with a professional, fully editable Excel financial model.
The Private Equity Fund Financial Model by SheetworksStudio provides an integrated 12-year fund analysis framework combining portfolio investments, capital calls, management fees, Net Asset Value (NAV), distributions, carried interest and LP/GP investment returns.
Designed for private equity professionals, fund managers, institutional investors, consultants and financial analysts, this structured workbook supports investment planning, fund-structure comparisons, scenario analysis and financial performance reporting.
📊 EXECUTIVE DASHBOARD & FUND PERFORMANCE
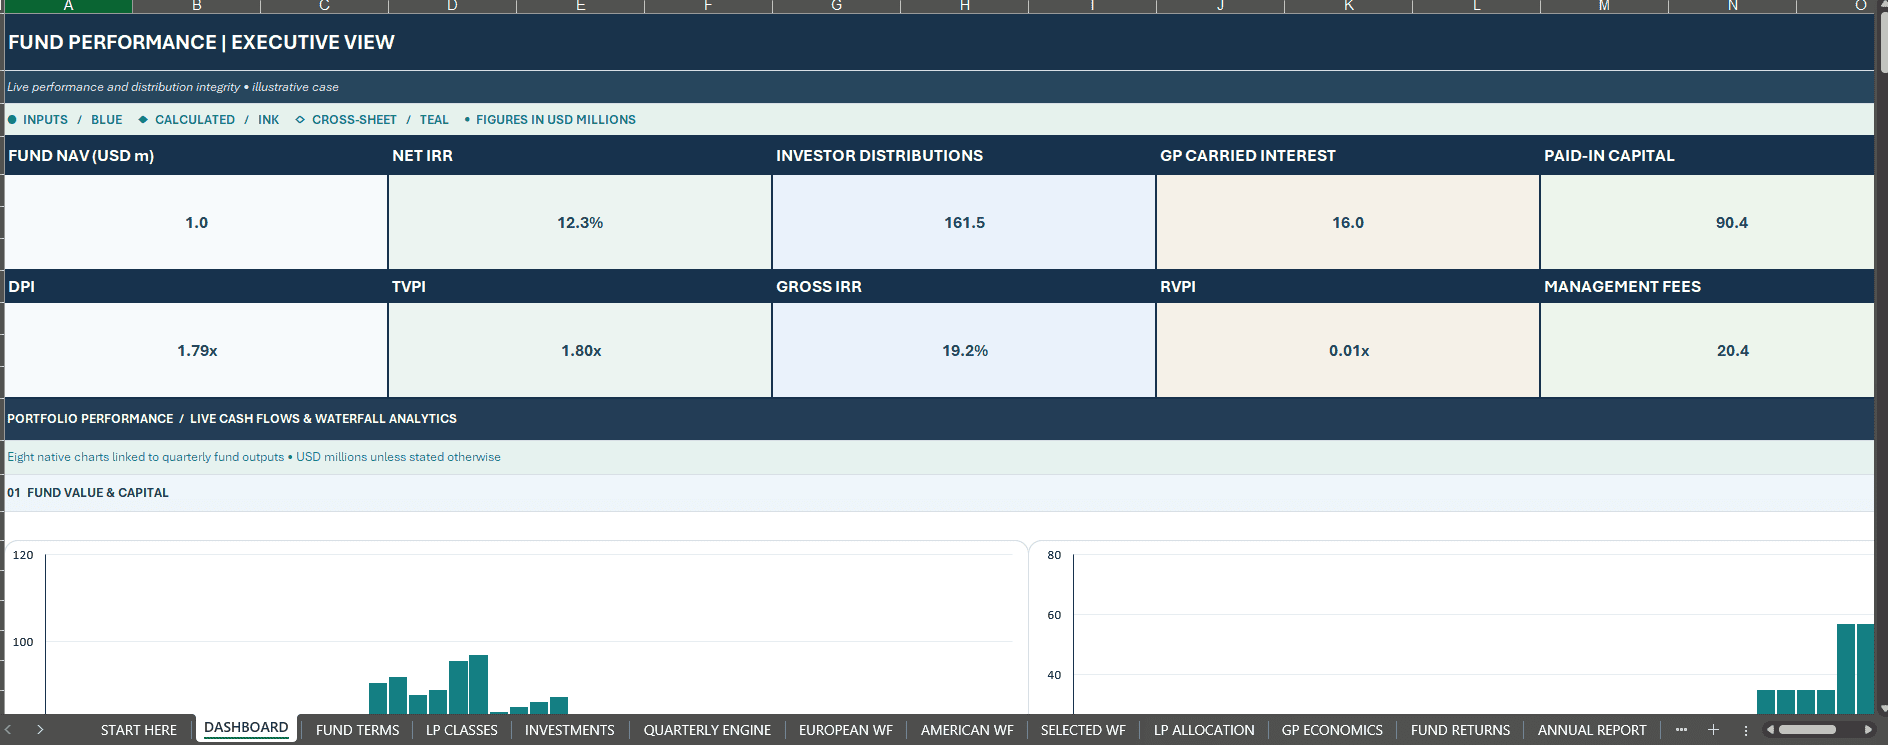
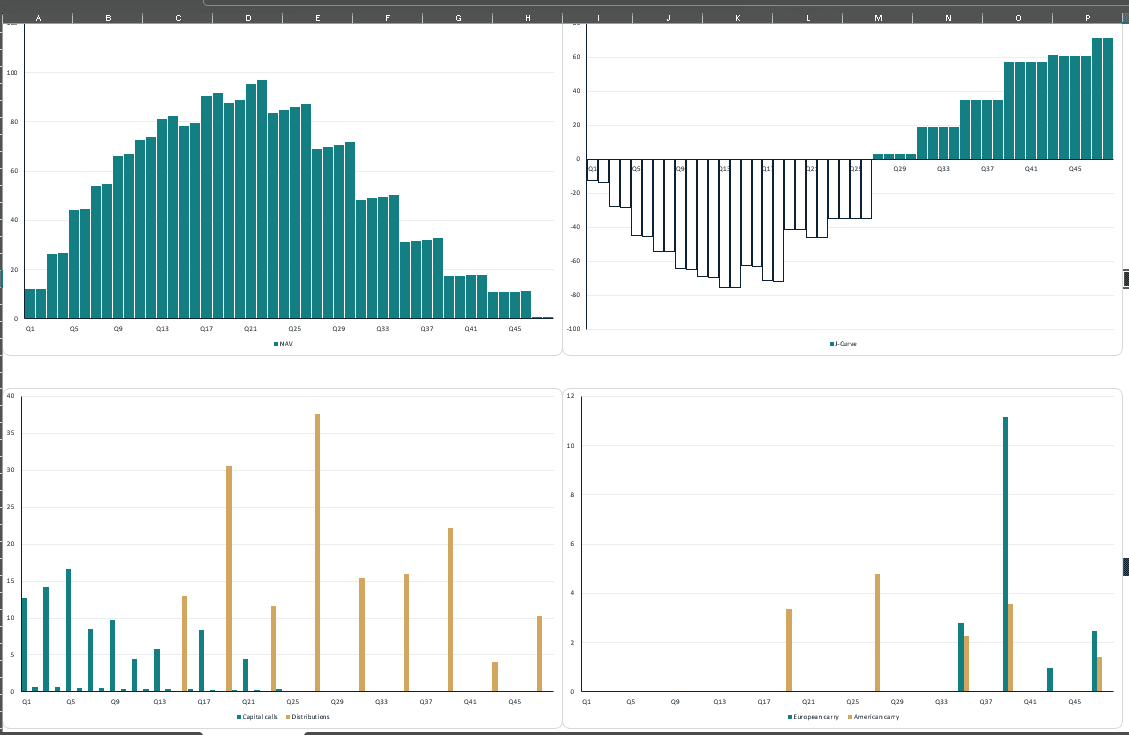
Review fund economics through a professional dashboard featuring 12 headline indicators and eight native, data-linked Excel charts.
Key indicators include:
- Gross and Net Internal Rate of Return (IRR)
- Distributions to Paid-In Capital (DPI)
- Residual Value to Paid-In Capital (RVPI)
- Total Value to Paid-In Capital (TVPI)
- Total Fund Commitments
- Paid-In Capital
- Fund Net Asset Value (NAV)
- Management Fees
- Investor Distributions
- GP Carried Interest
- Selected Waterfall Structure
Visual reporting provides insight into quarterly fund performance, capital deployment, distributions, NAV development and LP/GP economics.
The dashboard is connected to the financial calculations and responds to changes in the underlying assumptions.
12-YEAR QUARTERLY FUND CASH FLOW MODEL
Build a comprehensive private equity fund forecast across 48 quarterly periods.
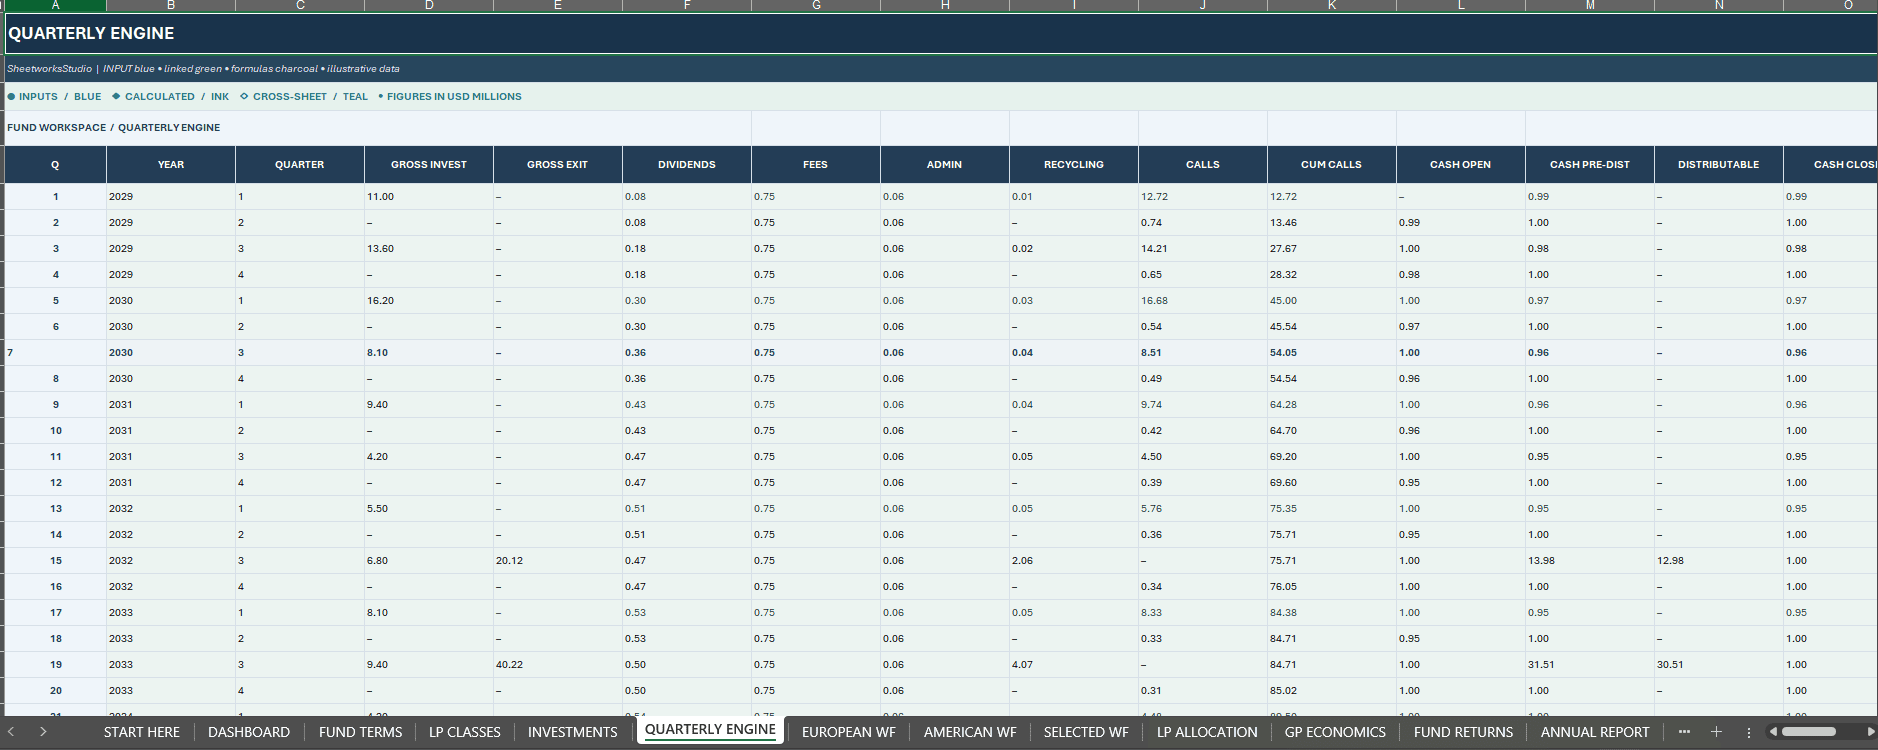
The integrated financial engine tracks:
- Fund commitments and capital contributions
- Quarterly capital calls
- Cumulative paid-in capital
- Portfolio investments
- Investment realizations and exit proceeds
- Dividend income
- Management fees and administration expenses
- Investment recycling assumptions
- Fund liquidity and cash reserves
- Available cash for distribution
- Fund NAV development
- Quarterly net cash flows
A configurable starting year allows the illustrative fund timeline to be adapted to the user’s planning requirements.
⚖️ EUROPEAN & AMERICAN DISTRIBUTION WATERFALLS
Compare two important approaches to private equity fund distributions.
European Waterfall – Whole-Fund Approach
The European structure models fund-level distribution priorities, including:
- Recovery of contributed capital
- Accrued preferred return
- Preferred return distributions
- GP catch-up participation
- Carried interest allocation
- LP/GP distribution splits
- Unreturned capital and unpaid preferred return
This provides an illustrative whole-fund approach to allocating proceeds between investors and the general partner.
American Waterfall – Deal-Oriented Approach
The American structure models an alternative distribution sequence associated with deal-level realizations.
It includes:
- Deal-related capital recovery assumptions
- Preferred return calculations
- GP catch-up
- Carried interest allocation
- LP/GP distributions
- Modeled end-of-fund clawback adjustments
The two waterfall structures can be calculated and compared using the same underlying fund assumptions.
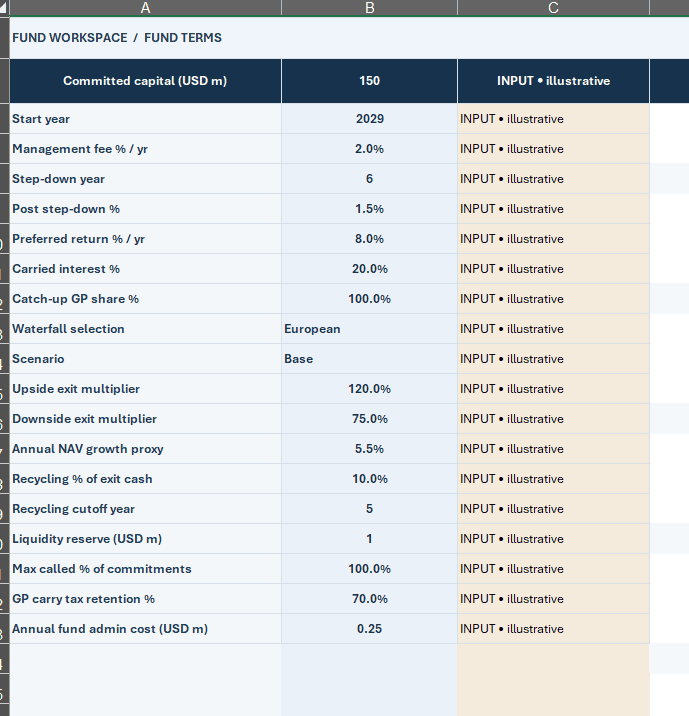
Users can select the preferred structure through the FUND TERMS worksheet.
Important: Both waterfall methodologies use simplified financial conventions. They do not replace the contractual distribution provisions of a specific Limited Partnership Agreement (LPA).
👥 FIVE INVESTOR CLASSES & LP ECONOMICS
Analyze separate investor-class economics rather than relying exclusively on fund-level proportional distributions.
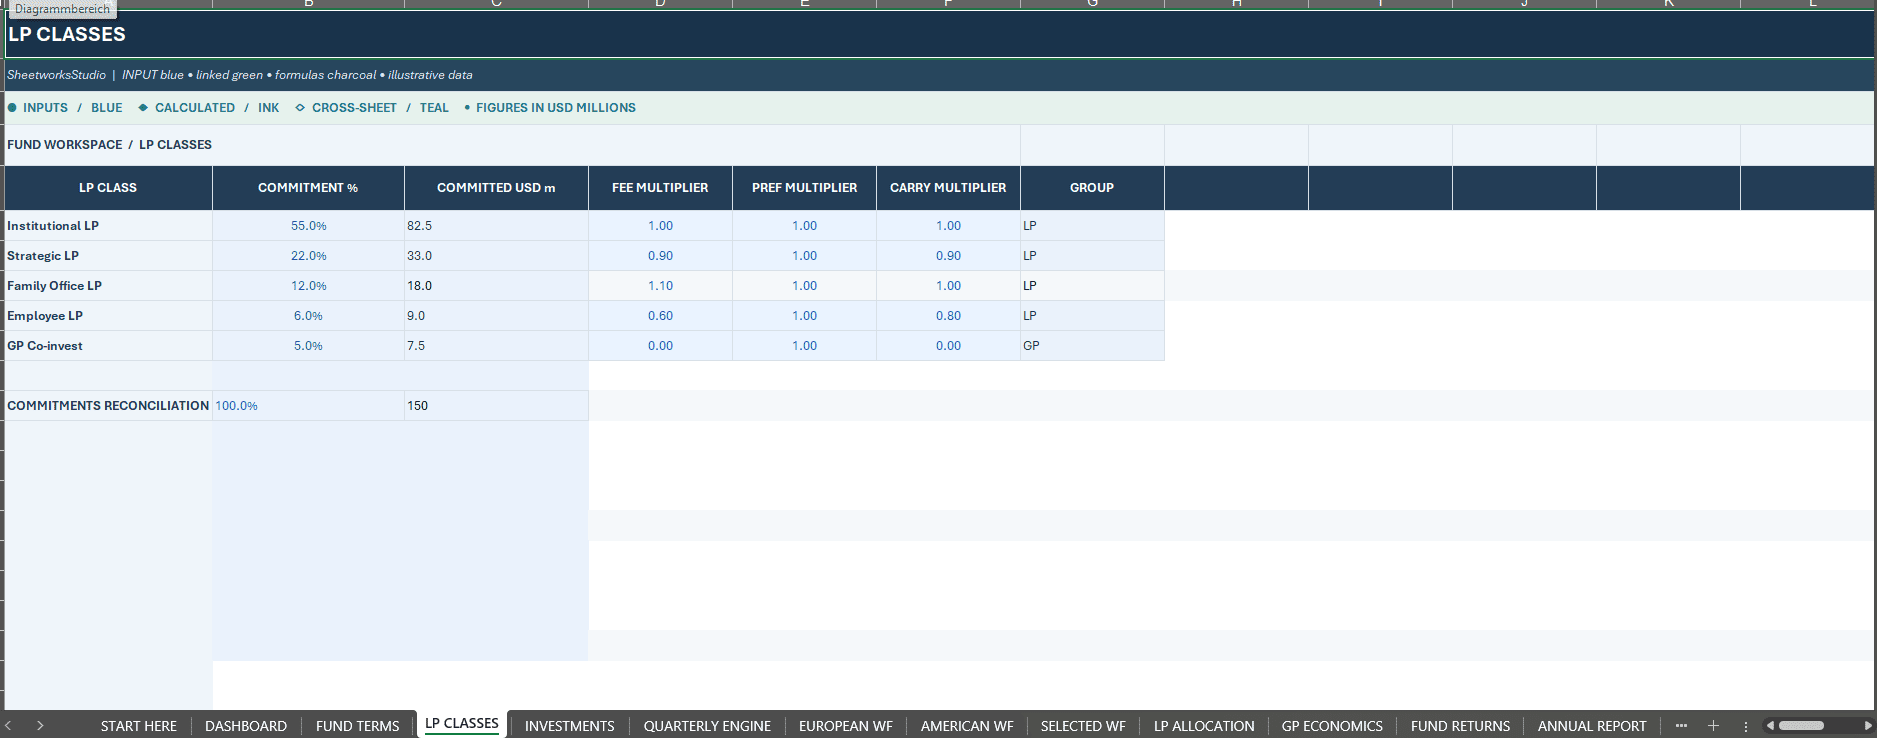
The workbook includes five illustrative classes:
- Institutional LP
- Strategic LP
- Family Office LP
- Employee LP
- GP Co-invest
Each class includes editable assumptions for:
- Commitment percentage
- Management fee multiplier
- Preferred return multiplier
- Carried interest multiplier
- Investor classification
Dedicated LP EUROPEAN and LP AMERICAN worksheets calculate quarterly class-level distributions and related economic allocations.
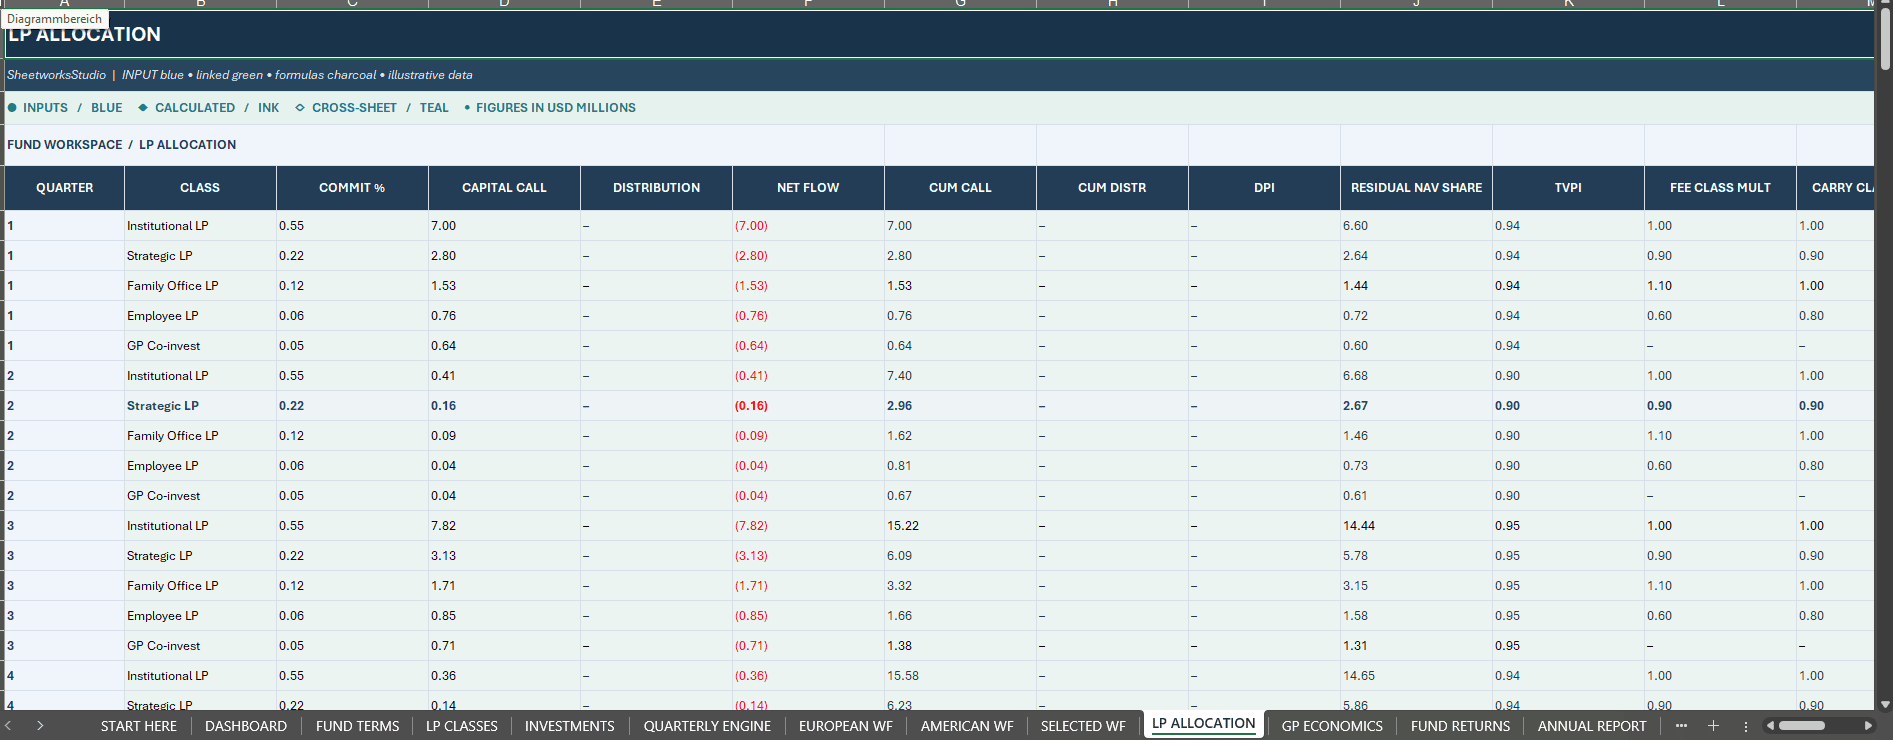
The LP ALLOCATION worksheet provides consolidated investor-class reporting, including capital calls, investor distributions, cumulative contributions, cash flows, DPI and TVPI.
This structure supports comparisons between investor groups with differing illustrative economic terms.
💰 GP ECONOMICS & CARRIED INTEREST
Evaluate the economic position of the general partner through a dedicated reporting module.
The GP ECONOMICS worksheet includes:
- Management fee income
- Gross carried interest
- Modeled clawback deductions
- Net carried interest
- GP co-investment capital calls
- GP co-investment distributions
- GP receipts
- GP net cash flows
- Cumulative GP economics
Explore how portfolio performance, preferred returns and distribution assumptions affect the allocation of proceeds between investors and the GP.
📈 PORTFOLIO INVESTMENTS & FUND RETURNS
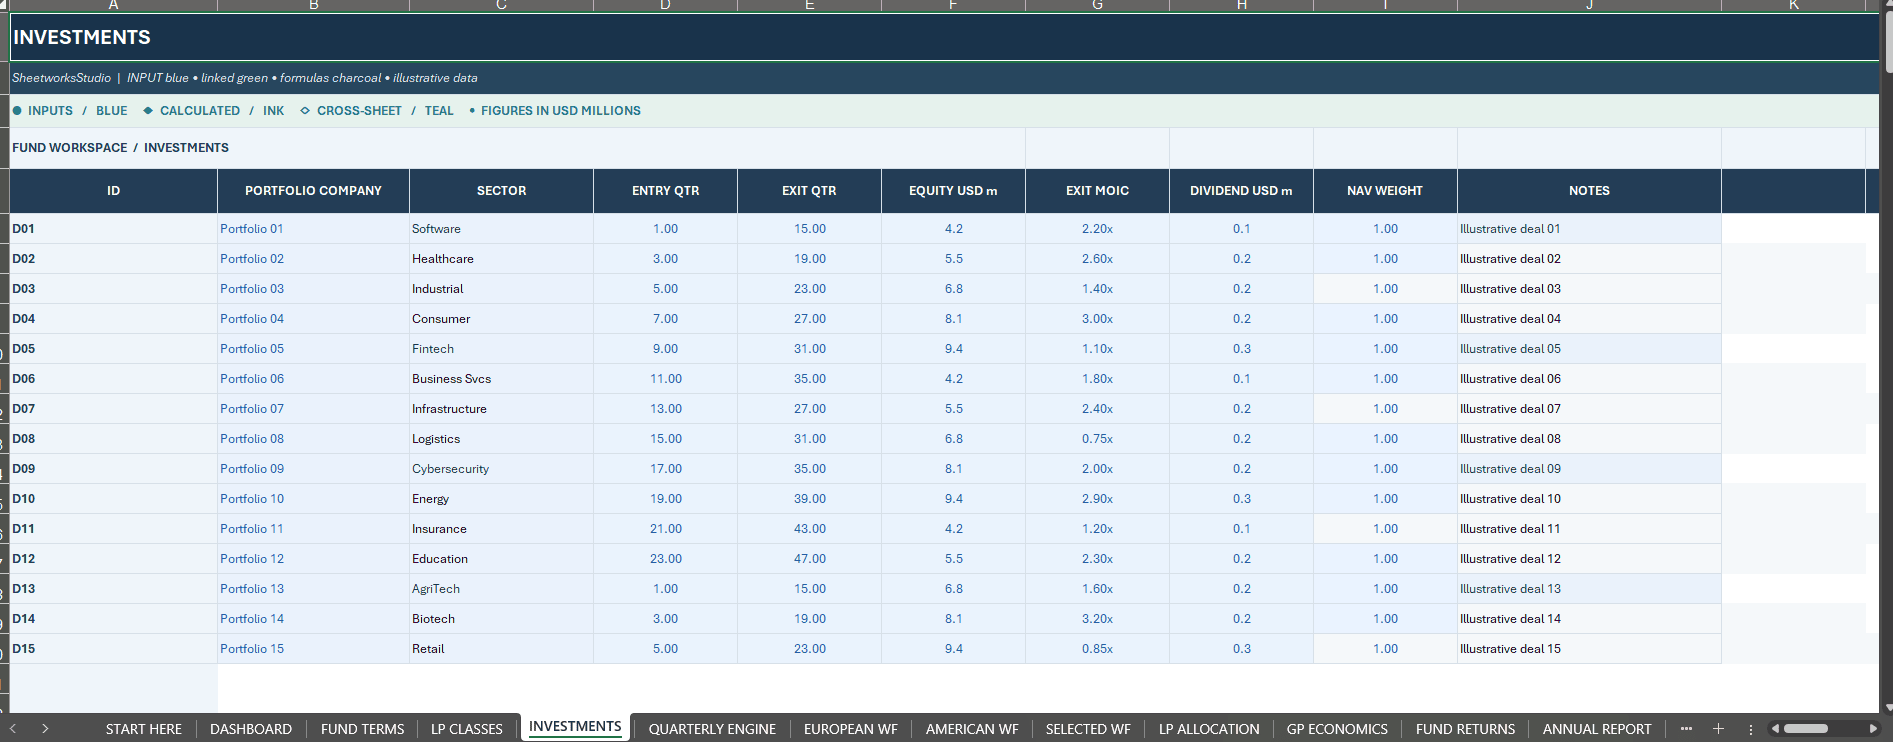
The model includes 15 fictional portfolio investments covering different illustrative sectors.
Configure investment-level assumptions such as:
- Portfolio company and sector
- Investment entry quarter
- Expected exit quarter
- Equity investment amount
- Exit multiple
- Dividend assumptions
- NAV-related parameters
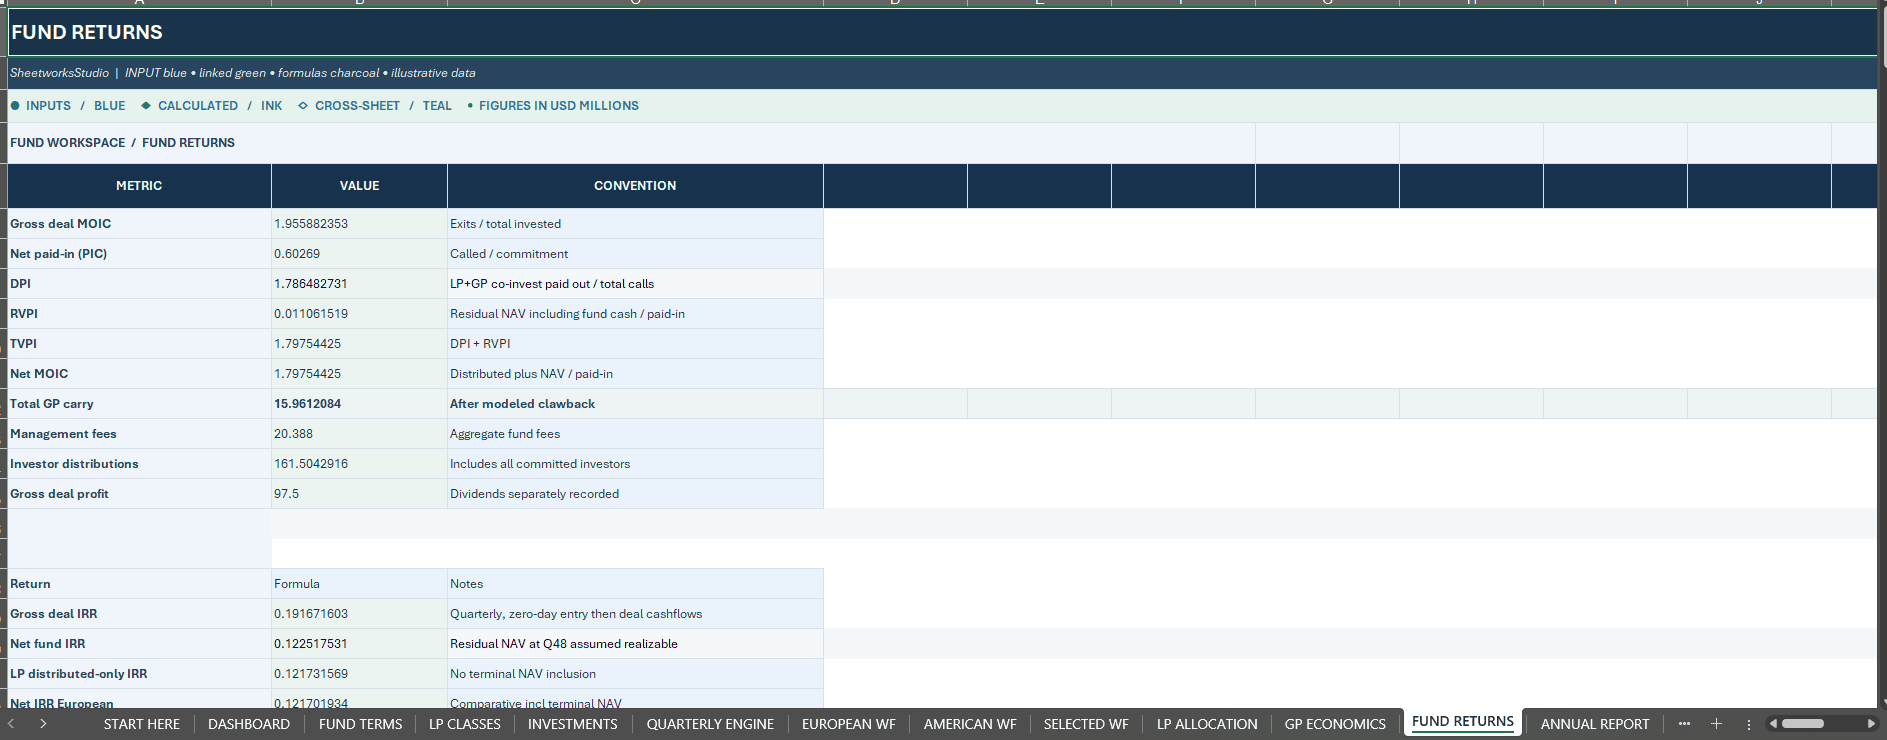
The FUND RETURNS worksheet calculates important private equity performance measures, including Gross Deal MOIC, Net MOIC, Gross IRR, Net Fund IRR, DPI, RVPI, TVPI, total management fees and investor distributions.
These measures provide a structured analytical basis for reviewing modeled fund performance across the investment lifecycle.
🔄 SCENARIO, SENSITIVITY & VALIDATION
Compare alternative fund outcomes using configurable assumptions.
Base Case – Central illustrative investment expectations.
Upside Case – Improved portfolio exit outcomes.
Downside Case – More conservative investment realizations.
The SENSITIVITY worksheet estimates the effect of alternative exit multiples on selected economic results.
Additional controls support changes to fund commitments, fee assumptions, preferred returns, carried interest and investor-class terms.
A dedicated VALIDATION worksheet includes 22 fund-level and class-level controls covering:
- Capital commitment reconciliation
- Capital-call limits
- European waterfall reconciliation
- American waterfall reconciliation
- Investor-class allocations
- Management fee allocations
- GP carry reconciliation
- Nonnegative cash and capital-call conditions
These checks help identify selected calculation inconsistencies but do not guarantee that all inputs or legal terms are valid.
📦 WHAT’S INCLUDED
1. Premium Private Equity Fund Financial Model (.xlsx)
- 19 interconnected Excel worksheets
- 12-year financial modeling horizon
- 48 quarterly periods
- 15 illustrative portfolio investments
- European and American waterfall structures
- Five investor classes
- GP carried interest and clawback calculations
- Fund NAV and cash flow reporting
- Gross and Net IRR, MOIC, DPI, RVPI and TVPI
- Eight dynamic dashboard charts
- Scenario and sensitivity analysis
- 22 model reconciliation checks
- Editable formulas and navigational links
- No VBA macros or live data connections
2. Professional How-to-Use Guide (14-Page PDF)
A detailed English-language guide covering workbook navigation, fund assumptions, portfolio investments, LP classes, quarterly fund cash flows, waterfall calculations, return metrics, scenarios, model validation and important conventions.
3. Illustrative Sample Data
The workbook contains fictional portfolio and investor information to demonstrate the integrated calculations and reporting structure.
⚙️ HOW TO GET STARTED
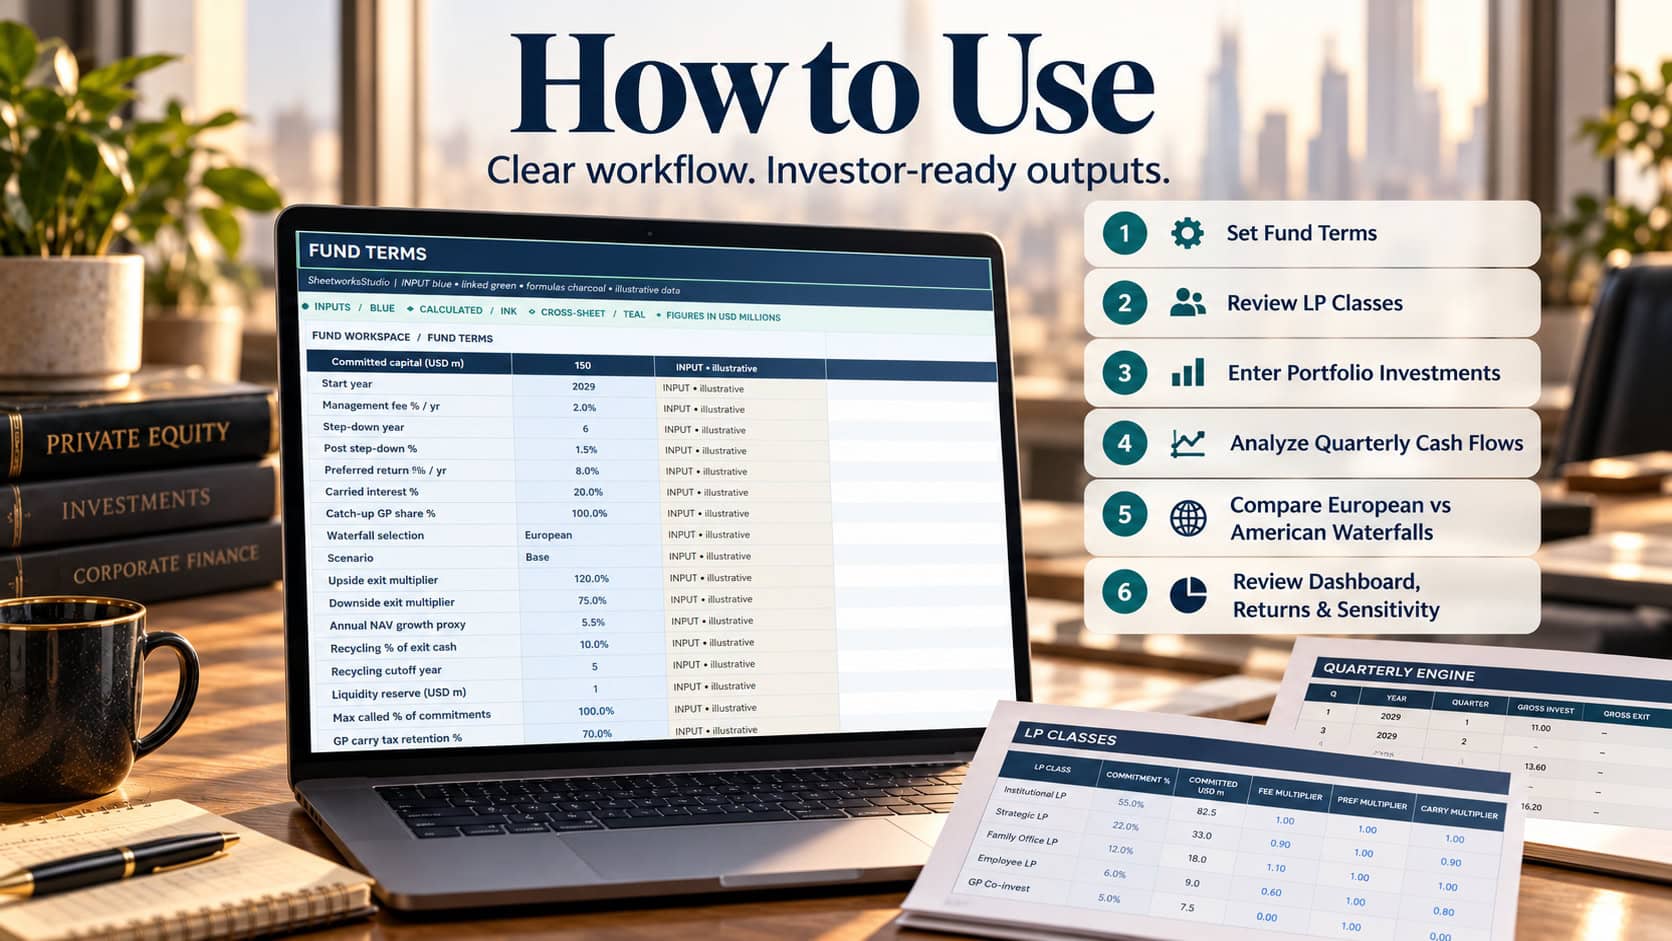
Step 1 – Configure Fund Terms
Open FUND TERMS and define fund commitments, starting year, management fees, preferred return, carried interest and waterfall selection.
Step 2 – Review Investor Classes
Adjust commitments and economic assumptions in LP CLASSES. Confirm that total commitment percentages equal 100%.
Step 3 – Enter Portfolio Investments
Replace the fictional investment assumptions with your own projected entry dates, investment amounts, dividend assumptions and exit expectations.
Step 4 – Review Quarterly Fund Cash Flows
Analyze the QUARTERLY ENGINE to evaluate capital calls, investment activity, fees, NAV and available distributions.
Step 5 – Compare Waterfall Structures
Review the EUROPEAN WF and AMERICAN WF worksheets, together with the investor-class calculations.
Step 6 – Analyze Fund Performance
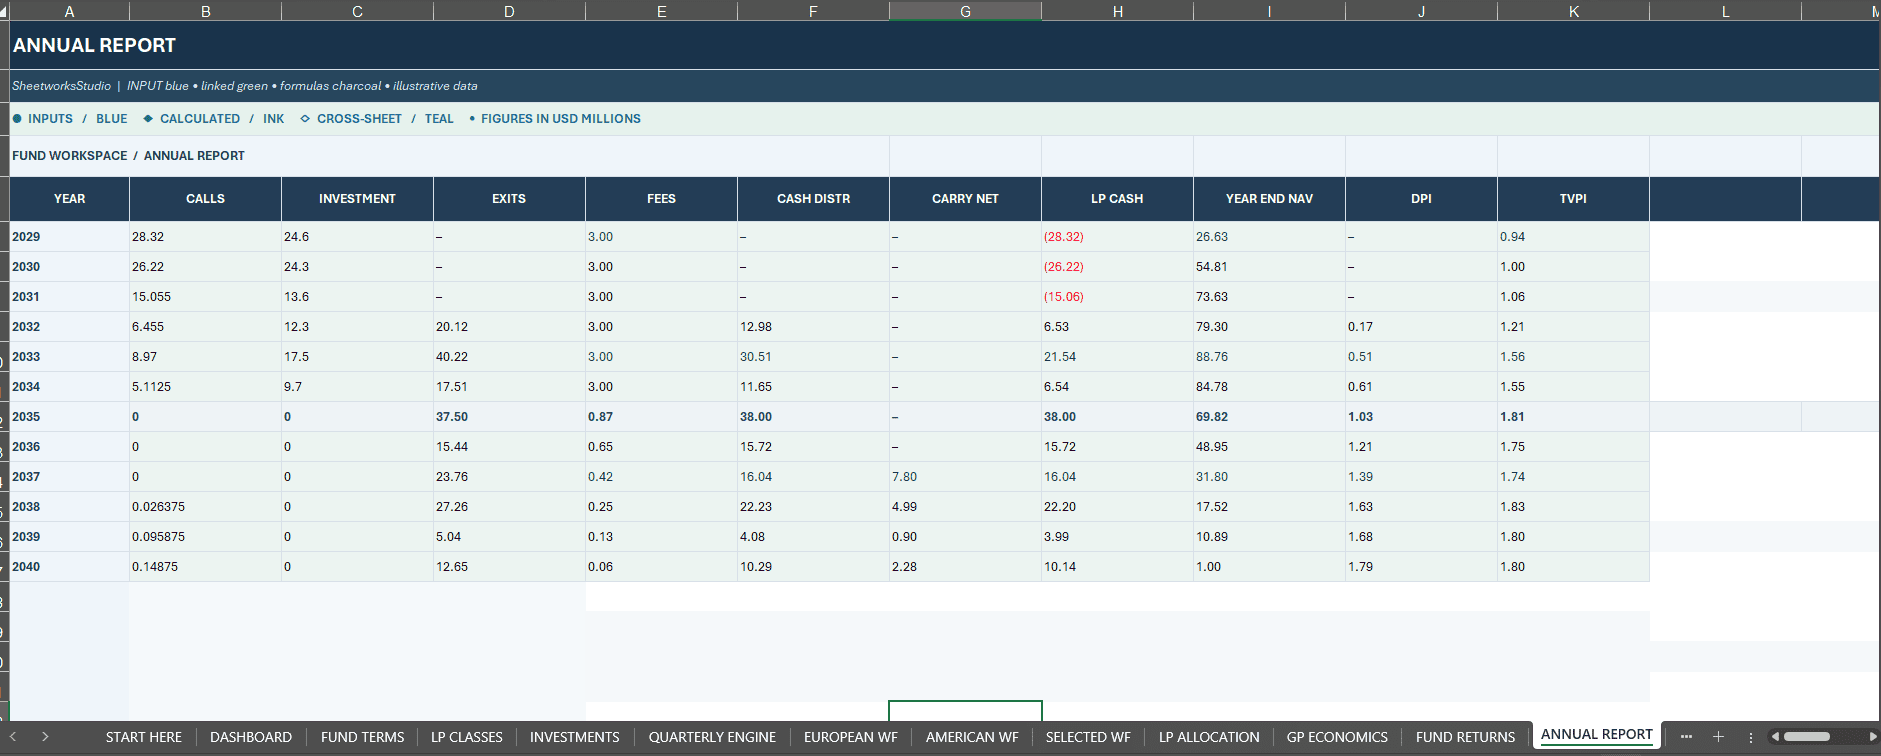
Use DASHBOARD, GP ECONOMICS, FUND RETURNS and ANNUAL REPORT to examine the financial results.
Step 7 – Validate and Compare
Review SENSITIVITY and confirm the relevant VALIDATION checks before interpreting the results.
IDEAL FOR
- Private Equity Fund Managers
- General Partners
- Limited Partners
- Institutional Investment Analysts
- Family Offices
- Fund Finance and Controlling Teams
- Investment Consultants
- Private Markets Professionals
- Financial Modeling Specialists
- Business Schools and Finance Educators
TECHNICAL SPECIFICATIONS
- File Format: Microsoft Excel (.xlsx)
- Forecast Horizon: 12 Years
- Forecast Frequency: Quarterly
- Financial Periods: 48
- Worksheets: 19
- Dashboard Charts: 8
- Investor Classes: 5
- Sample Investments: 15
- Waterfall Structures: European and American
- Scenarios: Base, Upside and Downside
- Formulas: Editable and visible
- Macros: None
- External Data Connections: None
- Included Documentation: 14-Page PDF User Guide
Microsoft Excel Desktop is recommended. Google Sheets import may be possible, but equivalent formula calculations, charts, navigation and formatting have not been independently validated.
IMPORTANT MODEL LIMITATIONS & DISCLAIMER
This is an illustrative and configurable private equity fund financial model. It is not a legal implementation of any specific fund’s Limited Partnership Agreement.
Preferred returns, management fees, carried interest, investor-class terms and clawback calculations use simplified modeling assumptions.
The sensitivity calculations are illustrative approximations, rather than fully independent waterfall recalculations for each alternative investment scenario.
The workbook uses a fixed 48-quarter modeling structure. Investment entry and exit assumptions must remain within the intended model horizon and be independently validated.
It does not provide comprehensive fund-level borrowing facilities, statutory fund accounting, tax reporting, regulatory compliance or legal capital-account administration.
All sample investments, fund assumptions, company information and financial results are fictional.
The model does not constitute financial, investment, accounting, regulatory, tax or legal advice. Users are responsible for reviewing all assumptions, financial calculations, contractual arrangements and investment decisions with appropriately qualified professionals.
No physical product will be shipped.
Developed by SheetworksStudio – Professional Financial Models & Business Decision Tools.
Similar ProductsOther customers were also interested in...



 eFinancialModels
Electric Vehicle (EV) Charging Station Financial M...
With this comprehensive 5- or 10-year monthly tool, investors can assess the viability of setting up... Read more

Financial Model for Mobile App | Mobile App Busine...
The Mobile App Financial Plan Template in Excel allows you to develop financial projections when lau... Read more

 HenrySheykin
Food Truck Financial Model Excel Template
The Food Truck Financial Model helps entrepreneurs, founders, business owners, consultants, and anal... Read more

Green Hydrogen Production from Wind Energy Financi...
The Green Hydrogen from Wind Financial Model aims to comprehensively forecast a horizon of 40 years ... Read more

Simple Mutual Non-Disclosure Agreement Template
Protect your business secrets with ease using our Simple Mutual Non-Disclosure Agreement Template. S... Read more

Solar Energy Financial Model
The Solar Energy Financial Model Spreadsheet Template in Excel assists you in preparing a sophistica... Read more

 Peter Graf
The Customer-Centric Financial Model for Restauran...
Starting a restaurant without a financial plan is like driving a car blindfolded. You wouldn´t do i... Read more
You must log in to submit a review.