
0 ITEMS

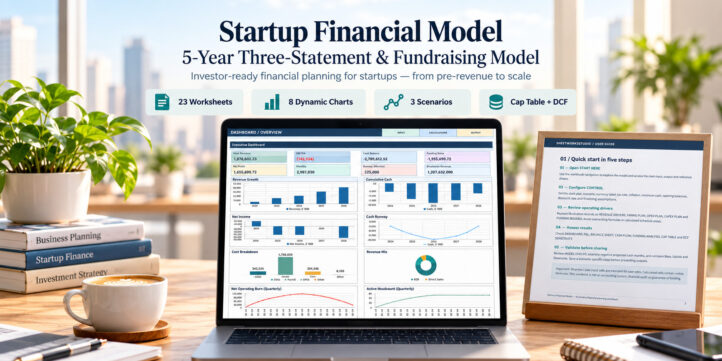
Startup Financial Model Excel – 5-Year Three-Statement Forecast, Fundraising, Cap Table & DCF Valuation
Editable 60-month startup financial model with integrated P&L, balance sheet, cash flow, fundraising, cap table, DCF valuation, Base/Upside/Downside scenarios and eight dashboard charts. Includes an 8-page PDF guide.

STARTUP FINANCIAL MODEL
5-Year Three-Statement Forecast, Fundraising & Valuation
Plan your startup. Forecast financial performance. Understand funding requirements and ownership dilution.
The Startup Financial Model by SheetworksStudio is a professional, fully editable Excel financial planning system designed for entrepreneurs, startup founders, CFOs, advisors and financial analysts.
Bring revenue assumptions, hiring, operating expenses, capital investment, fundraising, financial statements, liquidity analysis, ownership dilution and DCF valuation together in one integrated 60-month forecasting framework.
The workbook includes illustrative 2029–2033 data, with a configurable starting year and transparent financial calculations.
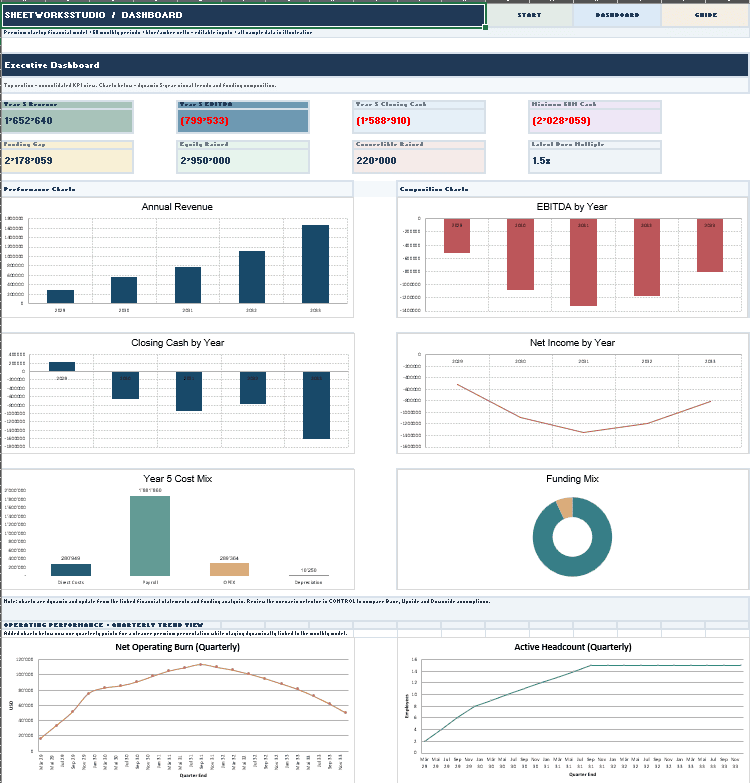
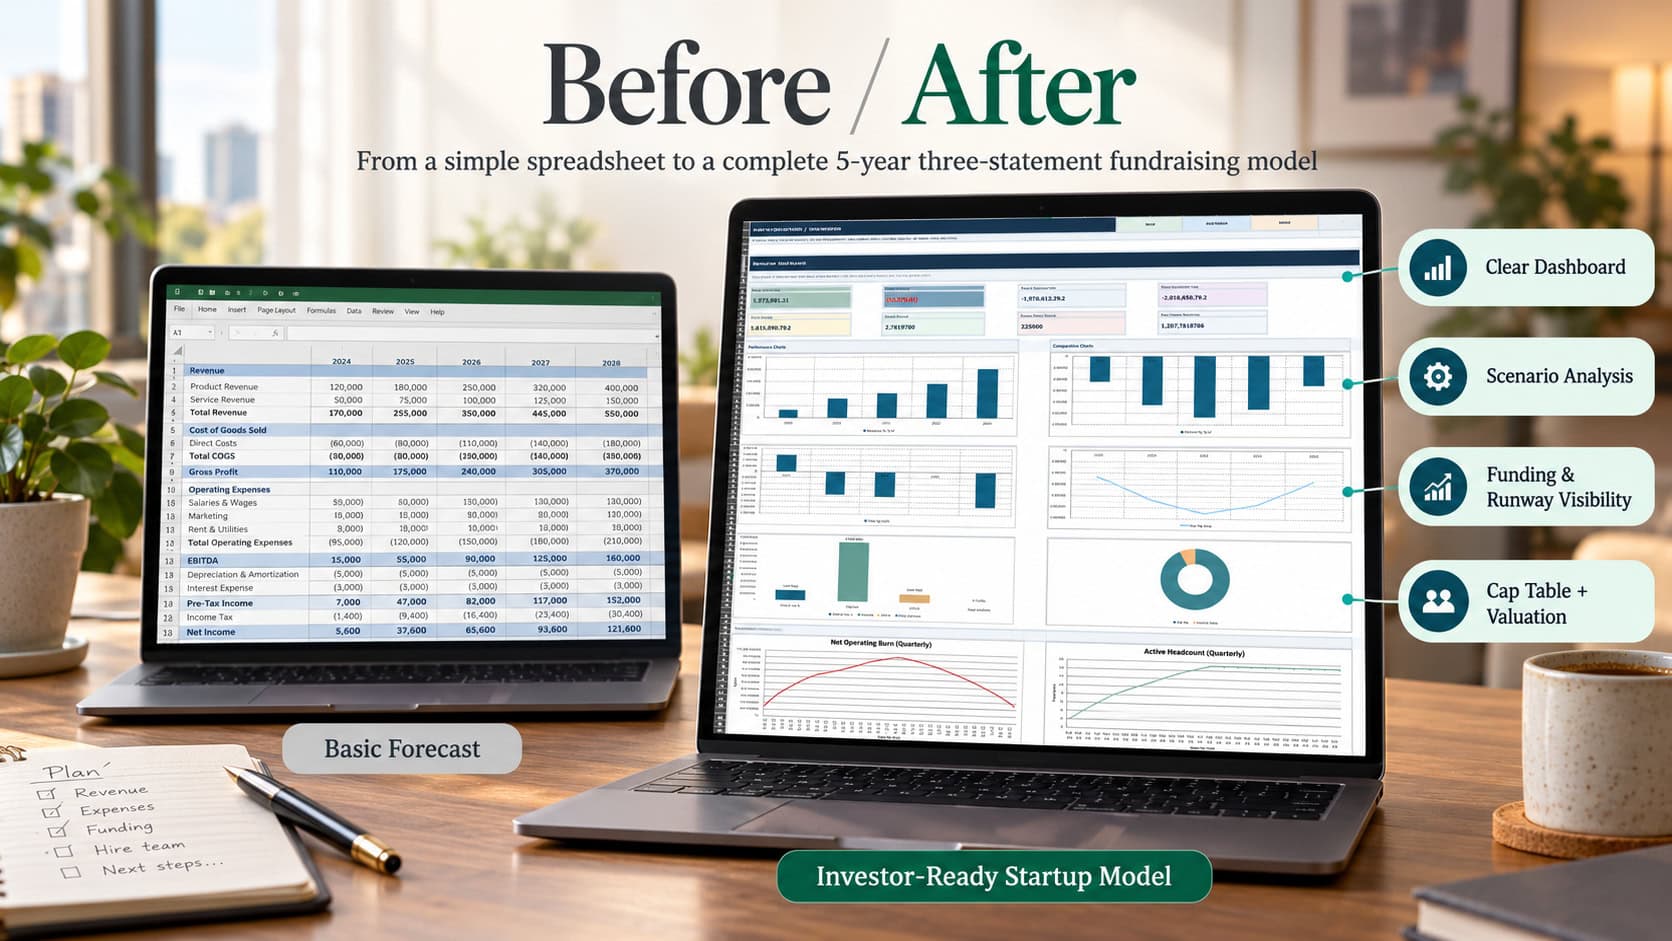
📊 EXECUTIVE DASHBOARD – EIGHT DYNAMIC CHARTS
Turn complex financial projections into decision-relevant management insights.
The Executive Dashboard includes eight data-linked charts covering:
- Annual Revenue
- EBITDA Performance
- Closing Cash Balance
- Net Income
- Cost Composition
- Funding Composition
- Quarterly Operating Cash Burn
- Quarterly Active Headcount
Financial KPI cards summarize Year 5 operating performance, projected liquidity, minimum cash balance, funding requirements, equity proceeds, convertible financing and cash burn indicators.
📅 60-MONTH FINANCIAL FORECAST
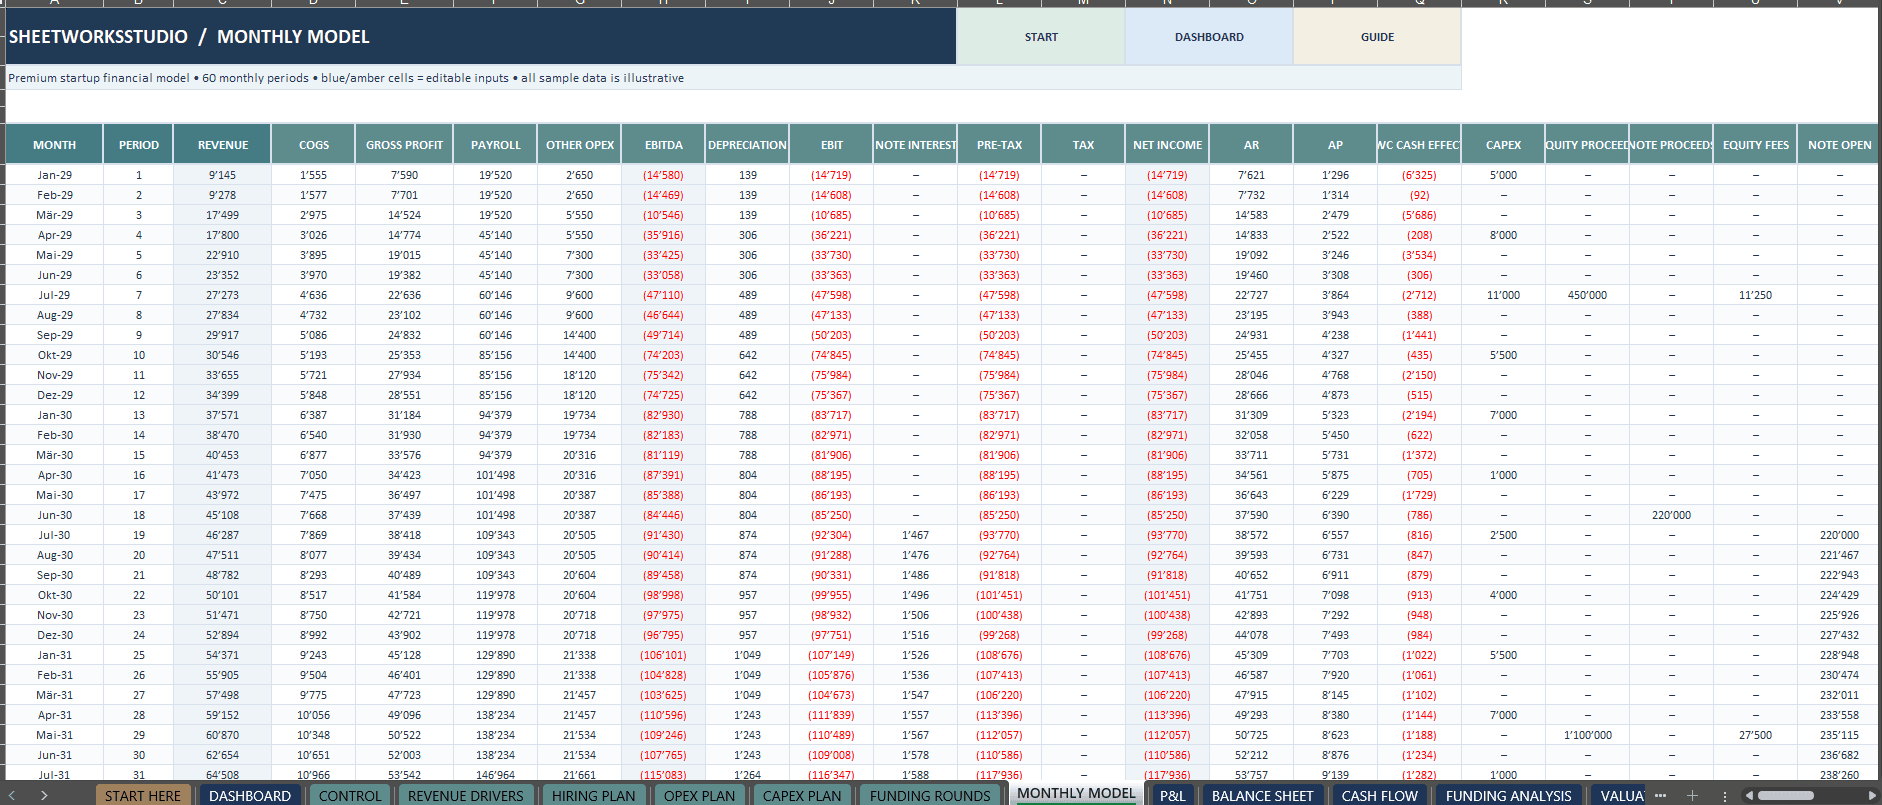
Build a detailed monthly financial forecast across five years, supported by annual financial summaries.
The model links startup-specific operating assumptions to revenue generation, workforce costs, operating expenses, capital expenditure, financing and cash requirements.
A configurable start year allows the illustrative 2029–2033 forecast to be adapted to a different planning period.
🧮 INTEGRATED THREE-STATEMENT MODEL
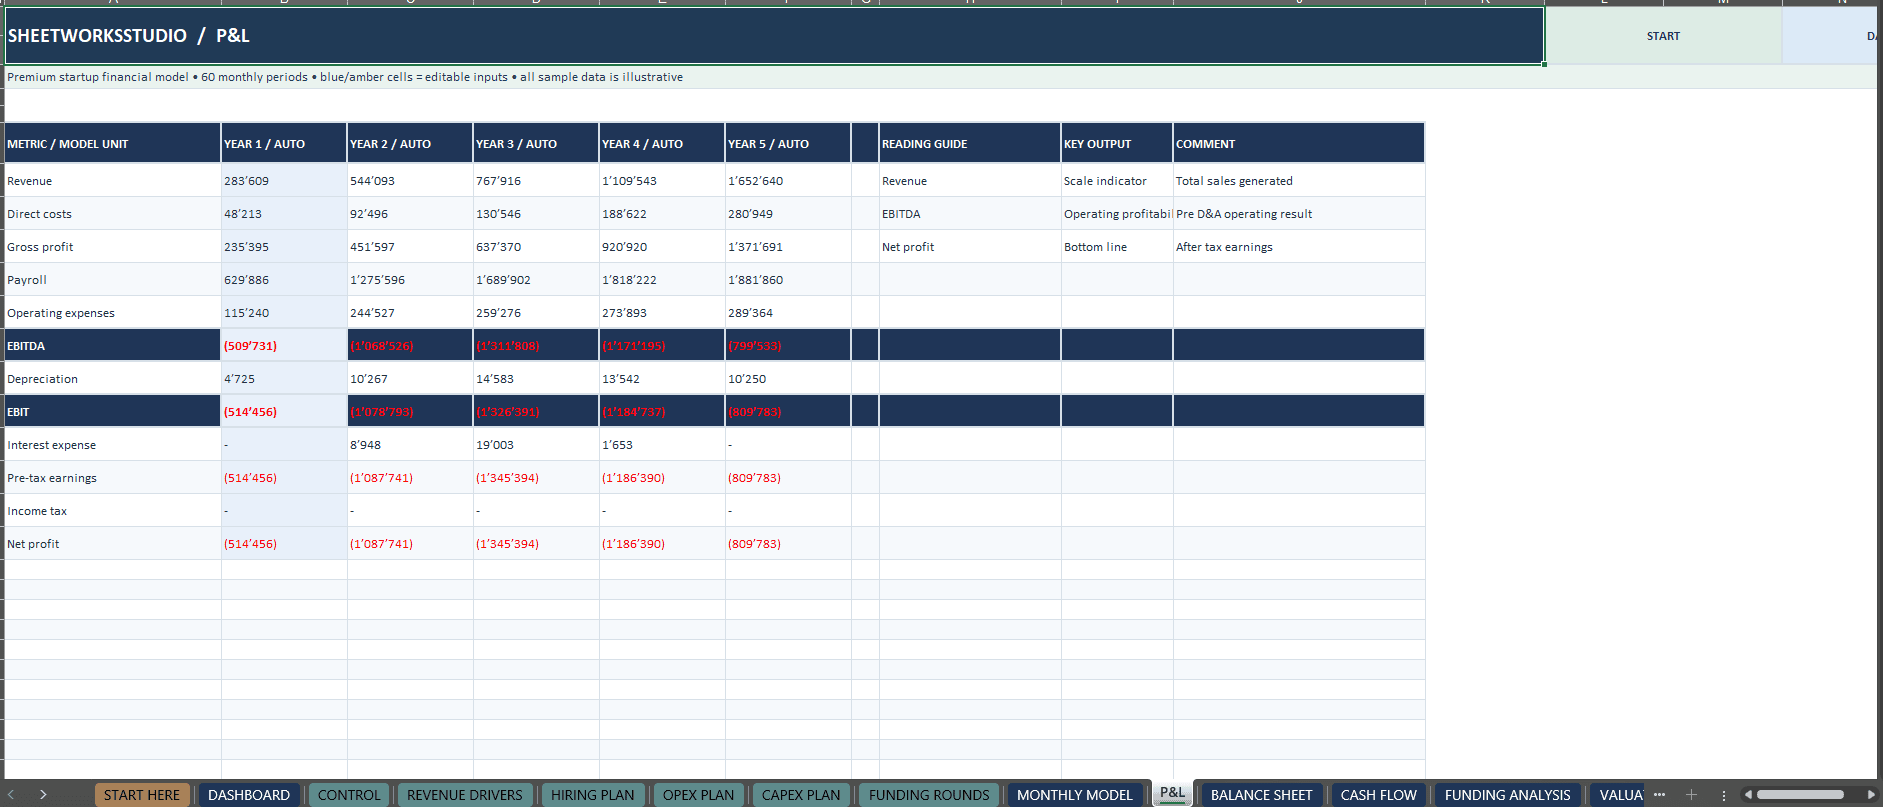
Income Statement (P&L)
Forecast revenue, direct costs, gross profit, payroll, operating expenses, EBITDA, depreciation, operating profit, taxes and net earnings.
Balance Sheet
Track cash, accounts receivable, fixed assets, payables, convertible financing and shareholders’ equity.
Cash Flow Statement
Analyze operating, investing and financing activities, capital expenditures, financing proceeds, opening cash and closing cash.
The statements connect to the same monthly financial calculation engine, with additional reconciliation checks to help identify inconsistencies.
REVENUE & OPERATING EXPENSE PLANNING
Revenue Drivers
Model subscription, one-time and usage-based revenue streams using configurable prices, quantities, launch timing, growth assumptions and churn.
Annual subscription pricing in the illustrative dataset is recognized monthly at one-twelfth of the entered annual price. Separate upfront annual billing and deferred revenue accounting are not included.
Hiring Plan
Plan employees, hiring dates, compensation, employer costs and salary escalation.
The founder monthly compensation assumption in CONTROL is linked to the initial CEO salary in the Hiring Plan.
OPEX Planning
Forecast software subscriptions, marketing, administration, professional services and other operating expenses.
CAPEX & Depreciation
Schedule capital expenditures and calculate depreciation based on modeled investment timing and useful lives.
Additional input worksheets provide capacity to extend the model beyond the illustrative core operating records.
💰 FUNDRAISING & FINANCIAL RUNWAY
Assess the financing required to support your startup’s operating plan.
The financing modules include:
- Equity funding rounds
- Convertible financing
- Financing timing assumptions
- Capitalized convertible interest
- Minimum liquidity requirements
- Cash buffer analysis
- Funding gap calculations
- Operating burn indicators
The model identifies potential liquidity shortfalls after considering scheduled financing contributions. Additional funding is not inserted automatically.
CAP TABLE & OWNERSHIP DILUTION
Analyze the illustrative effects of funding rounds and convertible note conversion on ownership.
The Cap Table includes founder shares, equity issuances, pre-money valuation assumptions, convertible conversion pricing, total shares and founder ownership percentages.
This module provides an analytical ownership illustration and does not replace a legal capitalization register or detailed investor share-class documentation.
📈 DCF VALUATION & SENSITIVITY ANALYSIS
Estimate illustrative enterprise value using an unlevered discounted cash flow approach.
The valuation modules incorporate:
- EBIT and cash tax assumptions
- Depreciation and capital expenditures
- Working capital changes
- Unlevered free cash flow
- Discount rate
- Terminal growth assumptions
- DCF sensitivity analysis
Where terminal-year free cash flow is negative, the model does not assign a positive Gordon-growth perpetuity value to that negative cash flow.
Valuation outputs are planning estimates and depend on the selected assumptions.
THREE FINANCIAL SCENARIOS
Compare alternative startup operating conditions.
Base Case – Central financial assumptions.
Upside Case – More favorable revenue growth and operating conditions.
Downside Case – More conservative growth, expense and financing assumptions.
Scenario selection affects operating performance, cash flow and capital requirements through linked calculations.
⚙️ PROFESSIONAL WORKBOOK STRUCTURE
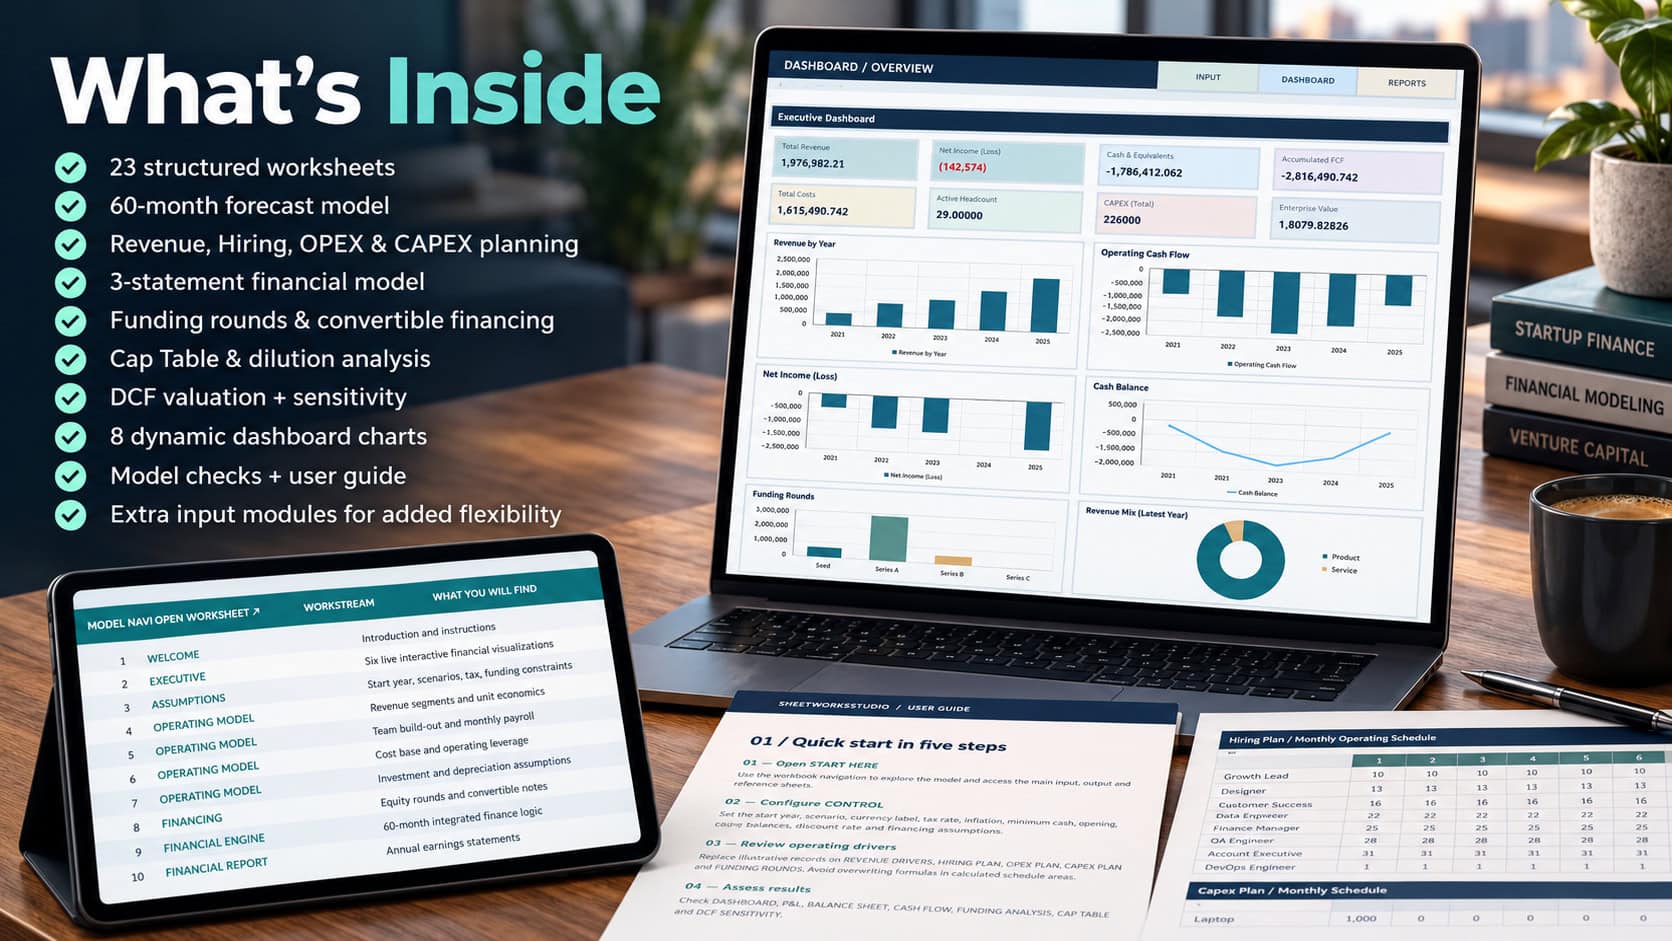
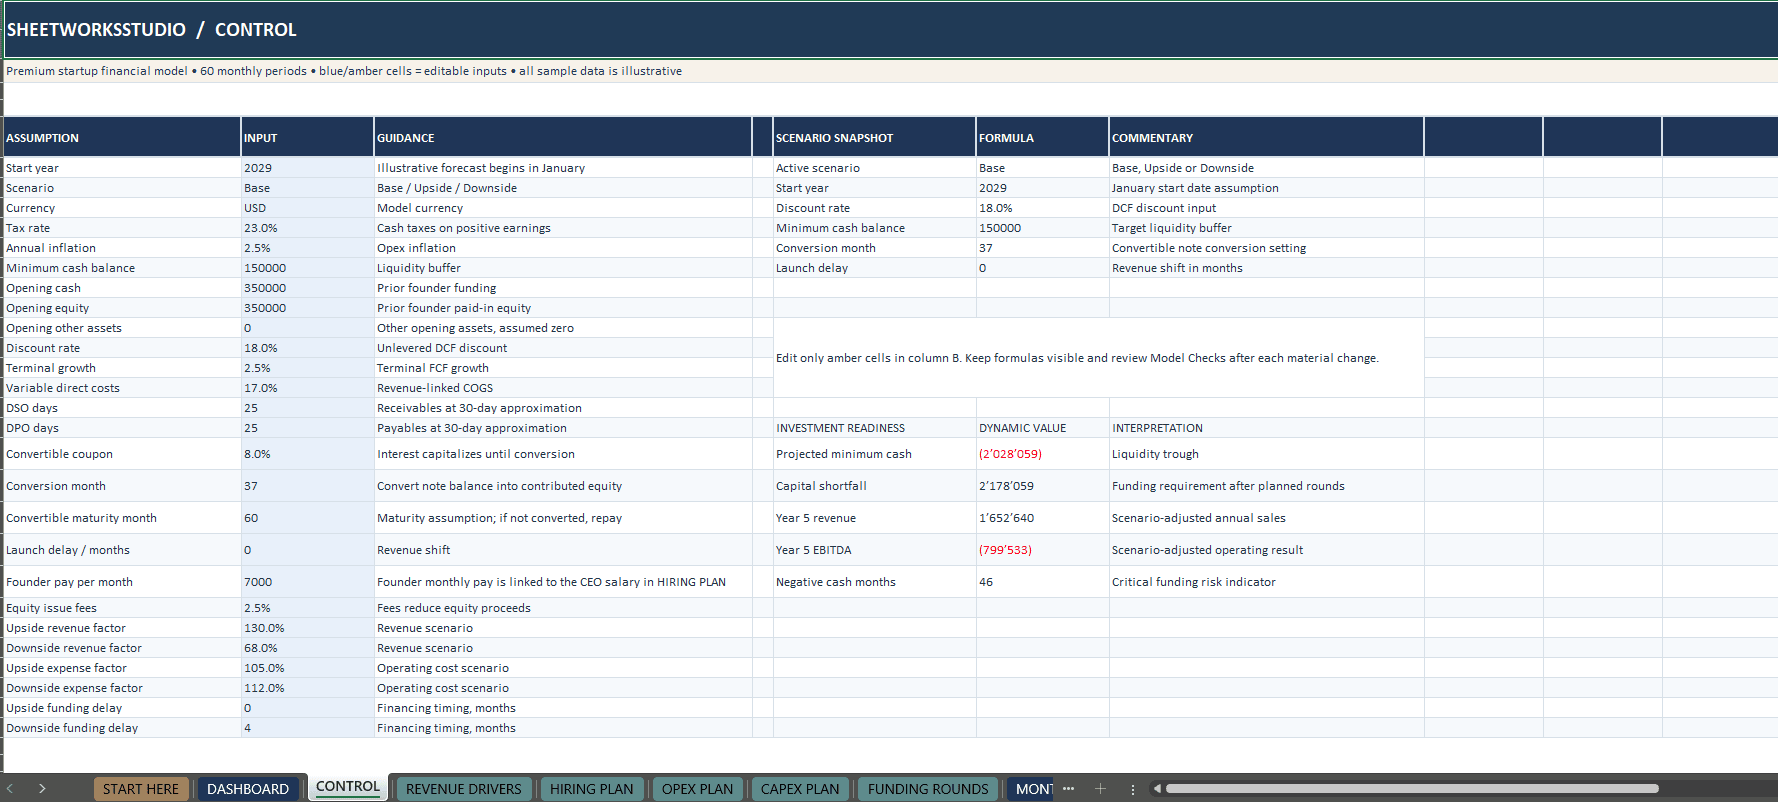
The Excel workbook contains 23 organized worksheets, including:
- START HERE
- CONTROL
- EXECUTIVE DASHBOARD
- REVENUE DRIVERS
- HIRING PLAN
- OPEX PLAN
- CAPEX PLAN
- FUNDING ROUNDS
- MONTHLY MODEL
- P&L
- BALANCE SHEET
- CASH FLOW
- FUNDING ANALYSIS
- VALUATION
- CAP TABLE
- DCF SENSITIVITY
- MODEL CHECKS
- USER GUIDE
- Additional operating input modules
- CHART DATA
Input fields and calculated outputs are visually distinguished. Formulas remain editable and accessible.
📦 WHAT’S INCLUDED
1. Premium Startup Financial Model (.xlsx)
A 23-worksheet Excel workbook with 60 monthly forecasting periods, integrated financial statements, fundraising analysis, Cap Table, DCF valuation, scenario controls and eight dashboard charts.
2. Professional How-to-Use Guide (8-Page PDF)
A structured guide explaining workbook setup, financial assumptions, operating drivers, financing analysis, three-statement reporting, valuation, dashboard charts and troubleshooting.
3. Illustrative Sample Data
The model includes fictional startup operating and financing assumptions to demonstrate the integrated forecasting workflow.
IDEAL FOR
Startup founders, entrepreneurs, SaaS business operators, CFOs, financial analysts, startup consultants, advisors, accelerators, incubators and investors reviewing illustrative business forecasts.
HOW TO GET STARTED
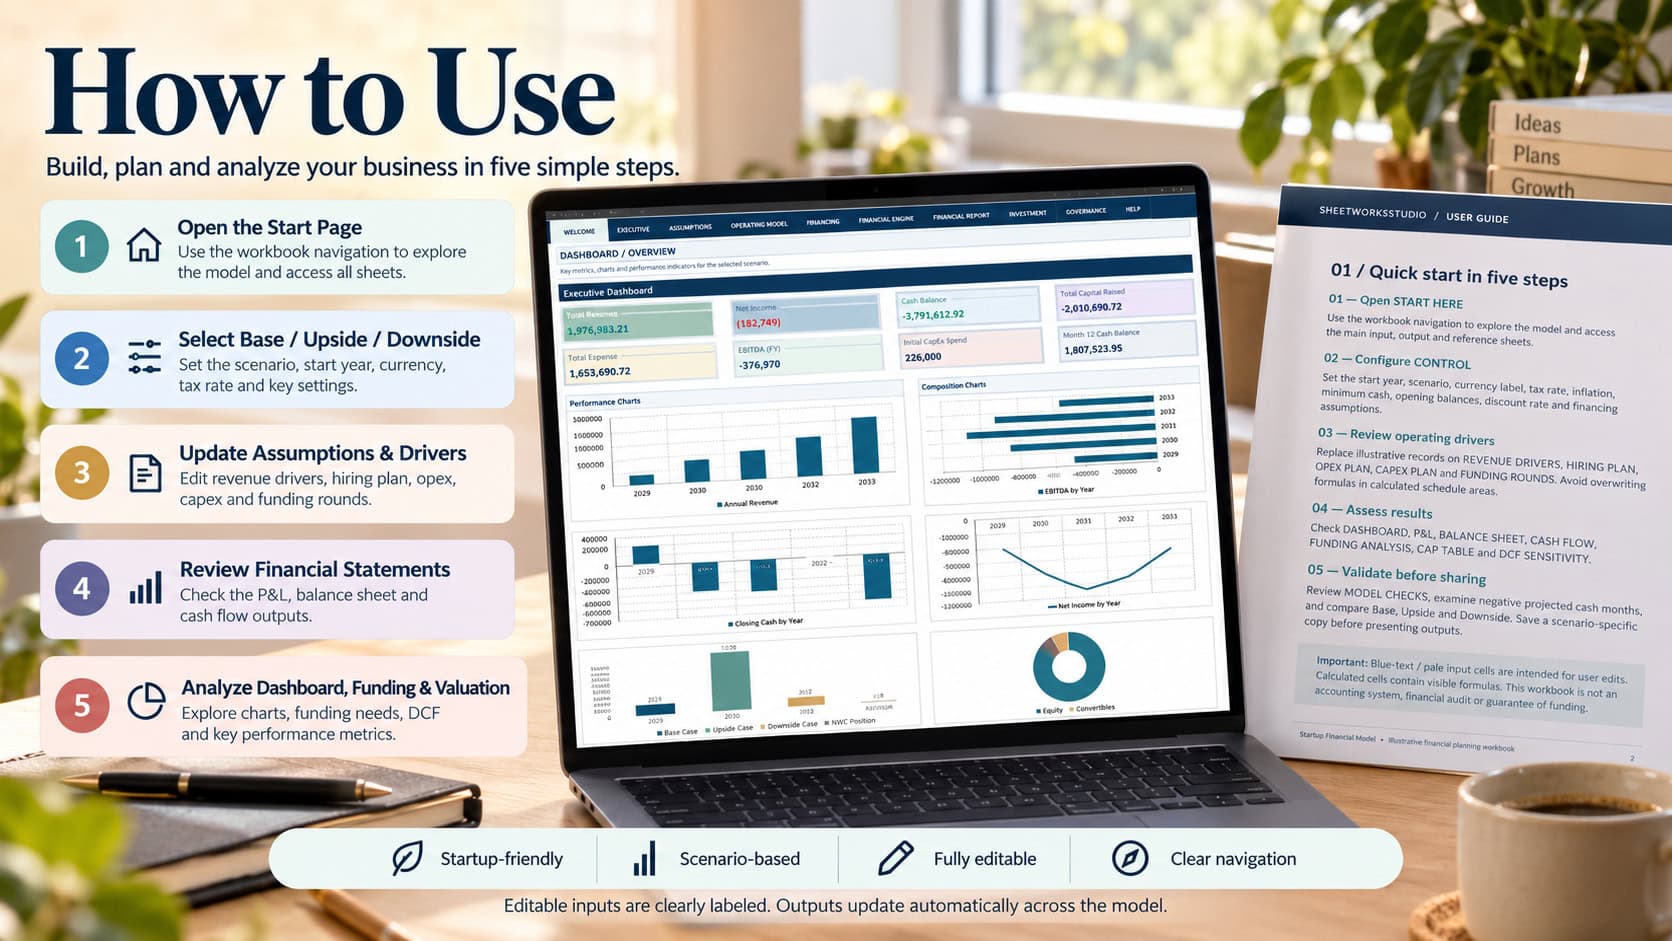
- Open START HERE and review the workbook navigation.
- Configure your forecast year and scenario in CONTROL.
- Replace illustrative revenue, hiring, OPEX, CAPEX and funding assumptions.
- Review the 60-month calculation engine and the linked financial statements.
- Analyze projected cash requirements, funding gaps, Cap Table and DCF valuation.
- Compare scenarios and confirm the reconciliation checks before relying on the outputs.
TECHNICAL SPECIFICATIONS
- File format: Microsoft Excel (.xlsx)
- Forecast horizon: 60 months / 5 years
- Workbook structure: 23 worksheets
- Dashboard: 8 dynamic charts
- Scenarios: Base, Upside and Downside
- Integrated P&L, Balance Sheet and Cash Flow Statement
- Fundraising, Cap Table and DCF modules
- Editable and visible formulas
- Macro-free
- No external workbook connections
- Eight-page PDF user guide
- Illustrative 2029–2033 sample data
Microsoft Excel Desktop is recommended. Google Sheets import may be possible, but formulas, charts, dropdowns and navigation have not been independently validated in Google Sheets.
FINANCIAL MODEL LIMITATIONS & DISCLAIMER
This workbook is a simplified financial planning and analytical model, not a complete statutory accounting system or audited GAAP/IFRS financial model.
Taxes, working capital, subscription revenue recognition, convertible financing, capitalization and valuation use simplified assumptions.
The illustrative financial forecast may show negative projected cash balances and additional funding requirements even after scheduled financing rounds. These are modeled liquidity risks, not guaranteed funding proceeds.
The workbook does not constitute financial, investment, legal, tax, accounting or valuation advice. All assumptions, calculations and outputs should be independently reviewed before use in business or investment decisions.
This is a digital download. No physical product will be shipped.
Developed by SheetworksStudio – Professional Excel Financial Models & Business Templates.
Similar ProductsOther customers were also interested in...



 eFinancialModels
Electric Vehicle (EV) Charging Station Financial M...
With this comprehensive 5- or 10-year monthly tool, investors can assess the viability of setting up... Read more

Financial Model for Mobile App | Mobile App Busine...
The Mobile App Financial Plan Template in Excel allows you to develop financial projections when lau... Read more

 HenrySheykin
Food Truck Financial Model Excel Template
The Food Truck Financial Model helps entrepreneurs, founders, business owners, consultants, and anal... Read more

Green Hydrogen Production from Wind Energy Financi...
The Green Hydrogen from Wind Financial Model aims to comprehensively forecast a horizon of 40 years ... Read more

Simple Mutual Non-Disclosure Agreement Template
Protect your business secrets with ease using our Simple Mutual Non-Disclosure Agreement Template. S... Read more

Solar Energy Financial Model
The Solar Energy Financial Model Spreadsheet Template in Excel assists you in preparing a sophistica... Read more

 Peter Graf
The Customer-Centric Financial Model for Restauran...
Starting a restaurant without a financial plan is like driving a car blindfolded. You wouldn´t do i... Read more
You must log in to submit a review.