
0 ITEMS

How Do I Know If an Investment Is Worth It? (Excel Analysis Template)

Key Takeaways
- An investment is worth it when Net Present Value (NPV) is positive: in our worked example, a $100,000 investment returns an NPV of $43,844 at a 10% discount rate.
- Internal Rate of Return (IRR) tells you the annual return your cash flows actually generate: the base case here delivers 25.7%, comfortably above a typical 10-12% hurdle rate.
- Payback period matters for liquidity: the base case investment repays itself in roughly 2.6 years, well inside a typical 5-year window.
- Stress-testing with a scenario (a 20% drop in revenue) is not optional: it drops NPV to $15,076 and IRR to 15.7%, but the investment still clears the bar.
- more than 9 in 10 small businesses experienced a financial or operational challenge in 2023 according to the Federal Reserve’s 2024 Small Business Credit Survey, which is exactly why testing assumptions before committing capital matters.
- Excel remains the dominant tool finance professionals use for budgeting, forecasting, and investment analysis, so building this analysis in Excel puts you in good company.
- You do not need a $10,000-$50,000 custom build to run this analysis correctly: a well-structured template handles NPV, IRR, and payback with the same rigor.
Small businesses employ 61.7 million Americans, representing 46.4% of private sector employment, according to the U.S. Small Business Administration, Office of Advocacy (2023 FAQ). Every one of those businesses eventually faces the same question: is this investment worth the money. Buying new equipment, opening a second location, or funding a marketing push all compete for the same limited cash. According to the Federal Reserve’s 2024 Small Business Credit Survey, more than 9 in 10 small businesses experienced a financial or operational challenge in 2023, which means a bad investment call carries real consequences. The good news is that you can answer the worth-it question with three numbers: Net Present Value, Internal Rate of Return, and payback period, all calculated in an Excel model you can build in under an hour.
This guide walks through gathering your assumptions, building the Excel formulas step by step, interpreting the results, and stress-testing them against a worse-than-expected scenario. By the end you will have a repeatable template for any future investment decision.
Step 1: Gather Your Investment Assumptions
Every investment analysis starts with three inputs: the upfront cost, the cash flows the investment generates, and the rate you use to discount those future cash flows back to today’s dollars. Get these three numbers right before you open Excel.
Initial Investment Cost
The initial investment cost is every dollar you spend before the investment starts generating cash: purchase price, installation, training, and any working capital increase needed to support the new activity. Underestimating this figure is one of the most common mistakes in investment analysis (see the Common Mistakes section below), so build in a contingency of 5-10% for unplanned costs.
Projected Cash Flows (Year 1-5)
Cash flow is the net cash the investment produces each year: incremental revenue minus the direct costs of generating it, minus any taxes attributable to the investment. Use conservative, defensible numbers rather than best-case guesses. If your underlying revenue or expense assumptions come from a broader financial model, confirm the balance sheet actually balances before you pull numbers from it into your investment analysis.
Discount Rate (Cost of Capital)
The discount rate, also called the hurdle rate or cost of capital, is the minimum annual return you require to justify tying up your money in this investment instead of an alternative use. For a small business, a discount rate of 8-15% is common, reflecting the return on debt, the return owners expect on equity, and a risk premium for the specific investment. A higher discount rate for a riskier project is not being pessimistic, it is being accurate.
Step 2: Build the Excel Model
An Excel investment model needs four building blocks: a cash flow timeline, an NPV formula, an IRR formula, and a payback calculation. Each one answers a different piece of the worth-it question.
Setting Up the Cash Flow Timeline
Put Year 0 (the initial investment, entered as a negative number) in one cell, then Years 1 through 5 as positive cash flows across the row to its right. This timeline is the single input every other formula in the model references, so keep it in one clean row with no gaps.
Calculating Net Present Value (NPV) with =NPV
Excel’s =NPV(rate, value1, value2, ...) function discounts a series of future cash flows back to today’s value, then you separately add the Year 0 investment (which is already at today’s value and should not be discounted). The formula looks like =NPV(discount_rate, Year1:Year5) + Year0, where Year0 is entered as a negative number. A positive result means the investment creates value above your required return; a negative result means it destroys value.
Calculating Internal Rate of Return (IRR) with =IRR
Excel’s =IRR(values, guess) function finds the discount rate at which NPV equals exactly zero, which is the annualized return the investment actually generates. Select the full cash flow range including the negative Year 0 investment, for example =IRR(Year0:Year5). If Excel cannot converge on an answer, supply a starting guess such as =IRR(Year0:Year5, 0.1).
Calculating Payback Period (Simple & Discounted)
Simple payback period is the number of years until cumulative cash flow turns positive, calculated by running a cumulative sum row and finding where it crosses zero. Discounted payback period does the same thing but uses the present value of each year’s cash flow instead of the raw amount, which gives a more conservative (and more accurate) answer because it accounts for the time value of money. A discounted payback period that never turns positive within your cash flow horizon is a warning sign, even if NPV is positive.
Step 3: Interpret the Results
The three metrics work together, not in isolation, and each tells you something the others do not.
NPV > 0 Means Profitability
A positive NPV means the investment generates more value, in today’s dollars, than the return you required. NPV is the single most reliable metric here because it accounts for both the size and the timing of every cash flow, and it directly answers “is this worth it” in dollar terms rather than a percentage.
IRR vs. Hurdle Rate
IRR answers a different question: what annual rate of return am I actually earning. Compare IRR against your hurdle rate (the discount rate you set in Step 1); if IRR exceeds the hurdle rate, the investment clears your minimum bar. Be cautious with IRR when comparing projects of very different sizes, since a small project can post a high IRR on a tiny dollar amount while a larger project with a lower IRR still creates more total value.
Payback Period for Liquidity
Payback period does not measure profitability, it measures how long your cash is tied up. A shorter payback period matters more when cash is tight or the business needs flexibility to redeploy capital, which is common for the large majority of small businesses reporting financial or operational challenges cited earlier. Use payback alongside NPV and IRR, never as your only decision metric.
Worked Example: Base Case vs. Scenario Analysis
Numbers make this concrete. Here is a full worked example using a $100,000 investment with a 10% discount rate.
Base Case: $100k Investment, 5-Year Cash Flows ($30k, $40k, $50k, $40k, $30k)
Enter Year 0 as -$100,000, then Years 1-5 as $30,000, $40,000, $50,000, $40,000, and $30,000. At a 10% discount rate:
- NPV = $43,844 (positive, so the investment creates value)
- IRR = 25.7% (well above a typical 10% hurdle rate)
- Simple payback = approximately 2.6 years
- Discounted payback = approximately 3.1 years
Scenario: 20% Lower Revenue
Now cut every year’s cash flow by 20% to model a downside case: $24,000, $32,000, $40,000, $32,000, and $24,000 against the same -$100,000 initial investment. At the same 10% discount rate:
- NPV = $15,076 (still positive, but far less cushion)
- IRR = 15.7% (still above the hurdle rate, but the margin is much thinner)
- Simple payback stretches to approximately 3.1 years
- Discounted payback stretches to approximately 4.0 years
The investment still clears the bar under the downside scenario, but the margin for error shrinks considerably. This is exactly why Step 3’s common mistake, “not testing scenarios,” can turn a genuinely marginal deal into a costly surprise.
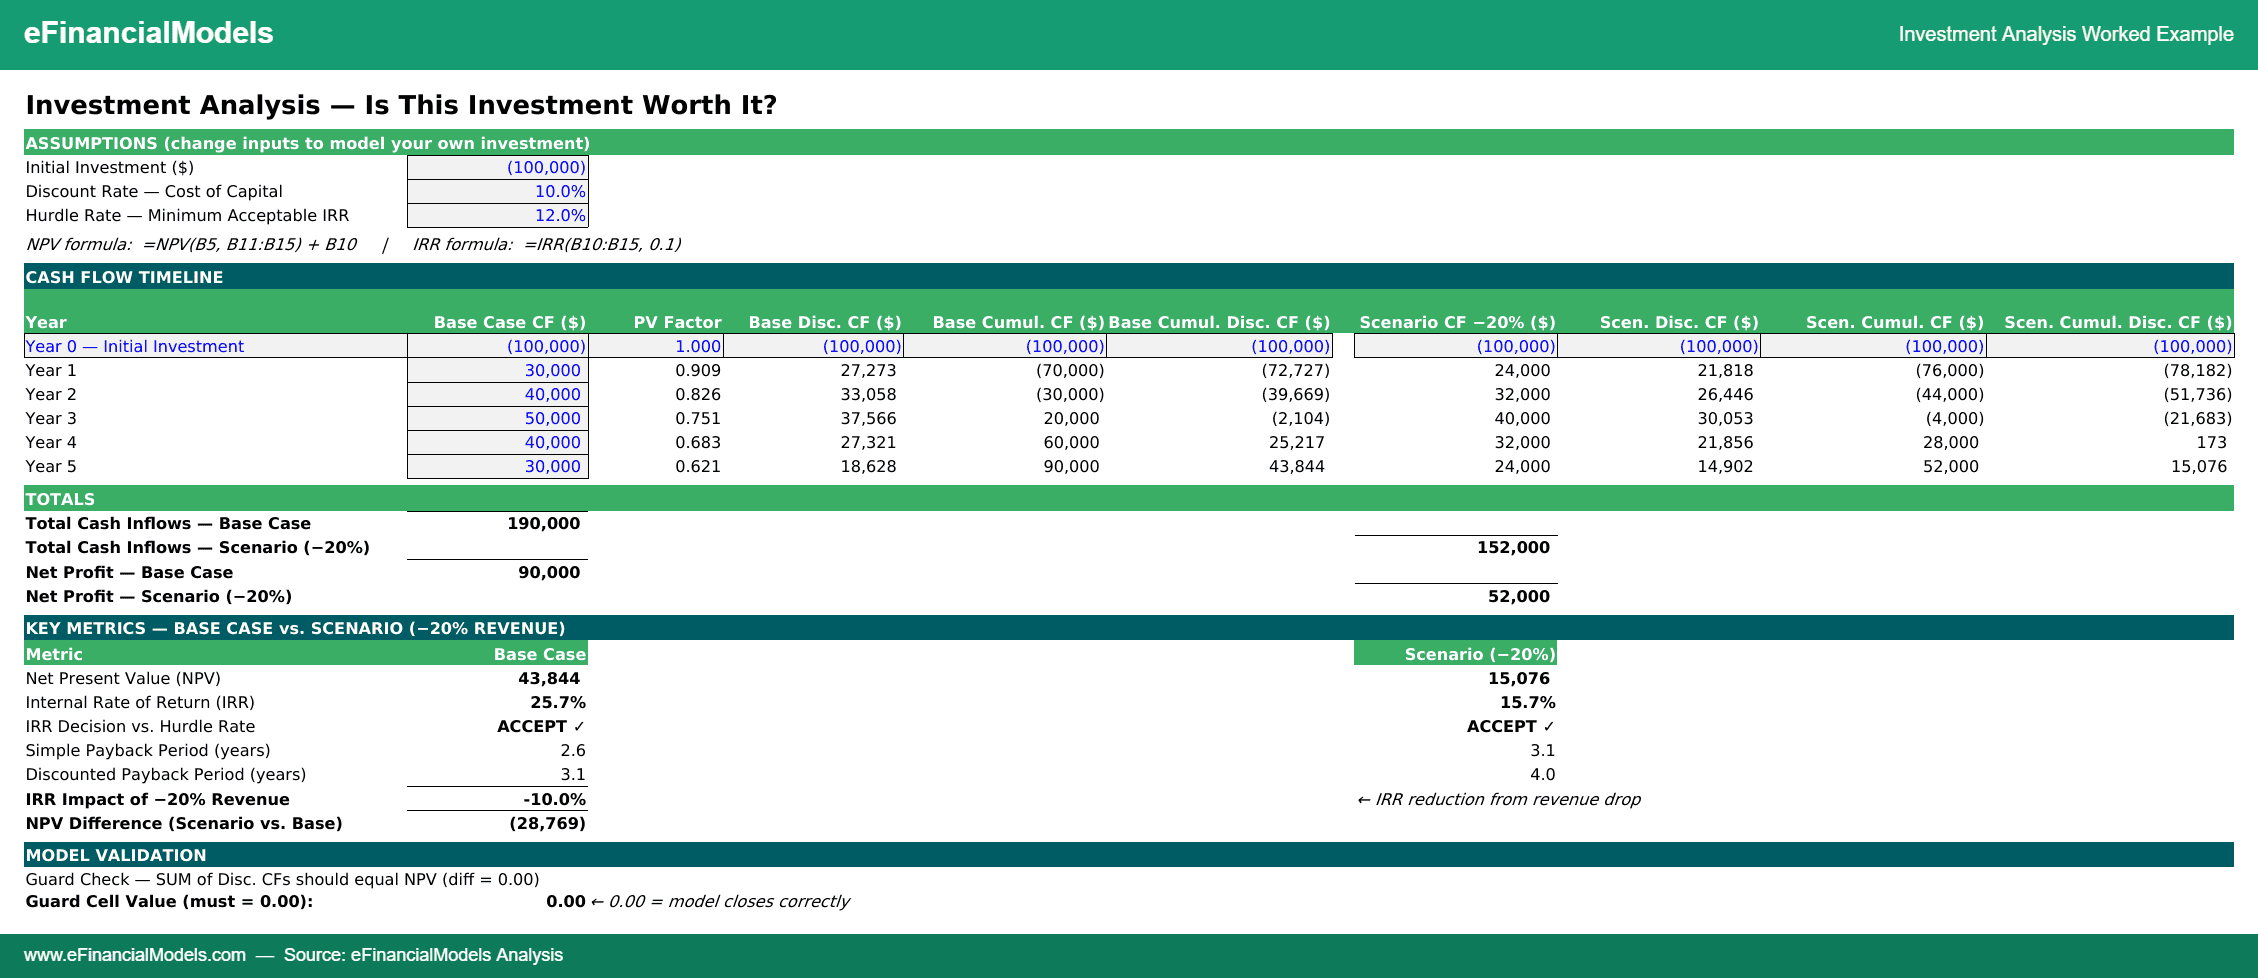
Investment Analysis: Base Case ($100k initial, 5-year cash flows) vs. −20% Revenue Scenario. Base NPV = $43,844 (IRR 25.7%); Scenario NPV = $15,076 (IRR 15.7%). Guard cell confirms model closure at 0.00 — Source: eFinancialModels Analysis
Excel Formulas in Action (screenshots/formula text)
The screenshot above shows the exact formulas driving both cases: =NPV(0.10,B3:B7)+B2 for NPV, =IRR(B2:B7) for IRR, and a cumulative-cash-flow row for payback. A guard cell cross-checks that the discounted cash flows sum to zero at the IRR rate, confirming the model closes correctly with no formula errors.
Comparison Table: Investment Analysis Methods
| Method | What It Measures | Pros | Cons |
|---|---|---|---|
| NPV | Dollar value created above required return | Accounts for size and timing of all cash flows; single most reliable “worth it” answer | Requires an accurate discount rate assumption |
| IRR | Annualized percentage return | Intuitive, easy to compare against a hurdle rate | Can mislead when comparing projects of different sizes; multiple IRRs possible with non-standard cash flows |
| Payback Period (Simple) | Years until cash flow turns positive | Simple, fast liquidity check | Ignores cash flows after payback and ignores time value of money |
| Payback Period (Discounted) | Years until discounted cash flow turns positive | Same liquidity check, adjusted for time value of money | Still ignores cash flows after payback |
| ROI | Total return as a percentage of initial cost | Simple to calculate and explain | Ignores timing entirely, so two very different investments can show the same ROI |
| Profitability Index | NPV per dollar invested | Useful for ranking projects when capital is limited | Less intuitive than NPV alone; rarely used on its own |
Common Mistakes in Investment Analysis (5 to Avoid)
- Using the Wrong Discount Rate. Applying a generic 10% to every project regardless of risk overstates the value of risky investments and understates safe ones. Fix: set the discount rate based on the specific risk profile of the investment, not a company-wide default.
- Ignoring Terminal Value. Cutting off the analysis after five years without accounting for cash flows the investment will keep generating afterward undervalues long-lived assets. Fix: add a terminal value estimate for investments with a useful life beyond your projection window, or extend the projection if the asset’s life is well understood.
- Over-optimistic Cash Flow Projections. Assuming revenue ramps perfectly and costs never rise is the single fastest way to greenlight a bad investment. Fix: build a base case from historical performance, not aspiration, and always run a downside scenario like the one above.
- Neglecting Working Capital. Growth investments often require more inventory or receivables, which ties up cash the simple cash flow line misses. Fix: add a working-capital line item to Year 0 and any year where the business scales up.
- Not Testing Scenarios. Running only a single base case hides how fragile the decision really is. Fix: always run at least one downside scenario, as shown above, before committing capital; if the investment still clears your hurdle rate under a 15-20% revenue cut, you have real confidence in the decision. Anchoring this in a validated model matters: a 7-step accuracy toolkit can catch the formula errors that otherwise slip into a scenario analysis unnoticed.
Tools & Templates for Investment Analysis
You do not need to build an investment analysis model from scratch every time you face a new decision. A structured template with the NPV, IRR, and payback formulas already wired up saves hours and reduces the risk of a formula error slipping through.
EFM’s Investment Analysis Excel Template
A ready-built template lets you drop in your own cash flow assumptions and immediately see NPV, IRR, and payback for both a base case and a downside scenario, the same structure used in the worked example above. Browse EFM’s full template library for investment analysis and related templates.
Other Financial Modeling Software
Beyond Excel, dedicated financial modeling platforms offer built-in scenario tools, version control, and collaboration features. More vendors now offer dedicated financial modeling platforms than five years ago, reflecting how many businesses are moving beyond static spreadsheets for this kind of analysis. If you are evaluating whether to move off Excel entirely, this comparison of 8 financial modeling platforms benchmarks the leading options.
When to Use a Custom Model vs. Template
A custom-built financial model typically costs between $10,000 and $50,000 depending on complexity, according to EFM Financial Modeling Services, so a template makes financial sense for standard investment decisions like equipment purchases, expansions, or new product launches. Reserve a custom build for genuinely unique situations, such as a multi-entity acquisition with complex financing, where the acquisition modeling playbook walks through the added complexity a standard template will not cover. For a full breakdown of when the cost of a custom build is justified, see this comparison of a $50 template versus a $50k custom build.
Frequently Asked Questions
What discount rate should I use?
Most small businesses use a discount rate between 8% and 15%, based on their cost of debt, the return owners expect on equity, and a risk premium reflecting how uncertain the specific investment’s cash flows are. A safer investment, like replacing existing equipment with a known output, justifies a lower rate near 8-10%. A riskier investment, like entering a new market, justifies a higher rate near 12-15% because the cash flow projections carry more uncertainty. Setting the rate too low makes marginal investments look attractive; setting it too high can cause you to reject genuinely good opportunities.
Is NPV or IRR better?
NPV is generally the more reliable metric because it shows the actual dollar value created and accounts for both the size and timing of every cash flow, while IRR only shows a percentage return that can be misleading when comparing investments of very different sizes. That said, IRR is more intuitive to communicate, since comparing a 25.7% return against a 10% hurdle rate is an easy sentence for a stakeholder to understand. The best practice is to calculate both: use NPV to confirm the investment creates value, and use IRR to see the margin above your hurdle rate.
How far out should I project cash flows?
Project cash flows for as long as you can reasonably estimate them with confidence, which for most small business investments is 3 to 5 years. Projecting further out, such as 10 years, introduces so much uncertainty in revenue and cost assumptions that the numbers become guesses rather than forecasts. If the investment has a useful life well beyond your projection window, such as a piece of equipment expected to last 10 years, add a terminal value at the end of the explicit projection rather than trying to project every individual year.
Can I use this for real estate investments?
Yes, the same NPV, IRR, and payback framework applies directly to real estate: rental income and eventual sale proceeds become the cash flows, and the purchase price plus closing costs and any renovation becomes the Year 0 investment. Real estate analysis typically adds a terminal value representing the property’s sale price at the end of the holding period, since the property itself retains value beyond the annual cash flows. If the real estate purchase is structured as an acquisition of an existing income-producing business, the acquisition modeling playbook covers the added financing and deal-structure considerations a straightforward property purchase does not need.
What if my cash flows are irregular?
Excel’s =NPV and =IRR functions handle irregular cash flow amounts across periods without any special adjustment, since each period’s value is entered independently. If your cash flows arrive at irregular time intervals rather than regular annual periods, use =XNPV(rate, values, dates) and =XIRR(values, dates, guess) instead, which account for the actual number of days between each cash flow rather than assuming equal annual periods. This distinction matters most for investments with lump-sum payments or seasonal revenue patterns.
How do I account for inflation?
You can handle inflation in one of two consistent ways: either project cash flows in nominal (inflated) dollars and use a nominal discount rate that includes an inflation premium, or project cash flows in real (today’s-dollar) terms and use a real discount rate with inflation stripped out. The critical rule is consistency: mixing a nominal discount rate with real cash flows, or vice versa, will distort your NPV and IRR results. For most small business investment analysis, using nominal cash flows and a nominal discount rate is simpler and more common.
What’s the difference between simple and discounted payback?
Simple payback period counts the raw cash flow each year until the cumulative total turns positive, with no adjustment for the time value of money. Discounted payback period applies the same logic but uses each year’s present value instead of its raw amount, which means it always takes at least as long as simple payback and gives a more conservative liquidity picture. In the worked example above, simple payback of 2.6 years stretches to a discounted payback of 3.1 years once the time value of money is applied, a meaningful difference when cash timing matters to your decision.
I recommend starting with a validated template rather than a blank spreadsheet: it removes the formula-error risk that undermines an otherwise sound analysis and lets you focus on getting your assumptions right. Start from the EFM homepage to explore the full investment analysis template library.























































Structured Data (JSON-LD for publishing)


