
0 ITEMS

Financial Model Selection Checklist: 5 Scenarios Mapped

Choosing the wrong financial model type doesn’t just waste time — it can sink a financing application or stall a deal. This checklist maps your specific funding scenario to the right model structure, with clear decision criteria for the post-2023 credit environment.
Key Takeaways
- The Federal Reserve raised the federal funds rate to a 23-year high of 5.25–5.50% in 2023, forcing lenders to demand more rigorous cash flow documentation than in the low-rate era.
- A 3-statement integrated model (income statement, balance sheet, and cash flow statement linked together) is required for debt financing above $500K and all M&A transactions — a standalone cash flow projection is not sufficient.
- Venture capital investment fell to $170.6 billion in 2023, down 35% from 2022, meaning equity investors now scrutinize unit economics and runway models more closely than ever.
- Lenders tightened standards on commercial and industrial loans in 14 consecutive quarters through 2024, per Federal Reserve Senior Loan Officer surveys — your model must address debt service coverage ratio (DSCR) explicitly.
- Pre-revenue startups can start with a 13-week cash flow model, but must upgrade to a 3-statement model before a Series A raise.
- Red flags that signal the wrong model choice include missing a balance sheet when applying for a bank loan, or building a 5-year integrated model for a 90-day bridge financing request.
- EFM’s categorized templates cut model build time by matching your use case to a pre-structured framework — see the financial modeling templates library.
Why Model Selection Matters More in 2023–2026
The credit environment between 2023 and 2026 fundamentally changed what financial models lenders and investors will accept. The Federal Reserve’s rate hiking cycle pushed the federal funds rate from near zero in early 2022 to 5.25–5.50% by July 2023, the highest level since 2001. That shift made debt service more expensive and lenders more selective — a simple spreadsheet that passed muster in 2021 now gets rejected at the first underwriting review.
At the same time, venture capital dried up. According to PitchBook-NVCA data, U.S. venture capital investment totaled $170.6 billion in 2023, a 35% decline from the $261.6 billion deployed in 2022. Investors who once funded on a pitch deck now require detailed unit economics, cohort analysis, and 24-month runway projections before writing a check.
The Federal Reserve’s Senior Loan Officer Opinion Survey (SLOOS) showed that a net 50.8% of banks tightened standards on commercial and industrial loans in Q2 2023, the sharpest tightening since the 2008 financial crisis outside of the COVID shock. That single data point explains why model selection is now a strategic decision, not an administrative one.
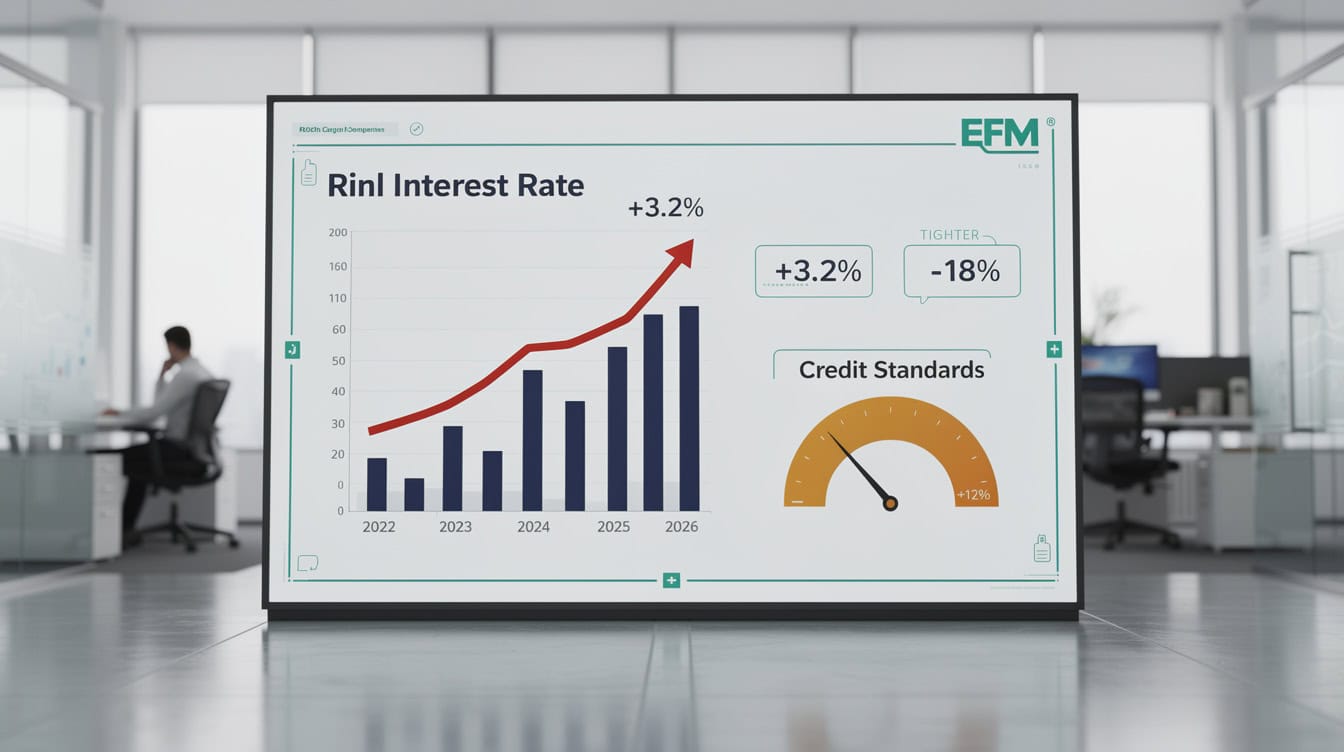
Three converging forces — rate hikes, VC contraction, and bank tightening — raised the bar for financial model quality between 2023 and 2026.
The Core Question: 3-Statement Model vs. Cash Flow Projection
A 3-statement integrated model links the income statement, balance sheet, and cash flow statement so that every assumption flows through all three outputs automatically. A standalone cash flow projection (also called a direct or indirect cash flow forecast) shows only cash inflows and outflows over a defined period, without a linked balance sheet or P&L.
Use a 3-statement model when your stakeholder needs to assess solvency, covenant compliance, or enterprise value. Use a standalone cash flow projection when your stakeholder only needs to verify you won’t run out of cash in the next 13 to 52 weeks.
The answer changed post-2023 because lenders now routinely request balance sheet stress tests alongside cash flow projections. A standalone model can no longer satisfy a bank’s credit committee for loans above $500K. For a deeper breakdown of these two structures, see the EFM guide on the two basic structures of financial models.
| Criterion | 3-Statement Model | Cash Flow Projection |
|---|---|---|
| Build time | 40–120 hours | 8–20 hours |
| Stakeholder | Lenders, PE, M&A | Internal, bridge lenders |
| Time horizon | 3–10 years | 13 weeks–2 years |
| Balance sheet | Included | Excluded |
| Valuation ready | Yes (DCF-linkable) | No |
| Best for stage | Growth to mature | Pre-revenue to early |
| Post-2023 lender fit | Required >$500K | Acceptable <$500K |
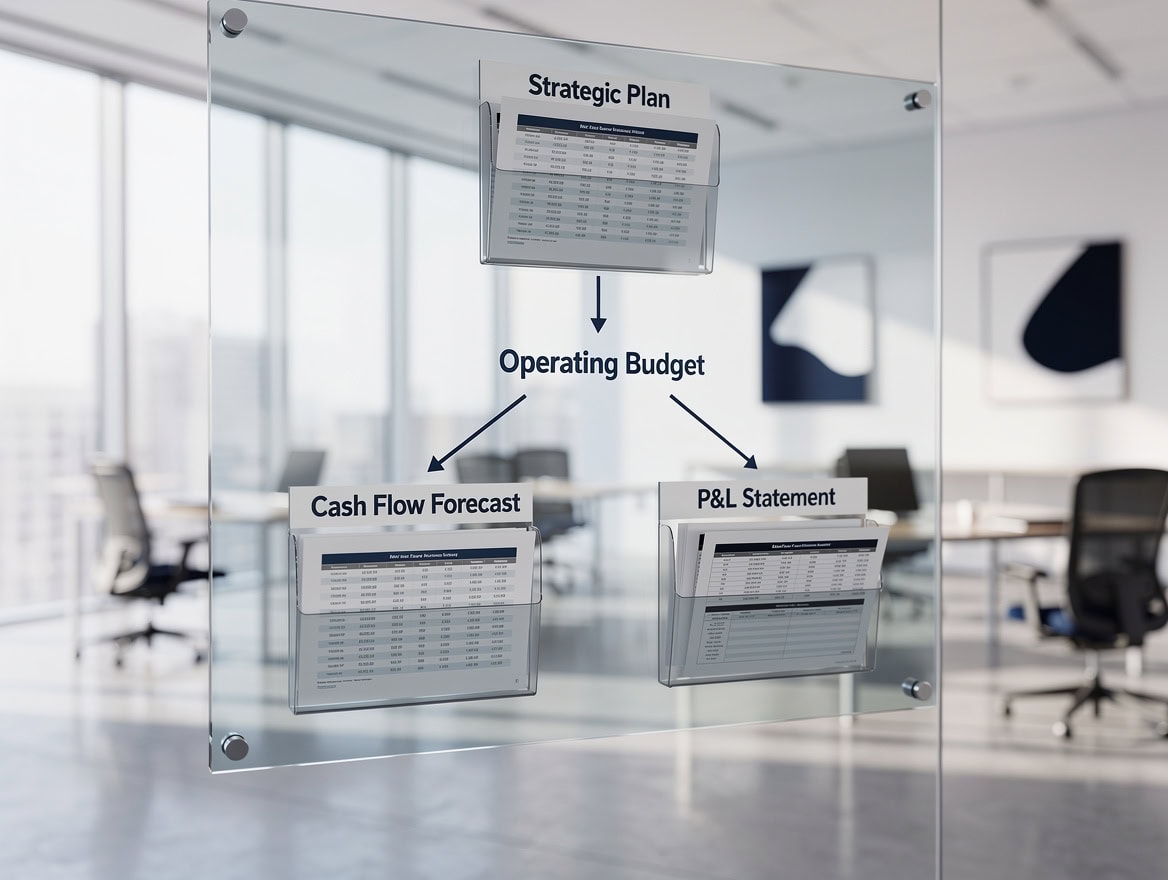
A 3-statement model links all three financial statements automatically — a standalone cash flow projection shows only cash movement without balance sheet or P&L context.
Checklist Section 1: Debt Financing and Lender Requirements
For any bank loan, SBA loan, or private credit facility, lenders require a model that demonstrates debt service coverage ratio (DSCR), defined as net operating income divided by total debt service. A DSCR below 1.25x will typically trigger a loan denial regardless of how polished the model looks.
Use this checklist before submitting to a lender:
- Model type required: 3-statement integrated model, minimum 3-year projection.
- DSCR calculation: Show DSCR explicitly on a summary tab. Target 1.25x or higher for most commercial lenders.
- Interest rate assumption: Use current market rates, not 2021 rates. For floating-rate debt, include a sensitivity table showing DSCR at +100bps and +200bps.
- Covenant schedule: If the loan includes financial covenants (leverage ratio, current ratio), model them as live outputs that update with assumptions.
- Collateral schedule: Include a balance sheet that shows asset values supporting the loan.
- SBA 7(a) specifics: The SBA requires 3 years of historical financials plus 3 years of projections for loans above $350,000. Additionally, the SBA 7(a) program can guarantee loans up to $5 million, making it the agency’s primary program for businesses seeking substantial debt financing.
For pre-built frameworks, the financial debt models on EFM include DSCR calculators and covenant tracking tabs.

Lenders require a DSCR of at least 1.25x — model it explicitly on a summary tab, with sensitivity to rate increases of 100 and 200 basis points.
Checklist Section 2: Equity Raises (VC, PE, Strategic)
Equity investors evaluate models differently from lenders. They care about return on invested capital, exit multiples, and the path to profitability — not just whether you can service debt. The right model structure depends on your stage and investor type.
Venture Capital (Seed to Series B):
- Build a bottom-up revenue model showing customer acquisition cost (CAC), lifetime value (LTV), and monthly active user growth.
- Include a 24-month cash runway table. Investors want to see exactly when you hit zero without the next round.
- A standalone cash flow model is acceptable at Seed. A 3-statement model is expected at Series A and beyond.
- Show a cap table with dilution scenarios for the proposed round.
Private Equity (Growth and Buyout):
- A full 5-year 3-statement model is non-negotiable. PE firms will rebuild it anyway, but submitting without one signals inexperience.
- Include an LBO (leveraged buyout) returns analysis showing IRR and MOIC (multiple on invested capital) at various entry and exit multiples.
- Model working capital in detail — PE firms routinely find value or risk in receivables and inventory cycles.
Strategic Investors (Corporate M&A):
- Focus on synergy modeling: revenue synergies, cost synergies, and integration costs shown separately.
- A 10-year horizon is common for strategic deals. Use 10-year financial projections templates to structure the long-range view.

VC investors focus on runway and unit economics; PE firms require full LBO analysis; strategic buyers want synergy models with integration cost timelines.
Checklist Section 3: M&A Due Diligence and Valuation
M&A transactions require the most comprehensive model type of any scenario. Both buy-side and sell-side advisors expect a 3-statement model with an integrated DCF valuation, comparable company analysis (comps), and a transaction summary.
Key checklist items for M&A:
- DCF model: Discount free cash flows at the weighted average cost of capital (WACC). WACC is the blended cost of equity and debt, weighted by their proportions in the capital structure. In a high-rate environment, WACC inputs have risen materially — use current risk-free rates, not pre-2022 benchmarks.
- Terminal value: Use both the Gordon Growth Model and the exit multiple method. Show sensitivity of enterprise value to WACC and terminal growth rate in a two-variable data table.
- Synergy model: Quantify synergies with a timeline. Buyers discount synergies that take more than 3 years to realize.
- Purchase price allocation (PPA): Model goodwill and intangible asset amortization if the deal is structured as an asset purchase.
- Quality of earnings (QoE) adjustments: Normalize EBITDA for one-time items before applying valuation multiples.
Explore EFM’s DCF model templates for pre-structured M&A valuation frameworks.
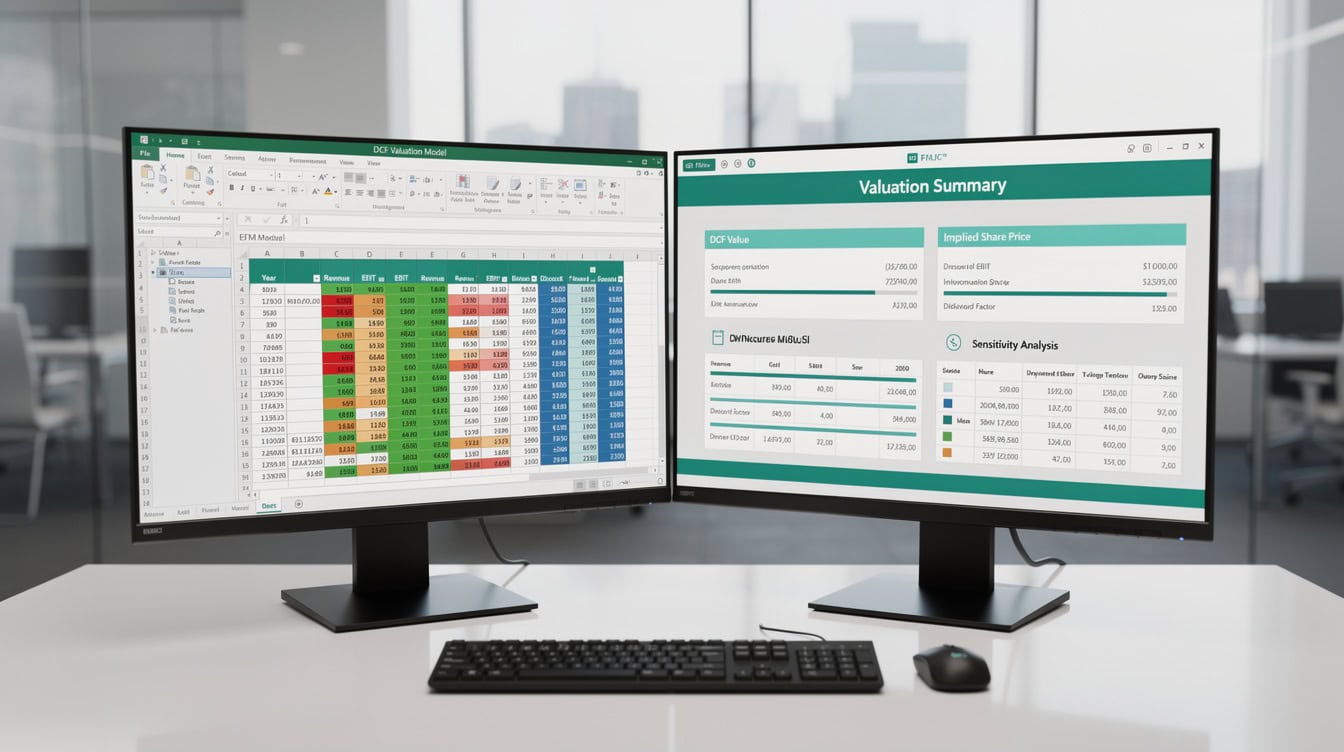
M&A models require four integrated components — DCF, comparable company analysis, synergy modeling, and a transaction summary — all linked to a single enterprise value output.
Checklist Section 4: Internal Planning and Scenario Analysis
Internal planning models serve a different master than external financing models. The audience is your own leadership team, and the goal is decision support, not stakeholder approval. That means you can trade some structural rigor for speed and scenario flexibility.
For internal planning, use this decision framework:
- Annual budget: A 3-statement model with monthly granularity for the current year and annual for years 2–5. Link to your chart of accounts.
- Rolling forecast: A 13-week cash flow model updated weekly. This is your operational early-warning system.
- Scenario analysis: Build at least 3 scenarios (base, upside, downside) with a toggle or dropdown that switches all assumptions simultaneously. A model that requires manual edits to switch scenarios is a red flag.
- KPI dashboard: Attach a one-page summary showing 8–12 key performance indicators that update automatically from the model.
For financial planning templates that include scenario toggles, EFM’s general model library covers both annual budget and rolling forecast structures.

Internal planning models need a scenario toggle that switches all assumptions simultaneously — manual cell edits across 40 cells under time pressure guarantee errors.
Model Selection by Company Stage and Complexity
Your company’s stage determines the minimum viable model complexity. Building a 10-year integrated model for a pre-revenue startup wastes resources and produces unreliable outputs. Building only a cash flow projection for a $50M revenue business seeking a credit facility will get your application rejected.
Worked Example: Matching Stage to Model
Consider three companies, each seeking $2M in capital:
- Company A is pre-revenue, 6 months old, raising a Seed round. The right model is a 24-month cash flow projection with a bottom-up revenue build and a cap table. Build time: approximately 15 hours. A 3-statement model adds false precision at this stage.
- Company B has $3M in annual recurring revenue (ARR) and is raising a Series A. The right model is a 3-statement model with 3-year monthly projections, cohort analysis, and a unit economics summary. Build time: approximately 60 hours. Investors at this stage will reject a cash-only model.
- Company C is a $40M revenue manufacturer seeking a $2M equipment loan from a regional bank. The right model is a 3-statement model with 5-year annual projections, a DSCR schedule, and a collateral summary. Build time: approximately 40 hours. The bank’s credit committee requires the balance sheet to assess collateral coverage.
Here’s the math for Company C’s DSCR check: Net operating income of $1.8M divided by annual debt service of $420K (principal plus interest on the $2M loan at 7.5% over 7 years) equals a DSCR of 4.3x — well above the 1.25x threshold. That single calculation, shown clearly on a summary tab, is what gets the loan approved.
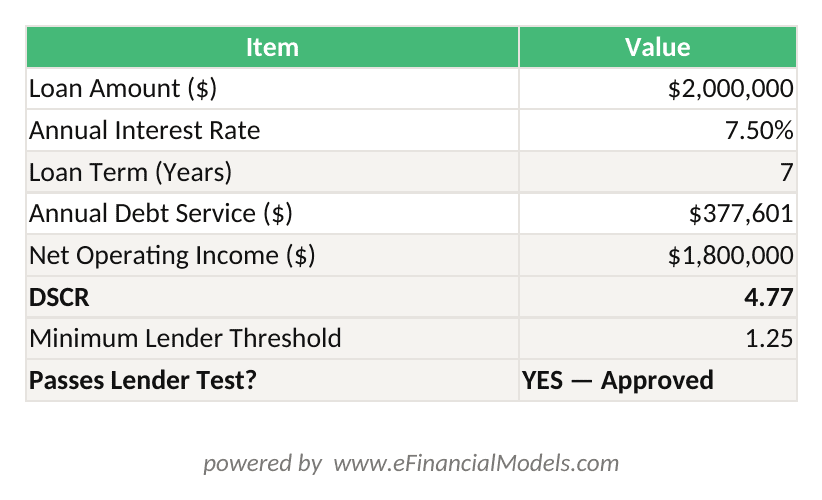
DSCR = Net Operating Income / Annual Debt Service. At 7.5% over 7 years, a $2M loan requires $420K in annual debt service — Company C’s $1.8M NOI produces a 4.3x DSCR, well above the 1.25x lender threshold.

Model complexity must match company stage — a 10-year integrated model for a pre-revenue startup produces unreliable outputs and signals inexperience to investors.
Red Flags: Signs You’ve Chosen the Wrong Model Type
The wrong model type produces predictable failure modes. Recognizing them early lets you course-correct before a lender or investor rejects your submission.
Red Flag 1: No balance sheet in a bank loan application. Fix: Upgrade to a 3-statement model. A cash flow projection alone cannot show asset coverage or covenant compliance.
Red Flag 2: A 5-year model for a 90-day bridge loan. Fix: Build a 13-week direct cash flow model instead. Lenders for short-term facilities want weekly cash visibility, not long-range projections.
Red Flag 3: Revenue assumptions not tied to drivers. If your revenue line is a single growth percentage with no underlying driver logic (units sold, price per unit, conversion rate), investors will not trust it. Fix: Build a bottom-up revenue model with explicit assumptions for each driver.
Red Flag 4: Circular references in the interest expense calculation. A circular reference (where a formula refers back to itself) occurs when interest expense depends on the debt balance, which depends on cash, which depends on net income, which includes interest expense. Fix: Use an iterative calculation setting in Excel or break the circularity with a prior-period debt balance. Excel supports up to 100 iterations when the iterative calculation feature is enabled under File > Options > Formulas, giving modelers fine-grained control over circular reference resolution.
Red Flag 5: Scenarios require manual cell edits. If switching from base to downside requires changing 40 cells manually, your model will produce errors under time pressure. Fix: Build a single assumption input sheet with a scenario toggle that drives all outputs.
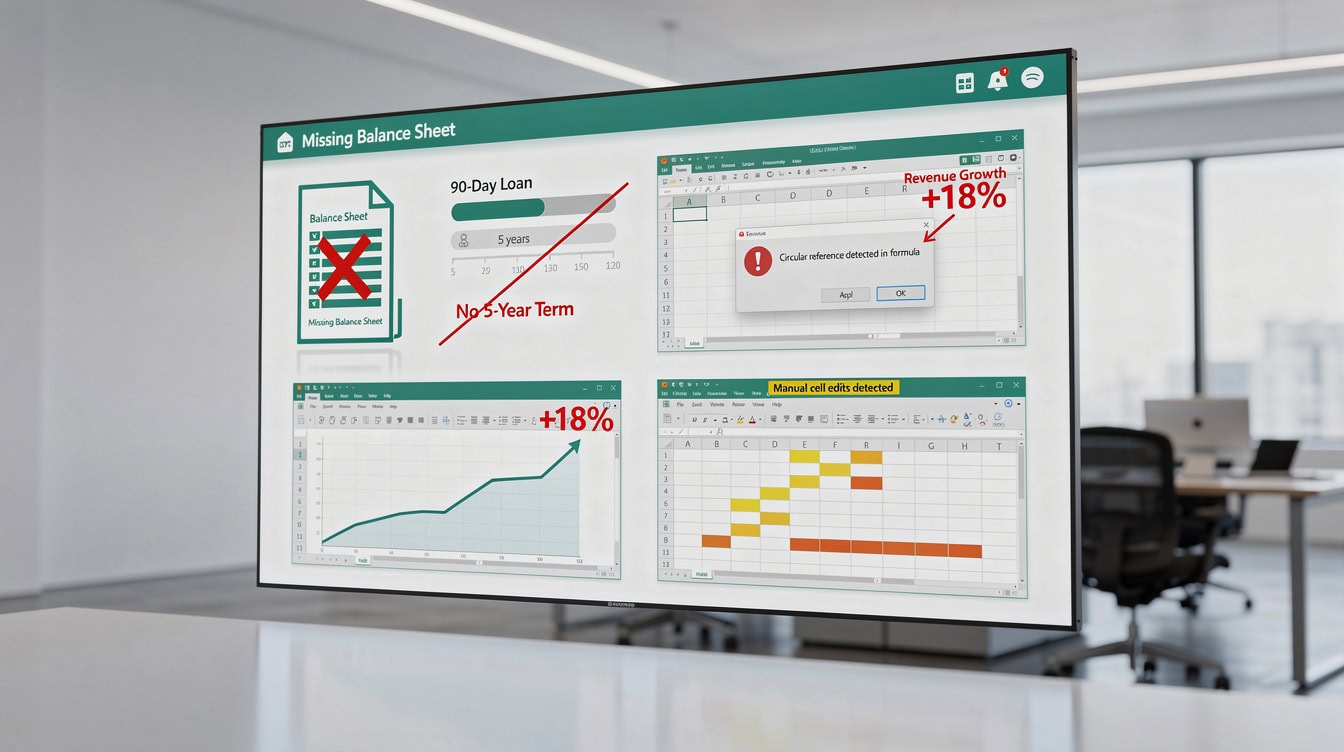
Circular references in interest expense calculations are one of the most common model errors — fix them with Excel’s iterative calculation setting or a prior-period debt balance.
Integrating Your Selection with the Two Basic Structures
Every financial model, regardless of complexity, is built on one of two foundational structures: the integrated 3-statement model or the standalone cash flow projection. Understanding which structure you’re building on — before you add any complexity — prevents the most common modeling errors.
The two basic structures of financial models framework gives you the architectural foundation. Once you’ve selected your structure using the checklist above, layer in the additional components your use case requires: a DCF for M&A, a DSCR schedule for debt, a cap table for equity, or a KPI dashboard for internal planning.
The sequencing matters. Build the core structure first, verify it balances (the balance sheet must balance to zero), then add the use-case-specific layers. Reversing this order — adding complexity before the core structure is solid — is the single most common cause of model errors that take days to debug.
For startup financial models that follow this layered approach, EFM’s startup category includes pre-revenue and early-stage templates built on the cash flow foundation with optional 3-statement upgrade paths.
Build the core structure first and verify it balances before adding use-case layers — reversing this order is the single most common cause of multi-day debugging sessions.
Frequently Asked Questions
Do I really need a 3-statement model for a small bank loan?
For loans above $500,000, yes — most commercial lenders require it. A 3-statement model (income statement, balance sheet, and cash flow statement linked together) lets the bank’s credit committee calculate your debt service coverage ratio, assess collateral on the balance sheet, and check covenant compliance. For loans below $500,000, some community banks and credit unions will accept a 2-year cash flow projection plus 2 years of historical tax returns. The SBA’s 7(a) program requires 3 years of projections for loans above $350,000, per published SBA guidelines. If you’re unsure, ask your loan officer what their credit committee requires before building anything.
How long should my financial model projections be?
The right projection length matches your stakeholder’s decision horizon. For a 5-year equipment loan, build 5 years of projections. For a Series A equity raise, 3 years of monthly projections is standard. For an M&A transaction, 5 to 10 years is typical, with a terminal value capturing value beyond the explicit forecast period. For internal planning, a rolling 13-week cash flow model plus a 12-month annual budget covers most operational needs. Building projections longer than your stakeholder’s decision horizon adds false precision and invites skepticism — a 10-year revenue forecast for a pre-revenue startup will not be taken seriously by any sophisticated investor.
What is DSCR and why do lenders care about it so much in 2024?
DSCR stands for debt service coverage ratio. It measures how many times your net operating income covers your annual debt payments (principal plus interest). The formula is: DSCR = Net Operating Income / Total Annual Debt Service. A DSCR of 1.0x means your income exactly covers your debt payments — no cushion. Most commercial lenders require a minimum DSCR of 1.25x, meaning your income must be 25% higher than your debt payments. In the post-2023 high-rate environment, higher interest rates mechanically reduce DSCR for any given income level, which is why lenders tightened standards so sharply. A business that had a 1.8x DSCR in 2021 at 4% interest might now show only 1.3x at 7.5% interest on the same income — still above the threshold, but with much less cushion.
Can I use the same model for both a bank loan and a VC pitch?
You can use the same underlying 3-statement model as the foundation, but you’ll need different output tabs for each audience. For the bank, the key outputs are DSCR, collateral coverage, and covenant compliance. For the VC, the key outputs are revenue growth rate, CAC/LTV ratio, cash runway, and return on invested capital. Building two separate models for the same business wastes time and creates version control problems. The better approach is one integrated 3-statement model with a bank summary tab and an investor summary tab, each pulling from the same assumptions sheet. This also ensures consistency — you can’t accidentally show different revenue numbers to different stakeholders.
What’s the fastest way to build a credible model under time pressure?
Start with a pre-built template matched to your use case, then customize the assumptions. Building from a blank spreadsheet under a 48-hour deadline produces models full of errors. A quality template from EFM’s financial model templates library gives you the correct structure, formula logic, and output formatting already in place. Your job then is to replace the placeholder assumptions with your actual numbers and verify that the balance sheet balances. For a debt financing model, focus first on the DSCR calculation and work backward to the assumptions that drive it. For an equity model, focus first on the cash runway calculation. Knowing your stakeholder’s key metric and building toward it is always faster than building a complete model and hoping the key metric looks good at the end.
How do I know if my revenue assumptions are credible?
A revenue assumption is credible when it’s built from the bottom up and each driver can be defended with data. For a SaaS business, that means: number of sales reps multiplied by average deals per rep per month multiplied by average contract value equals new ARR. For a retail business: foot traffic multiplied by conversion rate multiplied by average transaction value equals revenue. If your revenue line is just last year’s revenue times a growth percentage, any experienced investor or lender will ask you to justify the growth rate — and if you can’t point to a specific driver, the assumption looks like a guess. The Federal Reserve’s Beige Book and industry trade associations publish sector-specific growth benchmarks you can use to anchor your assumptions to observable market data.
When should I hire a financial modeler instead of building it myself?
Hire a professional modeler when the stakes of a modeling error exceed the cost of the modeler. For a $5M bank loan, a modeling error that causes a loan rejection costs far more than a $3,000–$8,000 professional model build. For an M&A transaction above $10M, the acquirer’s advisors will rebuild your model anyway — but submitting a flawed model signals poor financial management and can reduce your negotiating position. For internal planning models used only by your own team, building it yourself with a quality template is usually the right call. EFM’s custom financial modeling services offer professional builds for high-stakes situations where accuracy is non-negotiable.
Conclusion
Model selection is not a formatting decision — it’s a strategic one. The wrong model type in a bank loan application, an equity pitch, or an M&A process can cost you the deal entirely. In the post-2023 credit environment, where lenders are tighter and investors are more selective, the gap between an acceptable model and a rejected one has narrowed to a few structural choices: 3-statement vs. cash flow, monthly vs. annual, 3-year vs. 5-year, DSCR tab vs. no DSCR tab.
Use the checklist in this article to identify your use case, match it to the right model structure, and verify you’ve included the outputs your specific stakeholder requires. Then build on a solid foundation before adding complexity.
I recommend downloading EFM’s financial model templates matched to your specific scenario — whether that’s debt financing, an equity raise, M&A due diligence, or internal planning — and using the two basic structures framework as your architectural starting point before customizing for your use case.
























































