
0 ITEMS

Midstream Oil Refinery Financial Model 20 Year w/ DCF, Sensitivity Analysis, WACC, NPV & IRR
Build accurate, bank-ready financial projections for your Midstream Oil Refinery. Download our professional Excel template for feasibility and valuation analysis.

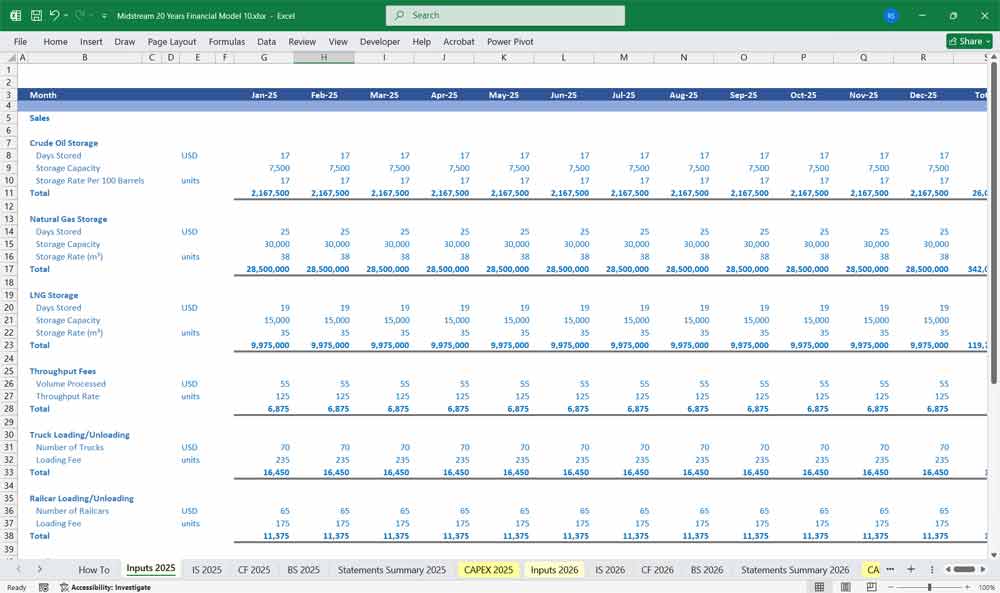
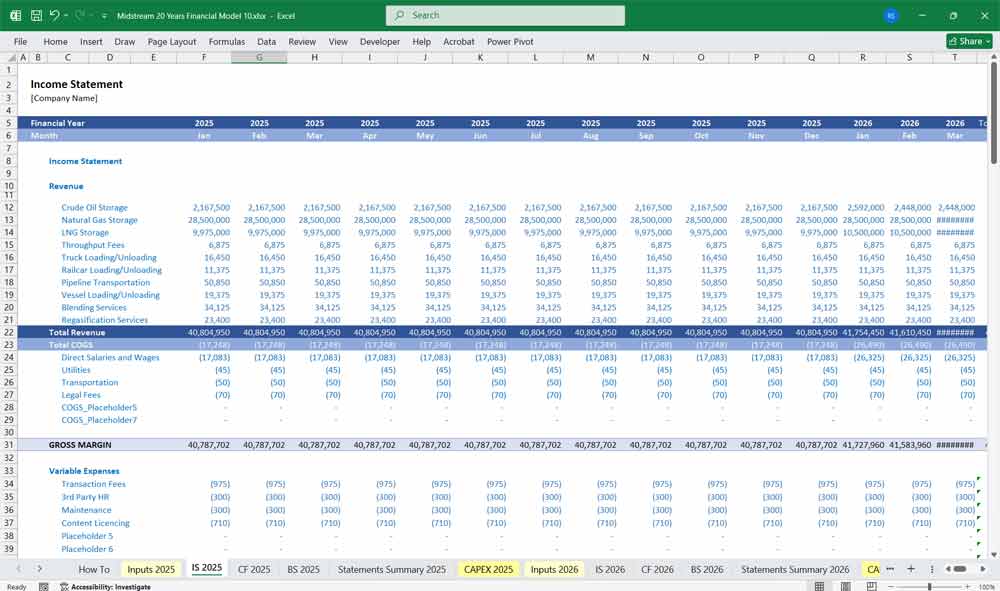
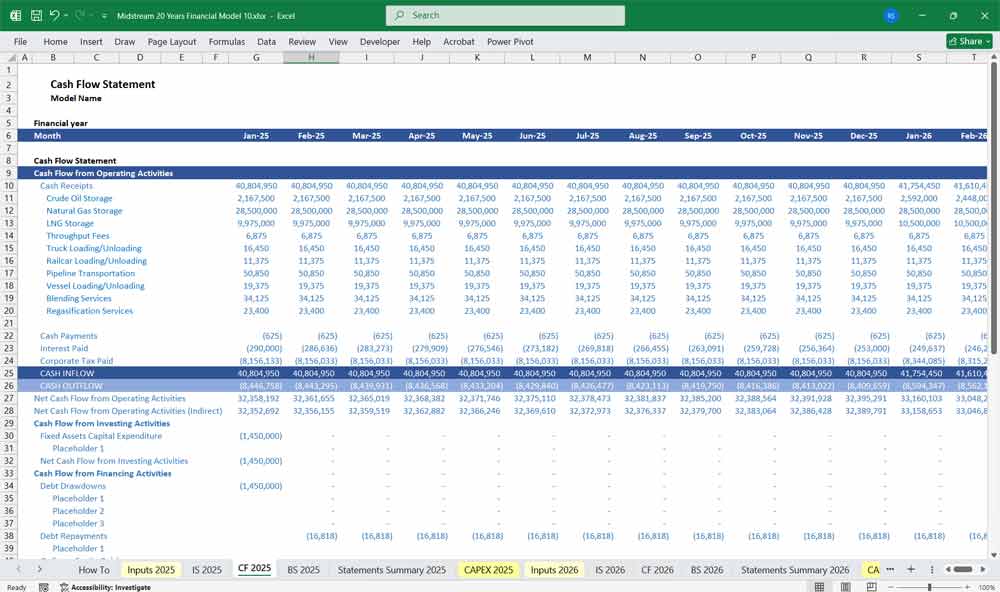
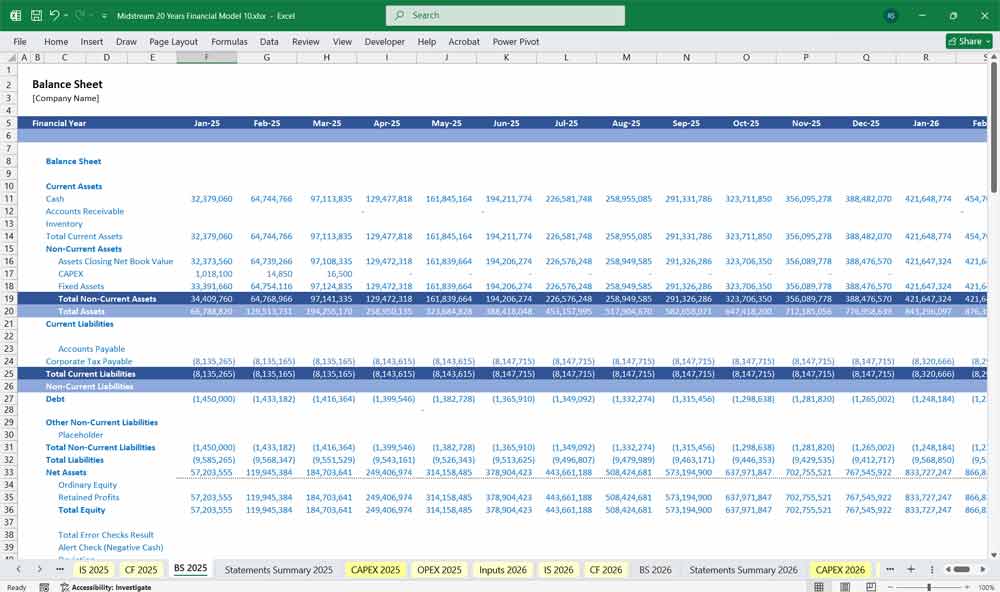
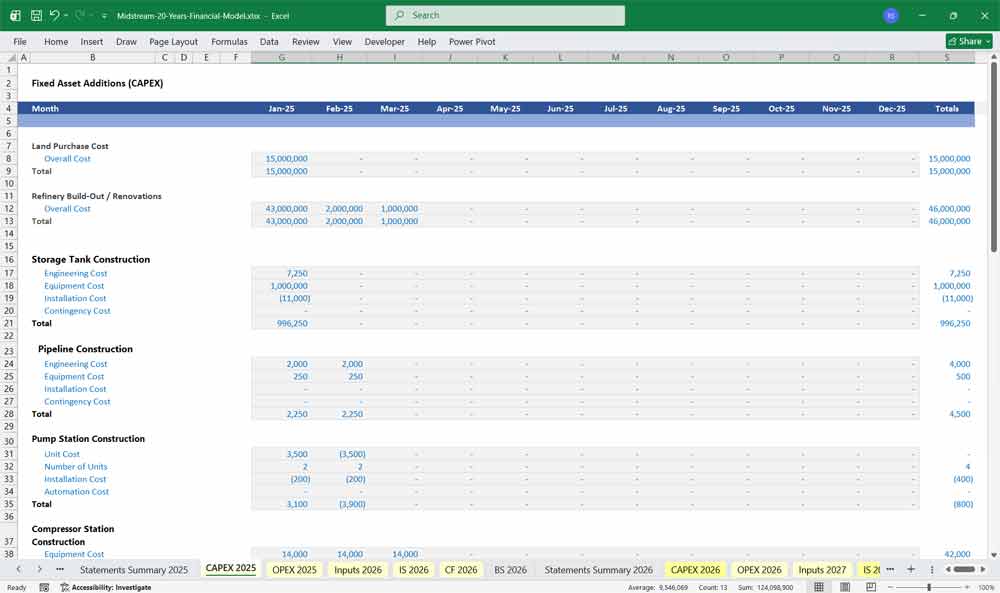
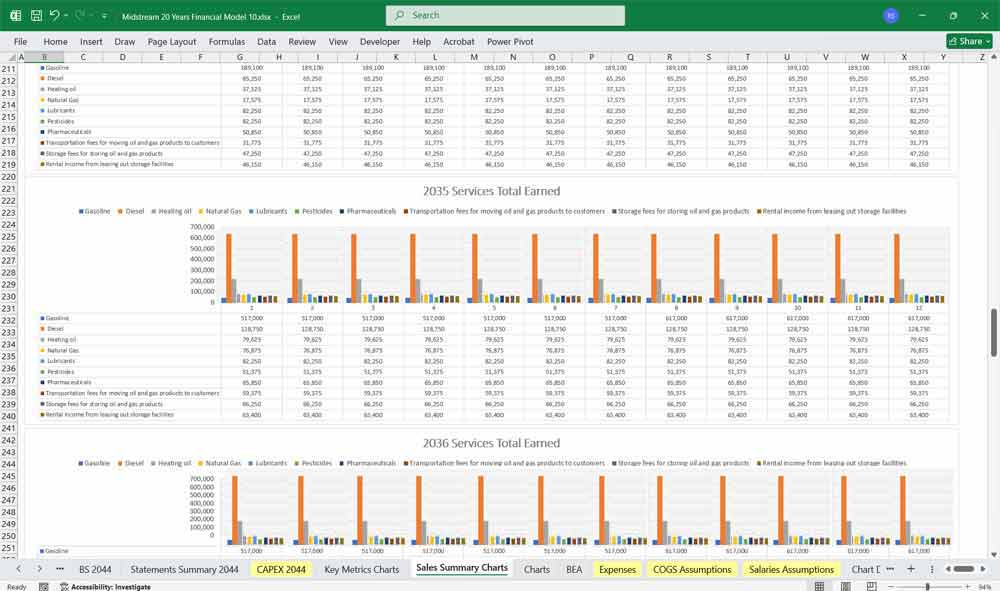
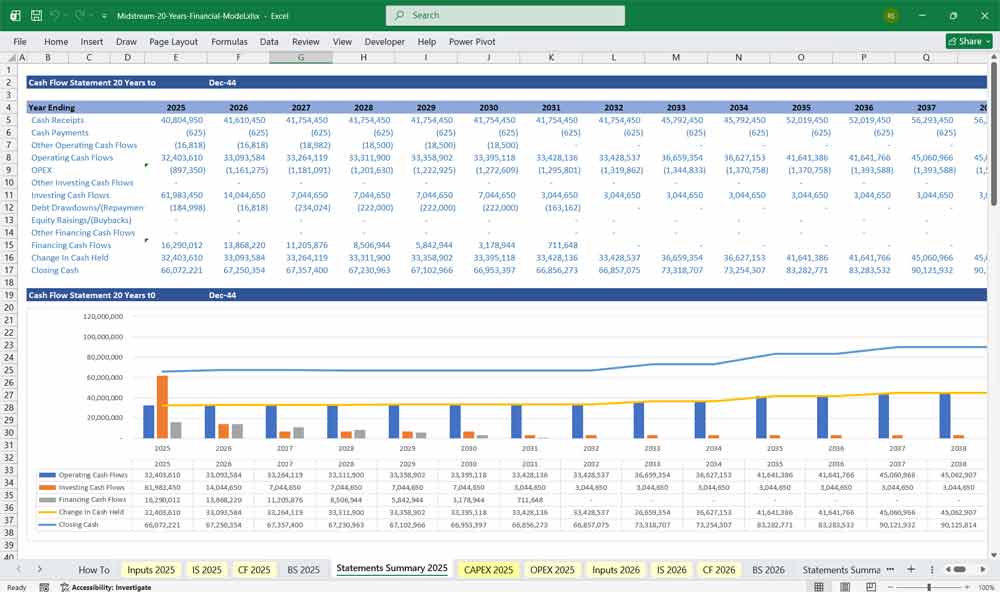
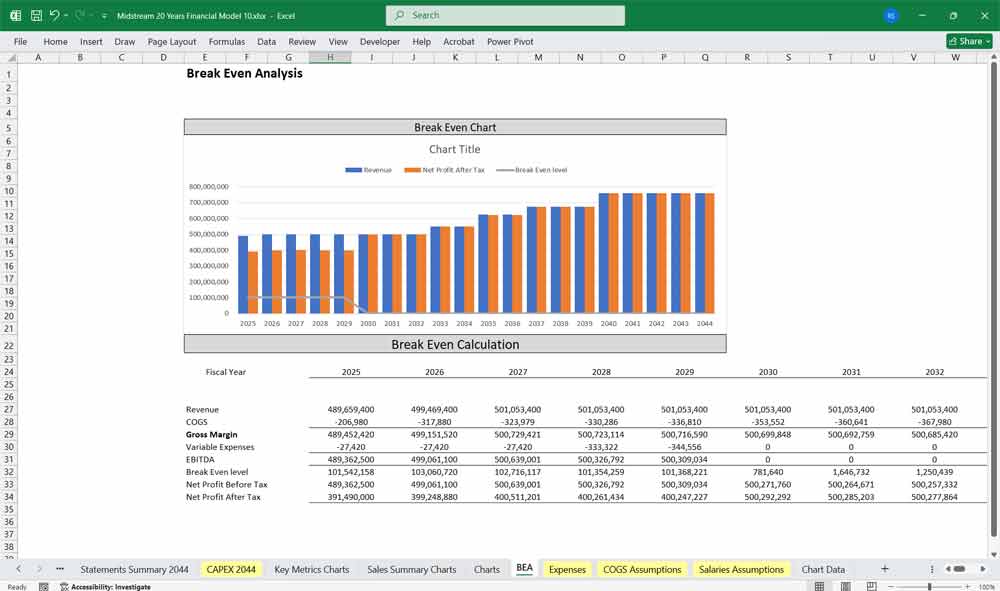
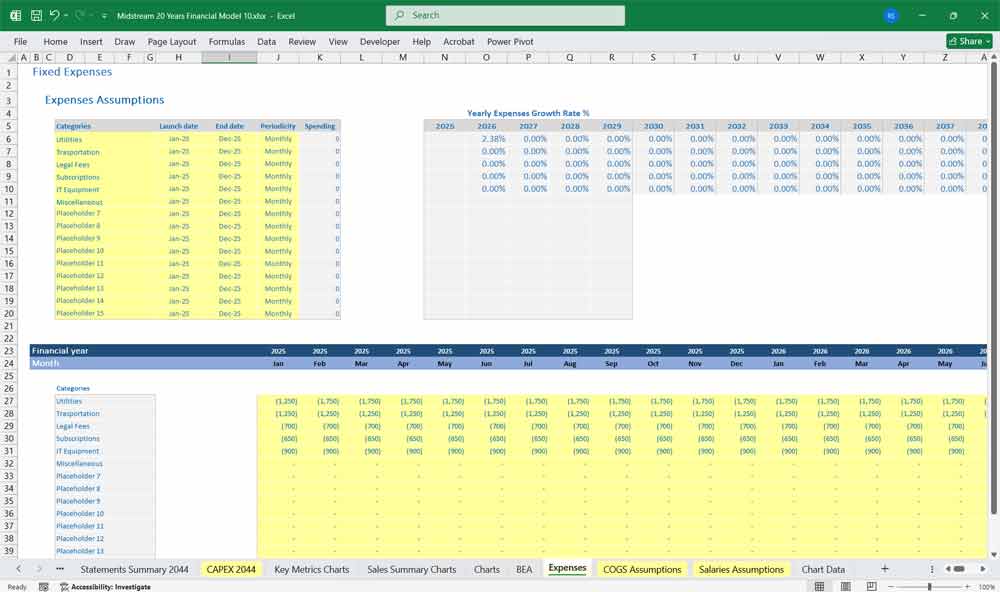
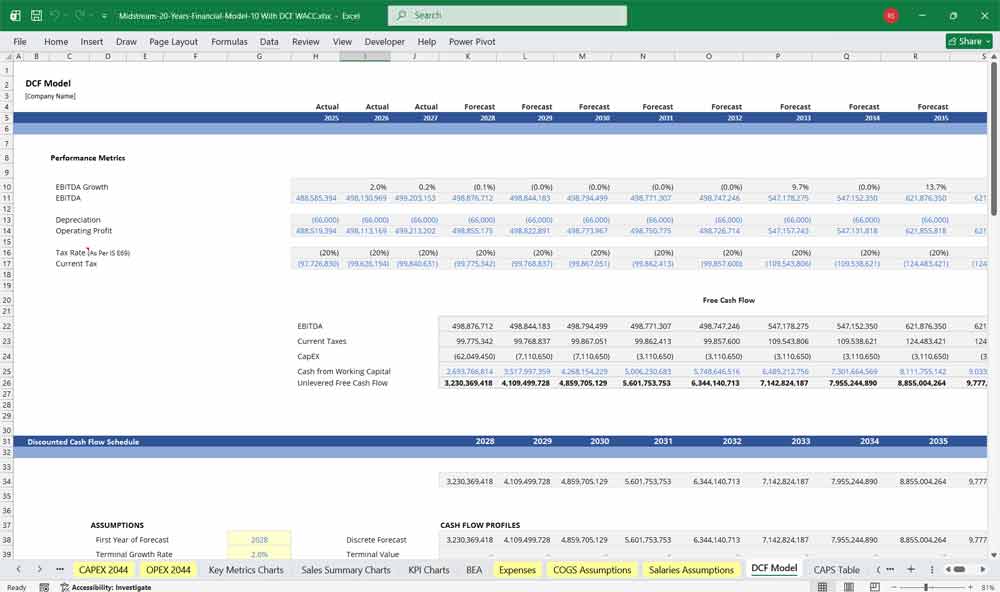
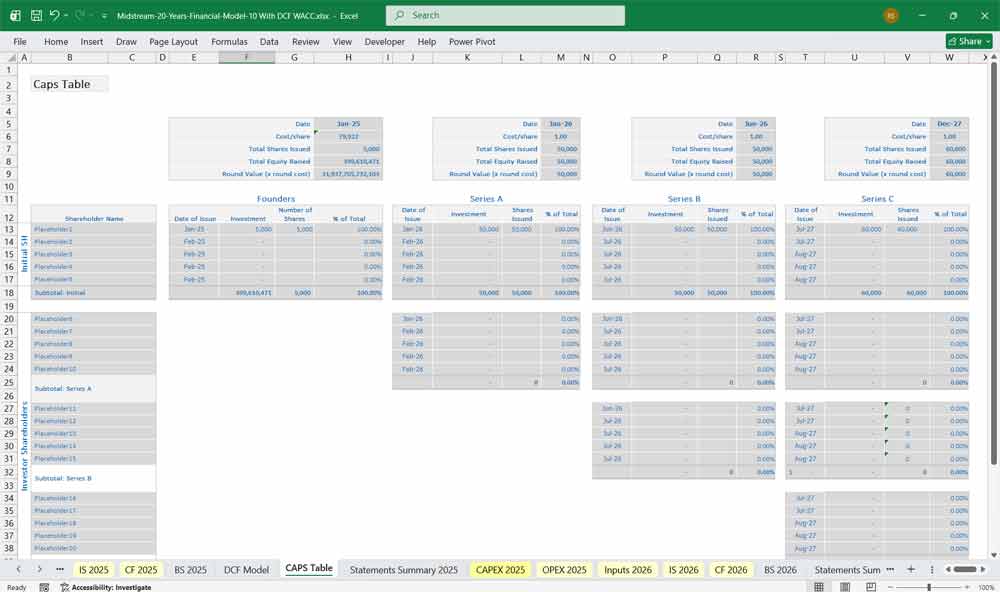
A robust 20 Year financial model with DCF, Sensitivity Analysis, WACC, NPV and IRR for a midstream oil refinery requires a focus on operational capacity, commodity spreads, and high capital intensity
Income Statement
The income statement tracks the profitability of the refinery by modeling the margin between raw feedstock and refined outputs.
Revenue and Cost of Goods Sold (COGS)
-
Throughput Capacity: Model total refining capacity in barrels per day (BPD) multiplied by the Utilization Rate (typically 85%–95%).
-
Yield Assumptions: Define the product mix (e.g., 50% gasoline, 30% diesel, 15% jet fuel, 5% heavy ends/byproducts).
-
Pricing/Spreads: Apply market-based pricing for each product output and the Brent or WTI benchmark cost for crude oil inputs.
-
Variable Costs: Include costs for catalysts, chemicals, energy (fuel gas), and emission credits (e.g., RINs in the U.S. market).
Operating Expenses (OPEX)
-
Fixed Costs: Model labor, routine maintenance, insurance, and administrative overhead.
-
Turnaround Expenses: Refineries require major maintenance “turnarounds” every 3–5 years. These are significant cash outflows that must be amortized or expensed periodically in the model.
EBITDA and Beyond
-
EBITDA: Revenue minus variable/fixed operating costs.
-
Depreciation: Calculated on a straight-line or units-of-production basis for heavy machinery and infrastructure.
-
Interest Expense: Driven by the debt schedule used to finance the asset-heavy infrastructure.
Cash Flow Statement
This section reconciles net income with the heavy capital requirements characteristic of refining.
Cash Flow from Operations (CFO)
-
Working Capital: Crucial for refineries. Because of the long lead time between purchasing crude and selling refined products, models must account for changes in accounts receivable (receivables from buyers), accounts payable (crude suppliers), and—critically—Inventory.
-
Inventory Cycles: Adjust for the value of crude in transit and finished goods in storage tanks.
Cash Flow from Investing (CFI)
-
Capital Expenditures (CapEx): Divide into “Maintenance CapEx” (keeping the plant running) and “Growth CapEx” (capacity expansions or upgrades for cleaner fuel standards).
-
Asset Disposals: Proceeds from the sale of legacy equipment or byproducts.
Cash Flow from Financing (CFF)
-
Debt Service: Amortization of principal and interest payments.
-
Dividends/Distributions: If structured as an MLP (Master Limited Partnership) or subsidiary, model the dividend payout ratio.
Balance Sheet
The balance sheet captures the massive asset base and the leverage used to support it.
Assets
-
Property, Plant, and Equipment (PP&E): The largest line item. This includes the distillation units, cokers, hydrotreaters, and storage tank farms.
-
Inventory: Valued at the lower of cost or market. Large quantities of crude oil and refined products on hand represent a significant percentage of current assets.
-
Cash and Equivalents: Liquidity buffers required to handle volatile commodity price swings.
Liabilities
-
Long-Term Debt: Typically includes high levels of senior notes or term loans used to fund the refinery’s construction or acquisition.
-
Environmental Liabilities: Provisions for site remediation, decommissioning, and potential future carbon-related tax or compliance obligations.
Equity
-
Retained Earnings: Cumulative net income minus any dividends paid to shareholders or parent companies.
-
Contributed Capital: Initial and subsequent equity injections from investors.
20-Year DCF: Valuing Throughput Volumes and Crack Spreads
In a 5-year Discounted Cash Flow (DCF) analysis for a midstream oil refinery, the valuation is heavily anchored to operational throughput volumes and the regional crack spread—the margin between the cost of crude oil feedstock and the wholesale price of refined products like gasoline, diesel, and jet fuel. The model projects cash flows driven by processing capacity, balanced against massive, front-loaded CapEx for distilling units, hydrocrackers, and mandatory environmental compliance equipment. A 20-year horizon is standard to align with the refinery’s scheduled “turnaround cycles”—planned shutdowns for extensive maintenance and equipment upgrades that occur every 4 to 6 years. Because these turnarounds trigger major cash outflows and temporary revenue stops, the Terminal Value carries significant weight, pricing in the refinery’s long-term geographic location, infrastructure connectivity, and its capacity to pivot toward biofuel processing.
WACC: Pricing Commodity Volatility and the “Carbon Beta”
The Weighted Average Cost of Capital (WACC) for a midstream refinery typically ranges from 8.5% to 11.5%, reflecting a capital structure that benefits from heavy physical collateral but faces long-term regulatory headwinds. Because refineries own massive, specialized industrial real estate and pipeline connections, they can support a solid debt-to-equity ratio to keep the overall cost of capital disciplined. However, the Cost of Equity carries a sharp premium for “Hydrocarbon and Carbon Beta.” In the 2026 energy landscape, investors require a high hurdle rate to shield future cash flows from risks like sudden regulatory changes, tightening carbon-border adjustment taxes, and shifting global energy demand profiles away from fossil fuel refining toward cleaner alternatives.
Sensitivity Analysis: Stress-Testing the Feedstock and Margin Matrix
For a midstream refinery, Sensitivity Analysis is the primary tool used to measure operational resilience against volatile energy markets and unexpected supply disruptions. Financial analysts construct sensitivity matrices to stress-test how a $3 per barrel contraction in the crack spread or a 20% spike in utility costs (such as natural gas and electricity used to power the refining process) impacts the company’s internal rate of return (IRR). A highly critical variable to isolate is the “Refinery Utilization Rate”; because these complex industrial facilities carry exceptionally high fixed operating overhead, running the plant below 85% capacity due to a regional crude shortage or unplanned downtime causes fixed costs to rapidly consume thin margins. The sensitivity matrix maps the exact break-even threshold where processing volumes can shelter the bottom line from volatile oil spot markets.
Similar ProductsOther customers were also interested in...



 eFinancialModels
Electric Vehicle (EV) Charging Station Financial M...
With this comprehensive 5- or 10-year monthly tool, investors can assess the viability of setting up... Read more

Financial Model for Mobile App | Mobile App Busine...
The Mobile App Financial Plan Template in Excel allows you to develop financial projections when lau... Read more

 HenrySheykin
Food Truck Financial Model Excel Template
The Food Truck Financial Model helps entrepreneurs, founders, business owners, consultants, and anal... Read more

Green Hydrogen Production from Wind Energy Financi...
The Green Hydrogen from Wind Financial Model aims to comprehensively forecast a horizon of 40 years ... Read more

Simple Mutual Non-Disclosure Agreement Template
Protect your business secrets with ease using our Simple Mutual Non-Disclosure Agreement Template. S... Read more

Solar Energy Financial Model
The Solar Energy Financial Model Spreadsheet Template in Excel assists you in preparing a sophistica... Read more

 Peter Graf
The Customer-Centric Financial Model for Restauran...
Starting a restaurant without a financial plan is like driving a car blindfolded. You wouldn´t do i... Read more
You must log in to submit a review.