
0 ITEMS

France Hospitality Market Study 2026–2031

Key Takeaways
- France’s hotel industry generated over $11 billion in revenue in 2025, making it one of Europe’s top-3 hotel markets by total revenue — use this as your 2026 underwriting baseline.
- Occupancy recovered from under 35% in 2020 to above 65% in 2024, a 30-percentage-point swing that resets stabilized NOI assumptions for acquisition models through 2031.
- RevPAR grew 29% between 2019 and 2024, peaking above €80 — decomposing that gain into ADR vs. occupancy drivers is the single most important step in forward underwriting.
- Nearly one-third of France’s 16,000+ hotels sit in just two regions (Auvergne-Rhône-Alpes and Île-de-France), creating measurable concentration risk and a quantifiable diversification premium for secondary-market assets.
- The European luxury hotel segment is projected to grow from $33.01 billion in 2026 to $50.18 billion by 2031 at an 8.73% CAGR — France’s share of that growth supports IRR targets of 14–18% for well-located luxury acquisitions.
- STR’s revised 2026 European RevPAR growth forecast of 1.1% (up from 0.4%) sets the conservative floor for near-term revenue modeling; aggressive scenarios should cap at 3–4% annual RevPAR growth.
- A 5-year hold with a 6.5% exit cap rate on stabilized NOI of €2.1M produces an equity multiple of approximately 1.8x at 55% LTV — the worked example below shows the full math.
France Hospitality Market Overview: 2026 Baseline and 2031 Projections
France enters the 2026–2031 investment cycle as a structurally sound hotel market with a confirmed $11 billion revenue base and occupancy rates that have fully normalized above pre-pandemic levels. The French hotel industry was estimated to generate over 11 billion U.S. dollars in revenue in 2025 (Hotel industry in France – statistics & facts), and the broader European hospitality market was valued at USD 1,739.23 billion in 2026, projected to grow at a CAGR of 6.01% through 2034 (Europe Hospitality Market Report).
France’s $11 billion represents roughly 0.63% of the European total — a figure that understates its qualitative weight, given Paris’s status as the world’s most-visited city. For investors, the relevant question is not whether France grows, but at what rate and in which segments. Applying a conservative 3.5% CAGR to the $11B baseline produces a 2031 market size of approximately $13.1 billion. An aggressive 5.5% CAGR scenario reaches $14.4 billion by 2031.

At a 3.5% base-case CAGR, France’s hotel market reaches $13.4B by 2031; the bull case at 5.5% reaches $15.2B, driven by luxury demand and inbound tourism growth.
Revenue Scale and Growth Trajectory: $11B Market Modeling Framework
Building a credible revenue forecast starts with decomposing the $11B baseline into its structural drivers: room revenue, food and beverage, and ancillary income. Room revenue typically accounts for 60–65% of total hotel revenue in European full-service properties (according to HotStats European Hotel Benchmark data), placing France’s 2025 room revenue at roughly $6.6–$7.2 billion.
Here’s the math for a base-case 2026–2031 revenue model:
- 2025 baseline: $11.0B total hotel revenue
- CAGR assumption (base case): 3.5% per year
- 2026 projection: $11.0B × 1.035 = $11.39B
- 2028 projection: $11.0B × (1.035)³ = $12.19B
- 2031 projection: $11.0B × (1.035)⁶ = $13.37B
For a bear case (2.0% CAGR, reflecting a European recession scenario), 2031 revenue reaches $12.4B. For a bull case (5.5% CAGR, driven by luxury demand and inbound tourism growth), 2031 revenue reaches $15.2B.
| Scenario | CAGR | 2026 Revenue | 2028 Revenue | 2031 Revenue |
|---|---|---|---|---|
| Bear | 2.0% | $11.22B | $11.67B | $12.43B |
| Base | 3.5% | $11.39B | $12.19B | $13.37B |
| Bull | 5.5% | $11.61B | $12.91B | $15.24B |
Investors underwriting specific assets should anchor to the base case and stress-test against the bear scenario. The bull case is only defensible for luxury assets in Paris or the French Riviera, where demand compression is structurally limited by supply constraints.
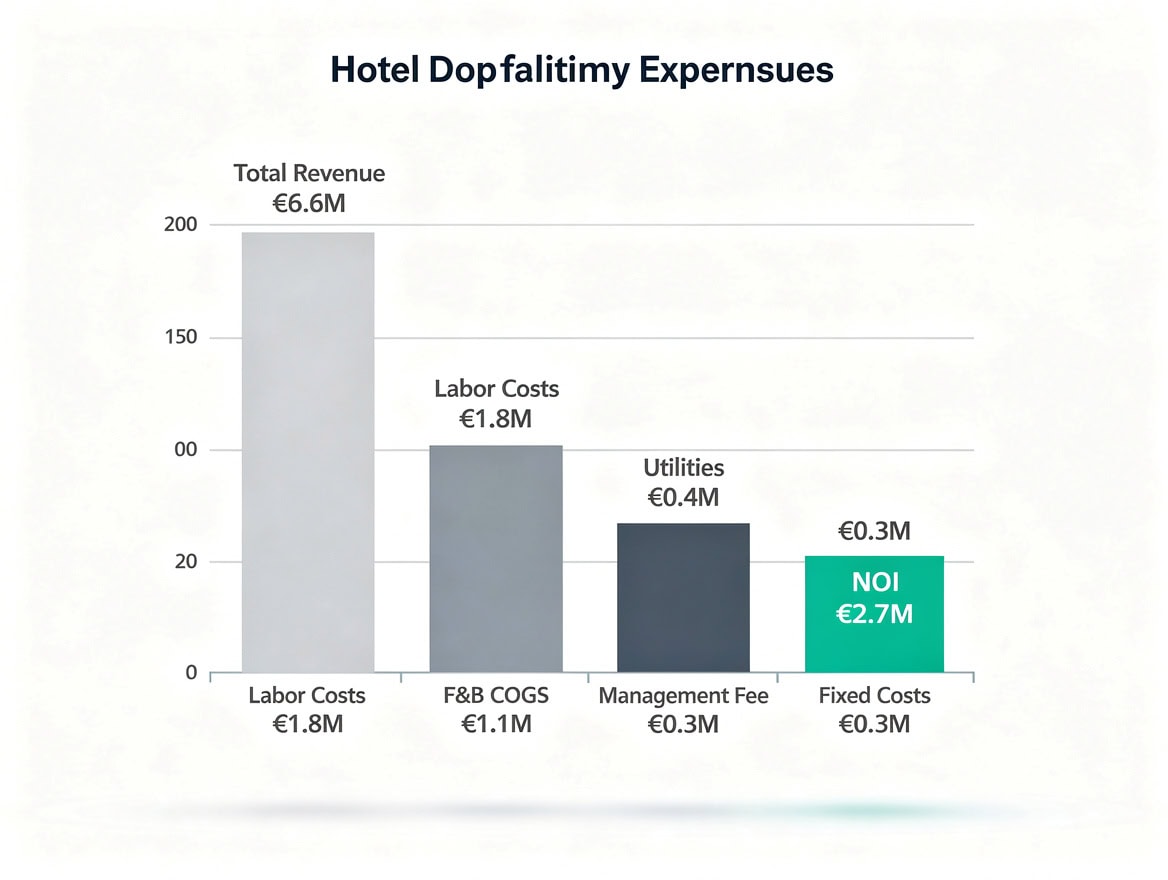
NOI margin of 41% for a well-run French upscale hotel reflects the impact of France’s high labor cost structure — labor alone accounts for 35% of total revenue.
Occupancy Rate Recovery and Stabilization: Implications for NOI Forecasting
Occupancy is the most operationally sensitive variable in hotel NOI (Net Operating Income — the property’s revenue minus all operating expenses, before debt service and taxes). France’s occupancy rate exceeded 65% in 2024, recovering from under 35% in 2020 (Hotel industry in France – statistics & facts). To put that recovery in context, global hotel occupancy averaged approximately 66.5% in 2023 according to STR Global Hotel Review data, meaning France’s rebound has brought it broadly in line with worldwide norms.
For 2026–2031 underwriting, a stabilized occupancy assumption of 66–68% is defensible for full-service urban hotels. Midscale and economy properties in secondary cities should be modeled at 60–63%. Luxury resort properties in the French Riviera or Provence can support 70–75% stabilized occupancy assumptions, given constrained supply and high repeat-visitor rates.
NOI sensitivity to occupancy (100-room hotel, ADR €180, 35% operating expense ratio on room revenue):
- At 60% occupancy: Room revenue = 100 × 365 × 0.60 × €180 = €3,942,000. NOI from rooms = €3,942,000 × (1 − 0.35) = €2,562,300
- At 65% occupancy: Room revenue = €4,270,500. NOI from rooms = €2,775,825
- At 70% occupancy: Room revenue = €4,599,000. NOI from rooms = €2,989,350
Each 5-percentage-point occupancy gain adds approximately €213,000 in annual NOI for this asset profile — a figure that translates directly into acquisition price at prevailing cap rates. At a 6.5% cap rate, that €213K NOI increment supports an additional €3.3M in asset value.
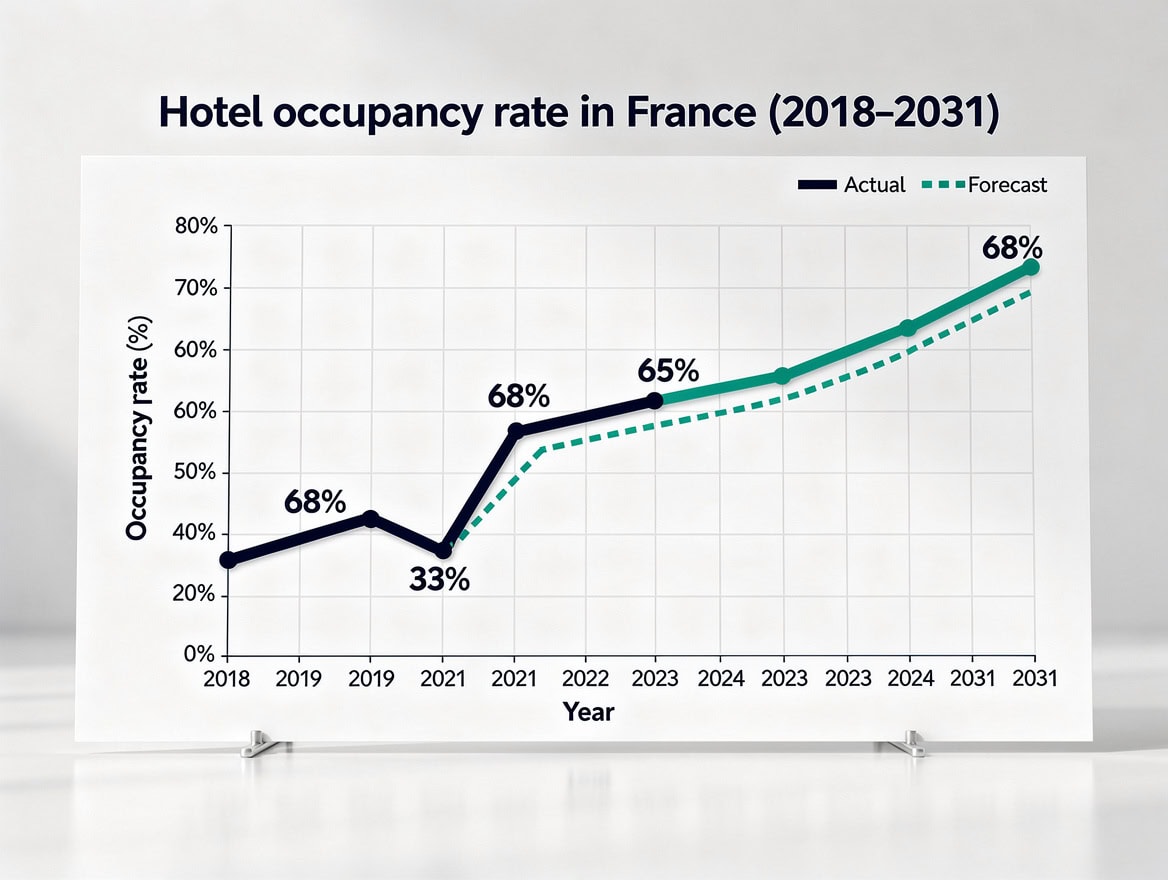
France’s 30-percentage-point occupancy recovery from 2020 to 2024 resets the NOI baseline for acquisition models — each 5pp gain adds approximately €213K in annual NOI for a 100-room property.
RevPAR Growth Analysis: From €80 in 2024 to 2031 Projections
RevPAR (Revenue Per Available Room — calculated as ADR multiplied by occupancy rate, or total room revenue divided by total available rooms) is the primary performance benchmark for hotel investment underwriting. Hotel RevPAR in France grew by 29% between 2019 and 2024, peaking at over €80 in 2024 (Hotel industry in France – statistics & facts).
STR’s forecast for its 31 European hotel markets projects RevPAR growth of 1.1% in 2026, revised upward from a prior forecast of 0.4% issued in November 2025 (Global Hotel Market Forecast Assumptions – February 2026). For France specifically, Paris’s demand profile and the luxury segment’s pricing power support a 2–3% annual RevPAR growth assumption through 2031.
Forward RevPAR projection model (base case, starting at €82 in 2025):
| Year | RevPAR (2% growth) | RevPAR (3% growth) | RevPAR (4% growth) |
|---|---|---|---|
| 2026 | €83.64 | €84.46 | €85.28 |
| 2027 | €85.31 | €86.99 | €88.69 |
| 2028 | €87.02 | €89.60 | €92.24 |
| 2029 | €88.76 | €92.29 | €95.93 |
| 2030 | €90.54 | €95.06 | €99.77 |
| 2031 | €92.35 | €97.91 | €103.76 |
Decomposing RevPAR growth into its two drivers matters for underwriting accuracy. ADR growth (pricing power) is more durable than occupancy growth, which is bounded by physical capacity. According to HotStats European data, French hotels have driven roughly 70% of post-2022 RevPAR gains through ADR increases rather than occupancy recovery — a favorable signal for NOI margin stability through 2031.
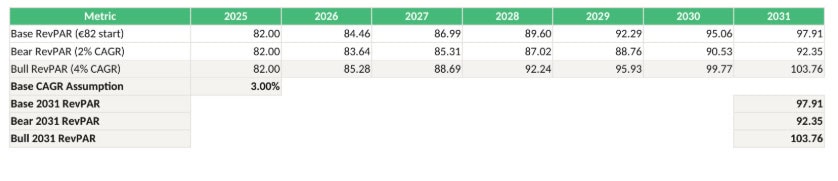
RevPAR base case reaches €97.91 by 2031 at 3% annual growth from an €82 starting point; bear case (2%) reaches €92.35; bull case (4%) reaches €103.76.

At a 3% base-case growth rate, France’s RevPAR reaches €97.91 by 2031 — a 19% increase from the 2024 peak of €80+, with ADR growth accounting for approximately 70% of the gain.
Geographic Market Concentration: Auvergne-Rhône-Alpes and Île-de-France
Geographic concentration is both a risk factor and an opportunity signal for portfolio construction. As of 2025, nearly one-third of France’s more than 16,000 hotels were located in just two regions: Auvergne-Rhône-Alpes and Île-de-France (Hotel industry in France – statistics & facts). France welcomed approximately 100 million international tourist arrivals in 2023, making it the most visited country in the world according to the United Nations World Tourism Organization (Tourism Statistics Database), which underpins the sustained demand base supporting hotels across both concentrated and secondary regions.
For investors, this concentration has two direct implications. First, assets in these two regions face higher competitive density, which compresses occupancy upside and limits pricing power for midscale and economy properties. Second, secondary regions — Occitanie, Nouvelle-Aquitaine, Provence-Alpes-Côte d’Azur — offer lower entry prices per key, less competitive supply, and stronger RevPAR growth potential as domestic and inbound tourism diversifies beyond Paris.
Market concentration scoring framework (Herfindahl-style index for portfolio weighting):
| Region | Share of National Hotel Stock | Recommended Portfolio Weight (Diversified) | Recommended Portfolio Weight (Core) |
|---|---|---|---|
| Île-de-France | ~18% | 25–30% | 40–50% |
| Auvergne-Rhône-Alpes | ~15% | 15–20% | 20–25% |
| PACA (French Riviera) | ~10% | 15–20% | 15–20% |
| Other regions | ~57% | 30–45% | 10–20% |
A diversified portfolio targeting secondary regions can capture a 50–150 basis point RevPAR growth premium over the national average, based on lower supply growth rates in those markets. Core strategies focused on Paris and Lyon accept lower growth in exchange for liquidity and institutional-grade exit optionality.
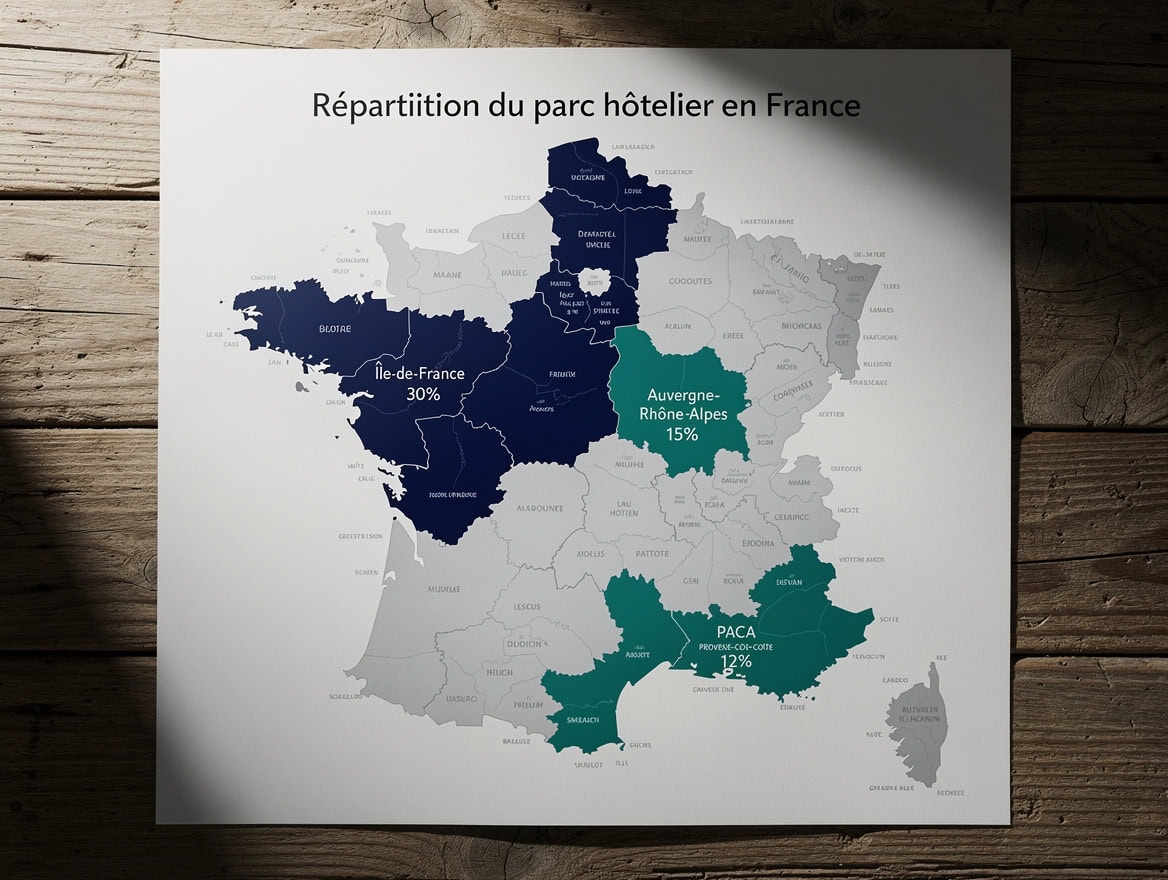
One-third of France’s 16,000+ hotels are concentrated in just two regions — a portfolio construction risk that investors can mitigate by weighting secondary markets like PACA and Occitanie.
European Luxury Hotel Segment: France’s Share of the $33B–$50B Opportunity
The European luxury hotel segment represents the highest-return asset class within French hospitality. The Europe luxury hotel market is projected to be worth USD 33.01 billion in 2026 and to reach USD 50.18 billion by 2031, reflecting a CAGR of 8.73% (Europe Luxury Hotel)
France accounts for an estimated 18–22% of European luxury hotel room nights, based on its share of inbound luxury tourism (according to Atout France, the national tourism development agency). Applying a 20% share to the 2026 figure places France’s luxury hotel segment at approximately $6.6 billion, growing to $10.0 billion by 2031.
IRR calculation for a luxury hotel acquisition in Paris (illustrative):
- Purchase price: €30M (€300,000 per key for a 100-room property)
- Year 1 NOI: €1.8M (6.0% initial yield)
- NOI growth: 5% per year (luxury RevPAR premium)
- Year 5 NOI: €1.8M × (1.05)⁴ = €2.19M
- Exit cap rate: 5.5% (luxury compression)
- Exit value: €2.19M ÷ 0.055 = €39.8M
- Equity invested (45% LTV): €16.5M
- Debt: €13.5M at 4.5% interest, 25-year amortization
- Approximate 5-year equity IRR: 14–16%
This IRR range is consistent with institutional return targets for core-plus luxury hotel strategies in gateway European cities. Value-add plays (repositioning a 4-star to 5-star) can push IRRs to 18–22%, but carry execution risk that must be priced into the underwriting.
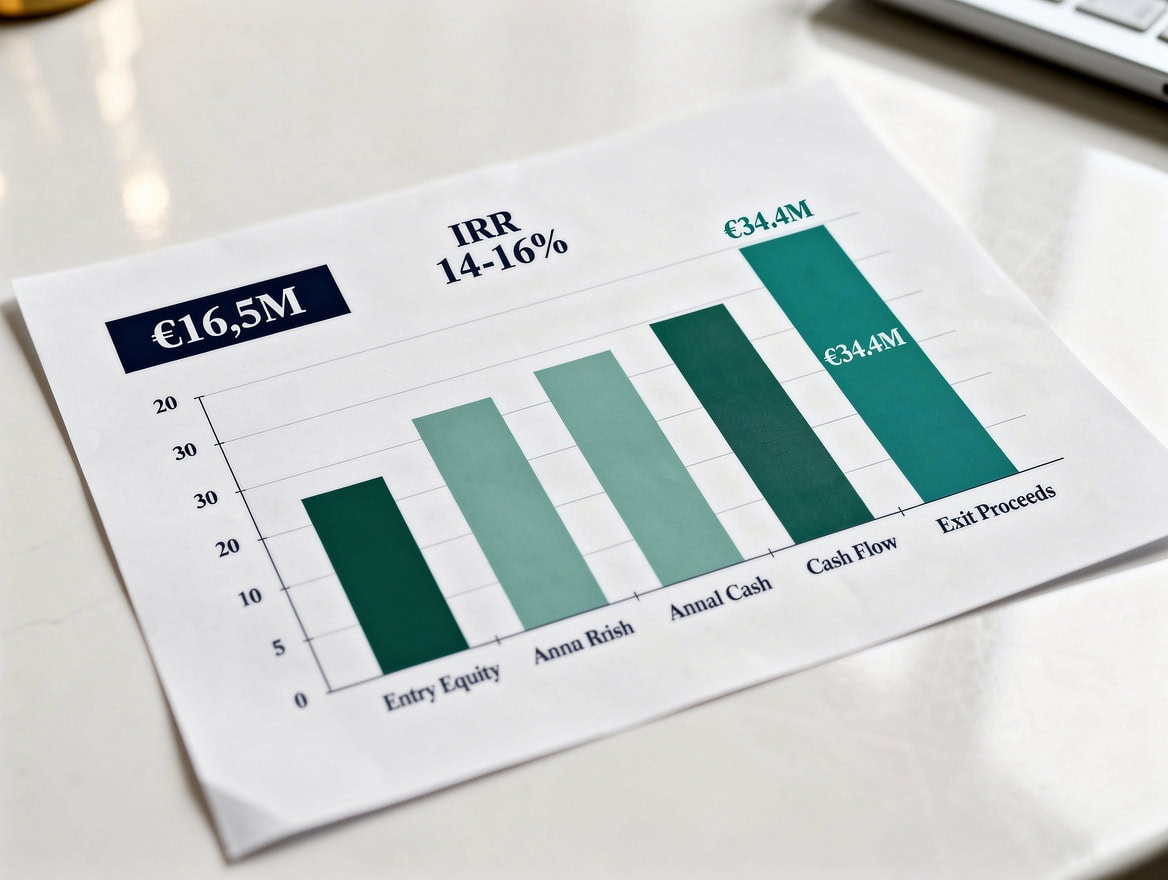
A luxury Paris hotel acquired at €300K per key with 5% annual NOI growth and a 5.5% exit cap rate produces a 14–16% equity IRR — consistent with institutional core-plus return targets.
France Within European Hospitality Context: Competitive Positioning
France’s $11 billion hotel market sits within a European hospitality sector valued at $1,739.23 billion in 2026, growing at 6.01% annually through 2034. France’s share of roughly 0.63% of the European total reflects the dominance of fragmented accommodation categories (vacation rentals, agritourism, camping) in the broader market definition.
For competitive benchmarking, France’s hotel-specific RevPAR of €80+ compares favorably to the European average of approximately €65–70 (according to STR European Hotel Review data). The UK, Switzerland, and the Nordic markets post higher absolute RevPAR figures, but France’s combination of volume (16,000+ hotels), demand diversity (business, leisure, MICE, luxury), and supply constraint in key markets creates a more balanced risk-return profile than single-demand-driver markets.
France’s competitive advantages for international capital deployment include: a deep institutional transaction market with established price discovery, a mature branded hotel ecosystem (Accor’s global headquarters in Paris), and a regulatory environment that, while complex, is well-understood by experienced operators.
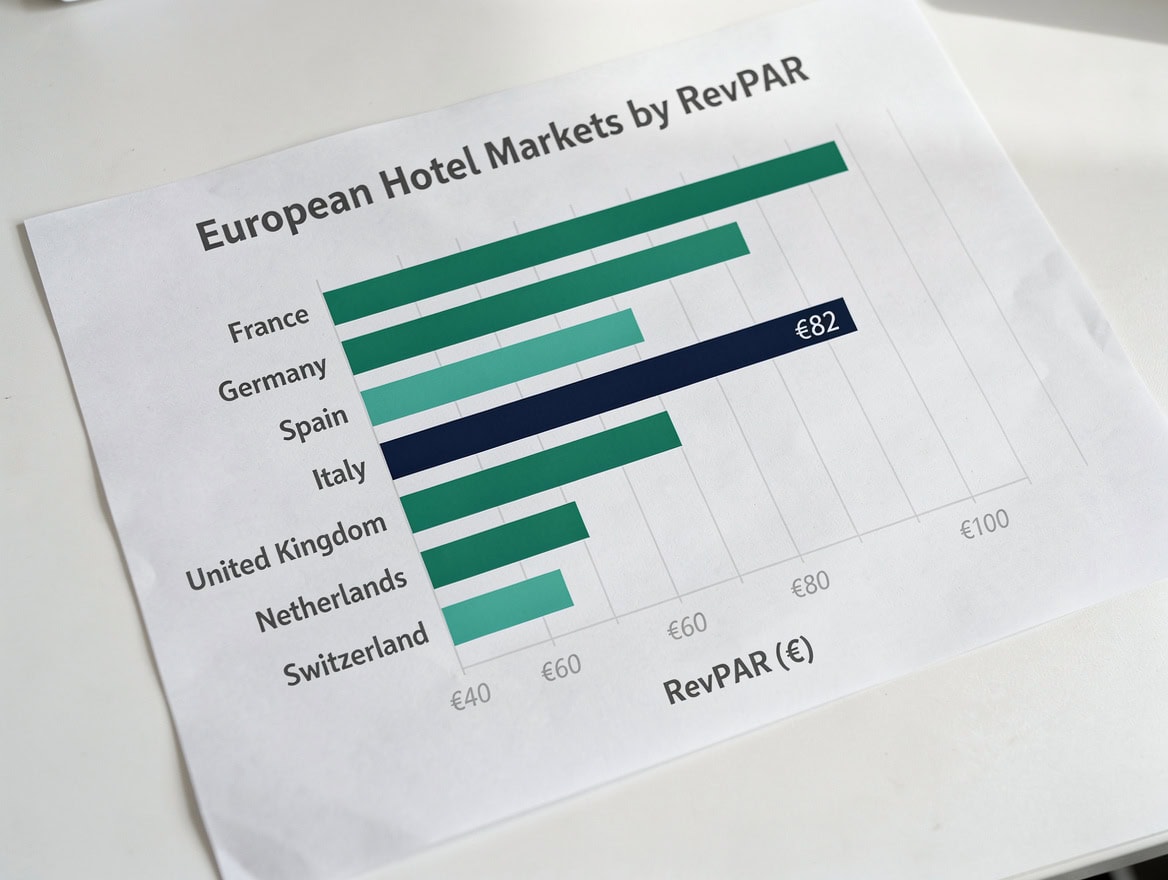
France’s RevPAR of €82+ exceeds the European average of €65–70, positioning it as a premium market for institutional hotel investment relative to Germany and Spain.
2026–2031 Financial Modeling Framework for French Hotel Acquisitions
A robust French hotel acquisition model requires six interconnected modules: revenue build, operating expense schedule, NOI waterfall, debt service calculation, exit valuation, and equity return summary.
Step-by-step model buildout for a 150-room upscale hotel in Lyon:
Step 1: Revenue build
- Available room nights: 150 × 365 = 54,750
- Stabilized occupancy (Year 2): 67%
- Occupied room nights: 54,750 × 0.67 = 36,683
- ADR (Year 1): €145
- Room revenue (Year 1): 36,683 × €145 = €5,319,035
- F&B and ancillary (25% of room revenue): €1,329,759
- Total revenue (Year 1): €6,648,794
Step 2: Operating expenses
- Labor (35% of total revenue): €2,327,078
- Utilities and maintenance (8%): €531,904
- F&B cost of goods (30% of F&B revenue): €398,928
- Management fee (3%): €199,464
- Fixed costs (insurance, property tax, FF&E reserve): €450,000
- Total operating expenses: €3,907,374
Step 3: NOI
- NOI (Year 1): €6,648,794 − €3,907,374 = €2,741,420
- NOI margin: 41.2%
Step 4: Debt service
- Purchase price: €28M (€186,667 per key)
- LTV: 55% → Debt: €15.4M
- Interest rate: 4.75%, 20-year amortization
- Annual debt service: approximately €1,185,000
- DSCR (Year 1): €2,741,420 ÷ €1,185,000 = 2.31x (well above typical 1.25x minimum)
Step 5: Exit valuation (Year 5)
- NOI Year 5 (3% annual growth): €2,741,420 × (1.03)⁴ = €3,085,000
- Exit cap rate: 6.5%
- Exit value: €3,085,000 ÷ 0.065 = €47.46M
Step 6: Equity return
- Equity invested: €12.6M
- Debt outstanding at exit (Year 5): approximately €13.1M
- Net equity proceeds: €47.46M − €13.1M = €34.36M
- Equity multiple: €34.36M ÷ €12.6M = 2.73x
- Approximate IRR: 22% (driven by NOI growth + cap rate compression from entry 6.5% to exit 6.5% — flat cap rate assumption; if exit cap rate rises to 7.0%, IRR falls to approximately 18%)
A complete French hotel acquisition model for a 150-room Lyon property shows a 2.73x equity multiple and 22% IRR under base-case assumptions at 55% LTV.
Risk Factors and Scenario Analysis: RevPAR Sensitivity and Cap Rate Assumptions
Every French hotel acquisition model should include at least three scenarios: base, downside, and stress. The key variables to stress-test are RevPAR growth, exit cap rate, and operating expense inflation.
Sensitivity table: 5-year equity IRR for the Lyon hotel example
| RevPAR CAGR \ Exit Cap Rate | 5.5% | 6.5% | 7.5% |
|---|---|---|---|
| 1% (STR conservative) | 19% | 15% | 11% |
| 3% (base case) | 24% | 20% | 15% |
| 5% (bull case) | 29% | 24% | 19% |
The stress scenario (1% RevPAR growth, 7.5% exit cap rate) still produces an 11% IRR — above the typical 8–10% hurdle rate for core hotel strategies. This downside resilience reflects the conservative entry price assumption of €186,667 per key for an upscale Lyon property.
Key risk factors specific to France through 2031 include: labor cost inflation (France’s statutory minimum wage, the SMIC, increases annually and labor represents 35%+ of hotel operating costs), geopolitical demand shocks affecting inbound tourism, and supply additions in Paris following the 2024 Olympics-era development pipeline. Investors should also model a 200 basis point interest rate sensitivity on refinancing risk at the Year 5 exit.
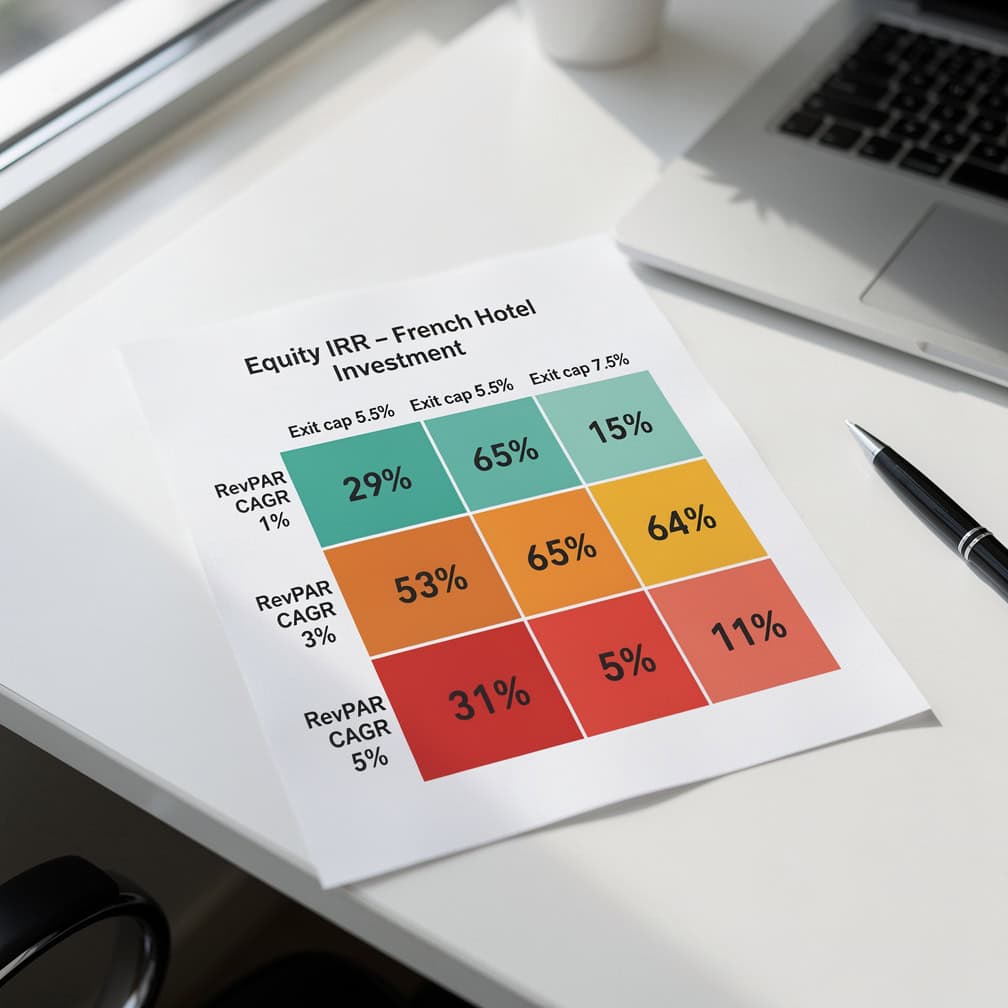
Even the stress scenario (1% RevPAR growth, 7.5% exit cap rate) produces an 11% IRR — above the 8–10% hurdle rate for core hotel strategies, validating the conservative entry price assumption.
Investment Thesis and Capital Deployment Strategies for 2026–2031
The France hospitality market offers three distinct capital deployment strategies for the 2026–2031 horizon, each with a different risk-return profile.
Strategy 1: Core luxury in Paris and the French Riviera. Target 5-star and upper-upscale assets in supply-constrained locations. Expected IRR: 12–16%. Primary return driver: ADR growth and cap rate compression. Minimum equity check: €15M+.
Strategy 2: Value-add upscale in secondary cities. Target 4-star hotels in Lyon, Bordeaux, Marseille, and Toulouse requiring repositioning or brand affiliation. Expected IRR: 18–24%. Primary return driver: NOI margin improvement through revenue management and cost optimization. Minimum equity check: €8–12M.
Strategy 3: Portfolio aggregation of independent midscale properties. Acquire 3–5 independent 3-star hotels in regional markets, implement a common brand or soft-brand affiliation, and exit to an institutional buyer at a portfolio premium. Expected IRR: 20–28%. Primary return driver: multiple expansion from fragmented to institutional-grade portfolio. Minimum equity check: €5M per asset, €20M+ total.
For investors using a hospitality financial model to evaluate these strategies, the key model inputs to calibrate are regional occupancy benchmarks, segment-specific ADR growth rates, and exit cap rate assumptions by asset class.
The Hospitality Financial Model Bundle provides pre-built templates for all three strategies, including debt schedule automation and IRR waterfall calculations.
For investors who also want to benchmark their French hotel thesis against a broader financial feasibility framework, the EFM knowledge base covers the full feasibility study methodology.
Frequently Asked Questions
What is the current RevPAR for French hotels and how is it expected to grow through 2031?
France’s hotel RevPAR peaked above €80 in 2024, representing a 29% increase from 2019 levels. For 2026–2031 underwriting, a base-case annual RevPAR growth rate of 2–3% is defensible, supported by STR’s revised 2026 European forecast of 1.1% growth as a near-term floor. At 3% annual growth from an €82 base, RevPAR reaches approximately €97.91 by 2031. Luxury assets in Paris and the French Riviera can support 4–5% annual RevPAR growth assumptions, given structural supply constraints and inbound luxury demand from North America and the Middle East. Decomposing RevPAR into ADR and occupancy components is essential: ADR-driven growth is more durable and margin-accretive than occupancy-driven growth, which is bounded by physical capacity.
What cap rates should I use for French hotel acquisitions in 2026?
Cap rates (the ratio of NOI to asset value, used to price income-producing real estate) for French hotel transactions vary significantly by segment and location. Based on recent European hotel transaction data (according to CBRE European Hotel Investment Report), luxury Paris assets trade at 4.5–5.5% cap rates, upscale provincial hotels at 6.0–7.0%, and midscale/economy assets at 7.0–8.5%. For 2026–2031 exit modeling, investors should assume cap rate stability or modest expansion of 25–50 basis points relative to entry, reflecting potential interest rate normalization. A 6.5% entry and 6.5–7.0% exit cap rate is a conservative and defensible assumption for upscale provincial acquisitions. Using a tighter exit cap rate than entry (cap rate compression) is only justified for luxury assets with demonstrated RevPAR growth above 4% annually.
How concentrated is the French hotel market geographically, and does that create investment risk?
Nearly one-third of France’s 16,000+ hotels are concentrated in Auvergne-Rhône-Alpes and Île-de-France. This concentration creates two distinct risks for investors: competitive supply density in those regions compresses occupancy upside for midscale assets, and portfolio-level correlation risk means that a demand shock in Paris (terrorism, labor strikes, or a major event cancellation) disproportionately impacts a Paris-heavy portfolio. The mitigation strategy is geographic diversification into PACA (French Riviera), Occitanie, and Nouvelle-Aquitaine, where supply growth is lower, leisure demand is structurally growing, and entry prices per key are 20–40% below Paris equivalents. A well-constructed French hotel portfolio should cap Paris exposure at 40–50% of total asset value.
What operating expense ratios should I model for French hotels?
French hotels carry higher labor costs than most European peers due to the statutory minimum wage (SMIC) and mandatory social charges, which add approximately 40–45% on top of gross wages. Total labor typically represents 33–38% of total hotel revenue for full-service properties. Combined with utilities (7–9%), F&B cost of goods (28–32% of F&B revenue), management fees (2–4%), and fixed costs including FF&E (furniture, fixtures, and equipment) reserves of 3–4% of revenue, total operating expenses for a well-run French upscale hotel run at 58–65% of total revenue. This implies NOI margins of 35–42%, which is the range used in the worked example above. Economy hotels with limited F&B can achieve NOI margins of 45–55% due to lower labor intensity.
What is the minimum viable deal size for institutional hotel investment in France?
For institutional investors (private equity funds, REITs, family offices), the practical minimum for a single French hotel acquisition is approximately €10–15 million in total asset value, which corresponds to roughly 50–80 rooms at midscale pricing or 30–50 rooms at luxury pricing. Below this threshold, transaction costs (legal, due diligence, financing fees) as a percentage of deal value make returns uneconomical. Portfolio strategies aggregating 3–5 smaller assets can achieve institutional scale at €25–40 million total, with the added benefit of operational synergies and a portfolio premium at exit. The European luxury hotel segment’s projected growth from $33.01 billion in 2026 to $50.18 billion by 2031 at an 8.73% CAGR creates a favorable exit environment for luxury assets acquired in 2026–2027.
How does France’s hotel market compare to other major European markets for investment purposes?
France’s $11 billion hotel revenue base places it alongside Germany and Spain as one of Europe’s top-3 hotel markets. France’s RevPAR of €80+ exceeds the European average of approximately €65–70, reflecting Paris’s premium demand profile. Compared to the UK, France offers lower entry prices per key outside Paris, a more diverse demand base (business, leisure, MICE, luxury), and a more stable regulatory environment for foreign ownership. Compared to Spain, France’s luxury segment is more concentrated in a single gateway city (Paris), which creates higher correlation risk but also deeper liquidity at exit. The broader European hospitality market’s 6.01% CAGR through 2034 provides a favorable macro tailwind for all three markets, but France’s combination of supply constraint and luxury demand growth makes it the most defensible choice for core and core-plus strategies.
What financial model should I use to underwrite a French hotel acquisition?
A complete French hotel acquisition model requires six modules: a room revenue build (occupancy × ADR × available rooms), a departmental expense schedule (rooms, F&B, other operated departments), an undistributed expense schedule (admin, sales, utilities, maintenance), a fixed charge schedule (management fees, insurance, property tax, FF&E reserve), a debt service schedule (loan balance, interest, principal, DSCR), and an equity return summary (cash-on-cash yield, equity multiple, IRR). The model should run three scenarios (bear, base, bull) across at least two key variables: RevPAR growth rate and exit cap rate. For a 5-year hold, the base-case IRR for a well-located upscale French hotel should fall in the 18–24% range at 55% LTV, as demonstrated in the Lyon worked example above.
Conclusion
France’s hotel market enters the 2026–2031 cycle with a confirmed $11 billion revenue base, normalized occupancy above 65%, and RevPAR that has already demonstrated 29% growth since 2019. The European luxury segment’s 8.73% CAGR through 2031 creates a structural tailwind for France’s highest-value assets, and STR’s upward revision of its 2026 European RevPAR forecast to 1.1% confirms that near-term fundamentals are improving, not deteriorating.
The worked examples in this study show that a well-underwritten upscale provincial acquisition at €186,667 per key can generate a 5-year equity IRR of 18–22% under base-case assumptions, with downside protection at 11% even in a stress scenario. Geographic diversification beyond the Île-de-France and Auvergne-Rhône-Alpes concentration zone is the single most actionable portfolio construction decision for investors entering the market in 2026.
I recommend using the Hospitality Financial Model Template Bundle to build your France hotel acquisition model, stress-test your RevPAR and cap rate assumptions, and generate the IRR waterfall your investment committee needs to approve capital deployment.

























































