
0 ITEMS

Coffee Shop Financial Model: Build Investor-Ready Projections
Key Takeaways
- The US coffee shop market exceeded $58 billion in 2025, making unit-level financial modeling essential for standing out with investors.
- Target COGS of 25-35% of revenue: every percentage point above 35% directly erodes your net margin.
- A healthy café targets 8-12% net profit margin; below 6% signals a structural cost problem, not just a slow month.
- Break-even for a typical independent café falls between month 12 and month 24, depending on rent, seat count, and average ticket size.
- Nearly 40% of Americans order from coffee and snack shops more than once a week, making customer frequency the single most powerful lever in your revenue model.
- UK independent cafés average £100,000-£150,000 in annual turnover and around £57,000 in profit, providing a useful international benchmark for margin validation.
- Labor (30-35% of revenue) and rent (10-15%) are the two cost lines that most often break a café’s economics before it reaches profitability.
Coffee Shop Industry Landscape: Market Size and Financial Benchmarks
The US coffee shop industry is large, growing, and intensely competitive, which means your financial model needs to be grounded in real benchmarks rather than optimistic guesses. The US coffee shop market exceeded $58 billion in value in 2025 (Statista), and Starbucks alone operated over 16,000 stores in the United States in 2023, generating nearly $30 billion in net revenue that year.
Those chain-level numbers set the ceiling. Your independent café model needs to work at the unit level: a single location, a defined seat count, and a realistic daily customer count. The good news is that consumer demand is strong. A 2023 survey found that almost 40% of Americans ordered from coffee and snack shops more than once a week (Statista), which means repeat purchase behavior is baked into the category.
For international context, the average independent coffee shop in the UK earns between £100,000 and £150,000 in annual turnover and around £57,000 in annual profit (Sage, 2023). That implies a profit margin of roughly 38-57% at the gross level, but after accounting for owner salary and overhead, net margins compress to the 8-12% range discussed later.
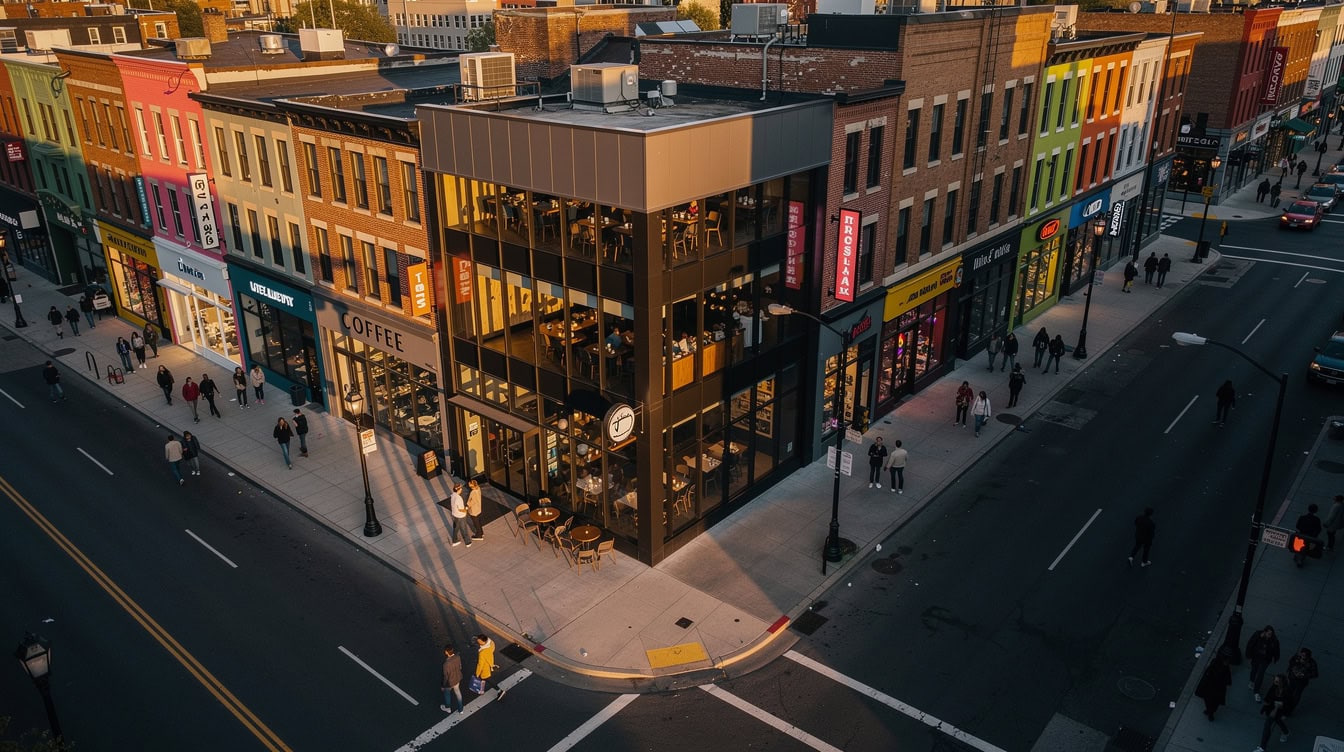
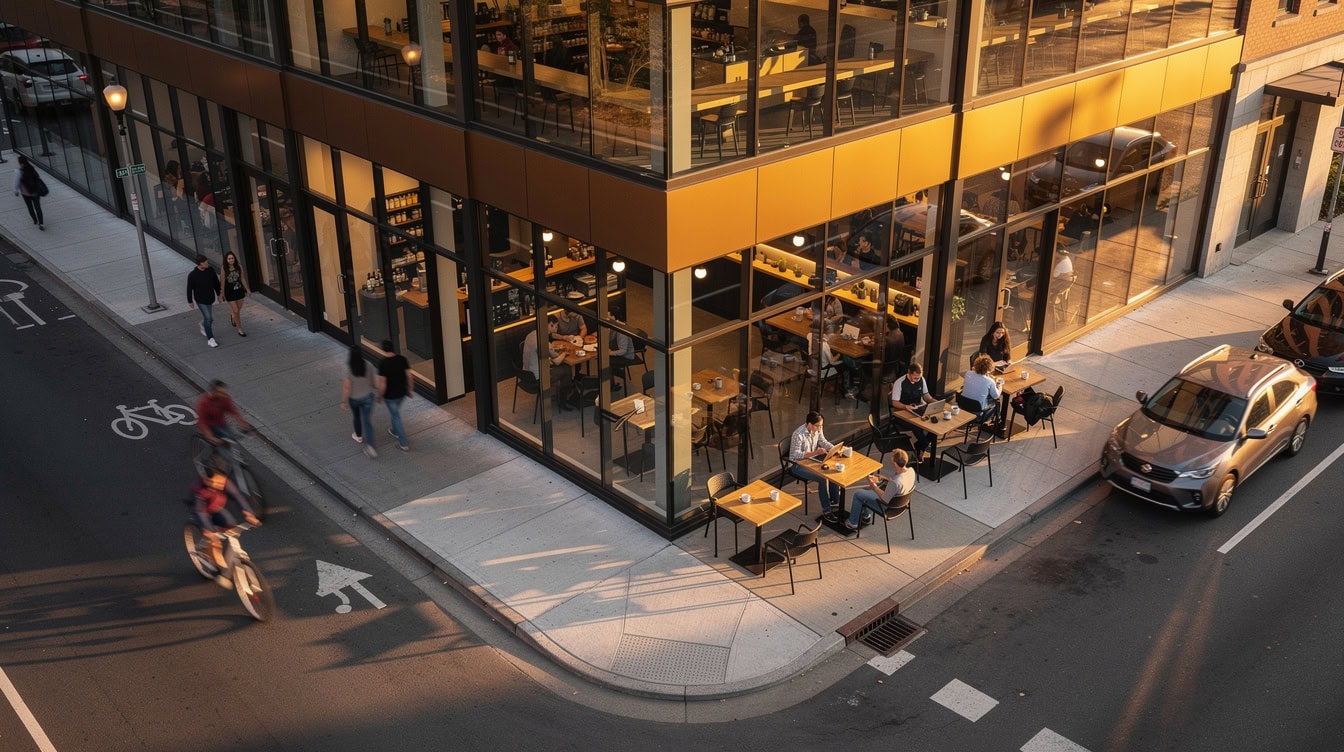
Starbucks’ 16,000+ US stores and $30B revenue set the scale benchmark; independent cafés compete on experience and community.
Core Revenue Model: Forecasting Sales by Product Category
A coffee shop revenue model works from the bottom up: you start with daily customer count, multiply by average ticket size, and build up to monthly and annual revenue. This transaction-based approach (also called a unit economics model) is more defensible to investors than a top-down market share estimate.
Revenue streams to model separately:
- Beverage sales (typically 60-70% of revenue for most cafés)
- Food and pastry sales (15-25%)
- Retail products: whole bean coffee, branded merchandise (5-10%)
- Catering and events (0-10%, highly location-dependent)
Average ticket size benchmarks by format:
| Format | Avg. Ticket Size | Daily Customer Count | Annual Revenue Estimate |
|---|---|---|---|
| Grab-and-go kiosk | $6-$8 | 150-250 | $330K-$730K |
| Small sit-down (20 seats) | $9-$12 | 80-130 | $260K-$570K |
| Medium café (40 seats) | $10-$14 | 130-200 | $475K-$1.02M |
| Large café (60+ seats) | $12-$16 | 200-350 | $876K-$2.04M |
These estimates assume 360 operating days per year and a single daily visit per customer. Adjust for your local market, hours of operation, and whether you capture a lunch crowd.
Seasonality adjustment: Most cafés see 15-25% higher revenue in Q4 (October-December) driven by holiday drinks, and a 10-20% dip in mid-summer unless you have strong cold-drink or food offerings. Build monthly seasonality multipliers into your model from day one.

Transaction-based revenue modeling: multiply daily customer count by average ticket size, then apply monthly seasonality multipliers.
Cost of Goods Sold: Ingredient Economics and Margin Targets
COGS (cost of goods sold) in a café context means the direct cost of every item you sell: coffee beans, milk, syrups, pastry ingredients, and packaging. Most well-run coffee shops aim to keep COGS between 25% and 35% of total revenue (Rise Accounting, 2026).
Here’s how COGS breaks down by product line:
- Espresso drinks: Coffee beans typically cost $0.50-$1.00 per drink; milk and syrups add $0.30-$0.60. Total ingredient cost per $5 latte: roughly $1.00-$1.60, or 20-32% COGS.
- Pastries and food: Wholesale pastry cost runs $1.00-$2.50 per item against a $3.50-$6.00 retail price, giving 25-40% COGS. Food items pull your blended COGS higher.
- Retail whole bean: Wholesale cost is typically 40-50% of retail price, making this a lower-margin category unless you roast in-house.
Waste and shrinkage add 2-5% to effective COGS. Model this explicitly: a café doing $500,000 in annual revenue with 3% waste loses $15,000 before a single customer walks in late.
Inventory turnover for a café should run 20-30 times per year (roughly every 12-18 days). Slower turnover signals over-ordering and increases spoilage costs.
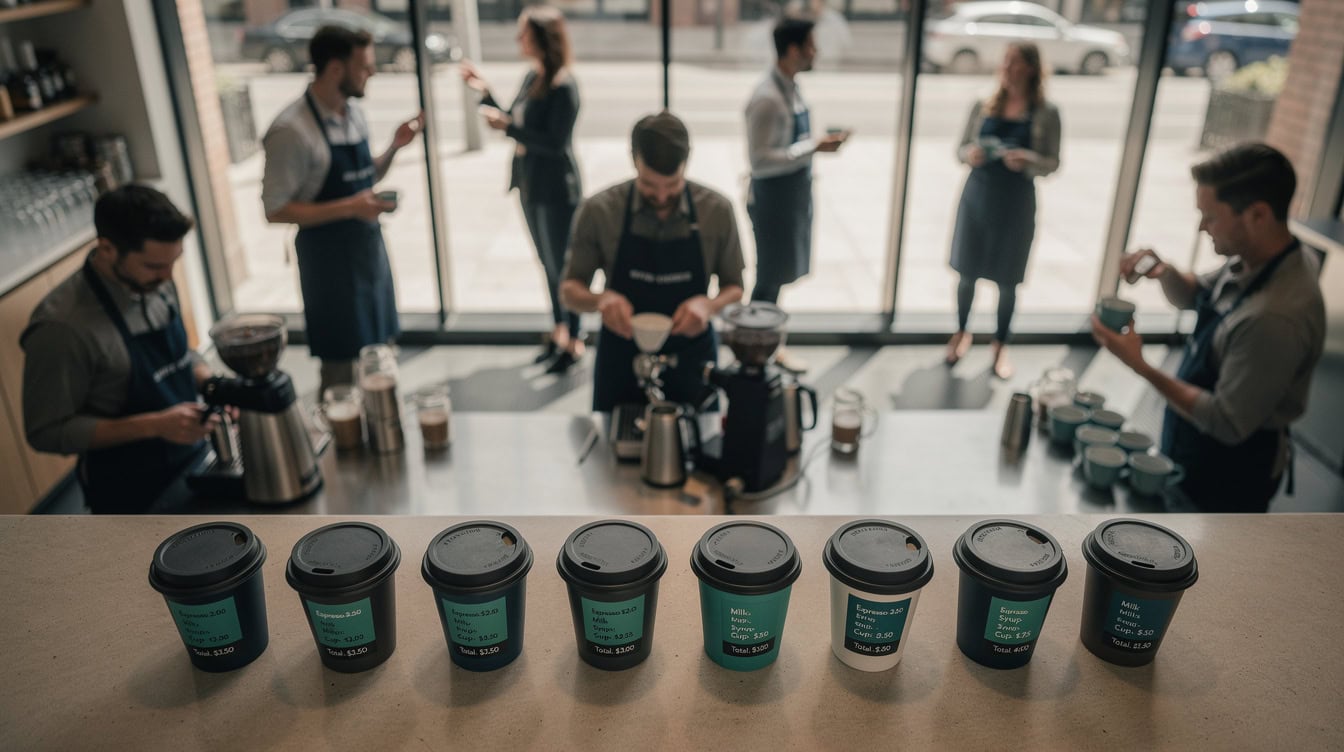
A well-priced latte carries 20-32% COGS; food items and retail products pull the blended rate toward the 25-35% target ceiling.
Operating Expense Structure: Labor, Occupancy, and Variable Costs
Operating expenses (OpEx) are the costs you incur to run the business beyond the direct cost of goods. For a café, four categories dominate the P&L (profit and loss statement, which summarizes revenue, costs, and profit over a period).
Labor (30-35% of revenue): This is almost always the largest single cost line. A typical small café employs 3-5 baristas plus a manager. At $15-$18/hour for baristas and $45,000-$60,000 for a manager, a 40-seat café with two baristas per shift and 70 weekly operating hours will spend $120,000-$160,000 per year on wages before payroll taxes and benefits. Add 20-25% for employer taxes and benefits to get your fully-loaded labor cost.
Rent and occupancy (10-15% of revenue): Downtown locations in major US cities run $50-$120 per square foot annually. A 1,200 sq ft café in a mid-tier urban market at $60/sq ft costs $72,000/year in base rent, plus NNN (triple net) charges for taxes, insurance, and maintenance that add 15-30% on top. Suburban strip-mall locations typically run $25-$45/sq ft.
Utilities (3-5% of revenue): Espresso machines, refrigeration, and HVAC are energy-intensive. Budget $1,500-$3,000/month for a medium café.
Marketing and customer acquisition (2-4% of revenue): New cafés typically spend more in year one (4-6%) to build awareness, then reduce to 2-3% as word-of-mouth and loyalty programs take over.
Equipment maintenance and repairs (1-2% of revenue): A commercial espresso machine service contract runs $500-$1,500/year. Budget separately for unexpected repairs.
Labor and COGS together consume 60-65% of revenue in a well-run café, leaving 8-12% for net profit at steady state.
Startup Capital Requirements: Equipment, Buildout, and Launch Costs
Startup capital for a coffee shop covers everything from the espresso machine to the first month’s payroll. Most independent cafés require $80,000-$300,000 to open, depending on location, size, and whether you’re building out a raw space or taking over an existing café.
Typical startup cost breakdown:
| Category | Low Estimate | High Estimate |
|---|---|---|
| Espresso machine (commercial) | $5,000 | $20,000 |
| Grinders (2-3 units) | $2,000 | $8,000 |
| Refrigeration and cold storage | $5,000 | $15,000 |
| POS system and software | $1,500 | $5,000 |
| Furniture and fixtures | $10,000 | $40,000 |
| Leasehold improvements / buildout | $20,000 | $100,000 |
| Licenses, permits, and legal | $2,000 | $8,000 |
| Initial inventory (2-4 weeks) | $3,000 | $8,000 |
| Working capital reserve (3 months) | $15,000 | $45,000 |
| Total | $63,500 | $249,000 |
Monthly cash burn during ramp-up: Most cafés operate at 40-60% of target revenue in months 1-3 as they build a customer base. If your target monthly revenue is $40,000 and your fixed costs are $28,000/month, you’ll burn $8,000-$14,000/month in the ramp-up phase. Your working capital reserve must cover at least 3 months of this gap.
Funding structure: Most independent café owners combine personal savings (30-40%), SBA loans (40-50%), and equipment financing (10-20%). The SBA 7(a) loan program (Small Business Administration, the US federal agency that supports small business lending) allows up to $5 million for qualified borrowers (U.S. Small Business Administration), with terms up to 10 years for working capital.
Total startup costs range from $63,500 to $249,000; the working capital reserve is the line most first-time owners underestimate.
Profit Margin Analysis: From Gross Profit to Net Income
A healthy coffee shop targets a net profit margin of 8-12% (Growexa, 2024). Net profit margin is net income divided by total revenue, expressed as a percentage. Here’s how the P&L layers build from revenue to net income.
Worked Example: 40-Seat Café, Year 2 Operations
Assumptions: 160 customers/day, $11 average ticket, 360 operating days, 30% COGS, 33% labor, 12% rent, 4% utilities, 3% marketing, 2% maintenance.
- Annual revenue: 160 × $11 × 360 = $633,600
- COGS (30%): $633,600 × 0.30 = $190,080
- Gross profit: $633,600 – $190,080 = $443,520 (70% gross margin)
- Labor (33%): $633,600 × 0.33 = $209,088
- Rent (12%): $633,600 × 0.12 = $76,032
- Utilities (4%): $633,600 × 0.04 = $25,344
- Marketing (3%): $633,600 × 0.03 = $19,008
- Maintenance (2%): $633,600 × 0.02 = $12,672
- Total OpEx: $342,144
- Net income: $443,520 – $342,144 = $101,376
- Net margin: $101,376 / $633,600 = 16%
This scenario hits the high end of the 8-12% benchmark because labor is well-controlled and the café has reached steady-state customer volume. In year one, with 60% of target volume, net margin would compress to roughly 2-4%.
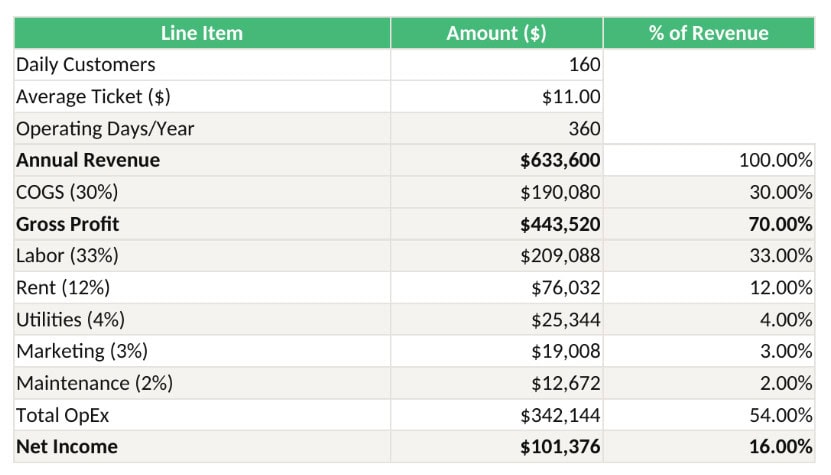
Net Income = Revenue − COGS − Labor − Rent − Utilities − Marketing − Maintenance. At 160 customers/day and $11 avg ticket, net income reaches $101,376 (16% margin).
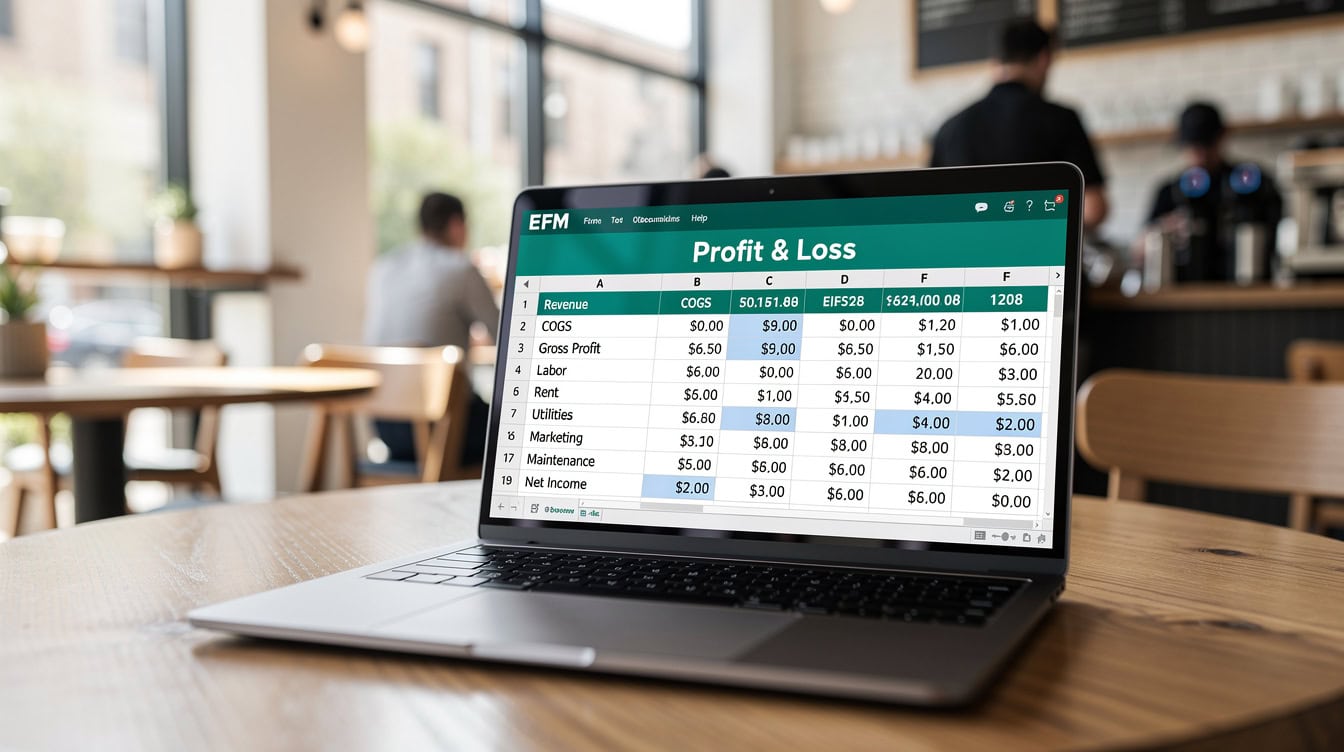
A 40-seat café at 160 customers/day and $11 average ticket can reach $101,376 net income in year 2 with disciplined cost control.
Break-Even Analysis: Units, Revenue, and Timeline to Profitability
Break-even analysis tells you exactly how many customers you need per day, or how much revenue per month, to cover all fixed and variable costs. This is one of the most scrutinized sections of any café business plan.
Break-even formula:
Break-Even Revenue = Fixed Costs / (1 – Variable Cost Ratio)
Where variable cost ratio = (COGS + variable labor) / revenue.
Using the example above:
- Monthly fixed costs: rent ($6,336) + fixed labor ($12,000) + utilities ($2,112) + maintenance ($1,056) = $21,504
- Variable cost ratio: COGS (30%) + variable labor (15%) = 45%
- Break-even monthly revenue: $21,504 / (1 – 0.45) = $21,504 / 0.55 = $39,098/month
- Break-even daily revenue: $39,098 / 30 = $1,303/day
- Break-even daily customers: $1,303 / $11 avg ticket = 119 customers/day
For a 40-seat café targeting 160 customers/day at steady state, break-even at 119 customers/day represents 74% of target volume. Most cafés reach that threshold between month 9 and month 18.
For financial feasibility analysis, always run three break-even scenarios: pessimistic (80% of projected volume), base (100%), and optimistic (120%). This gives investors a clear picture of downside protection.
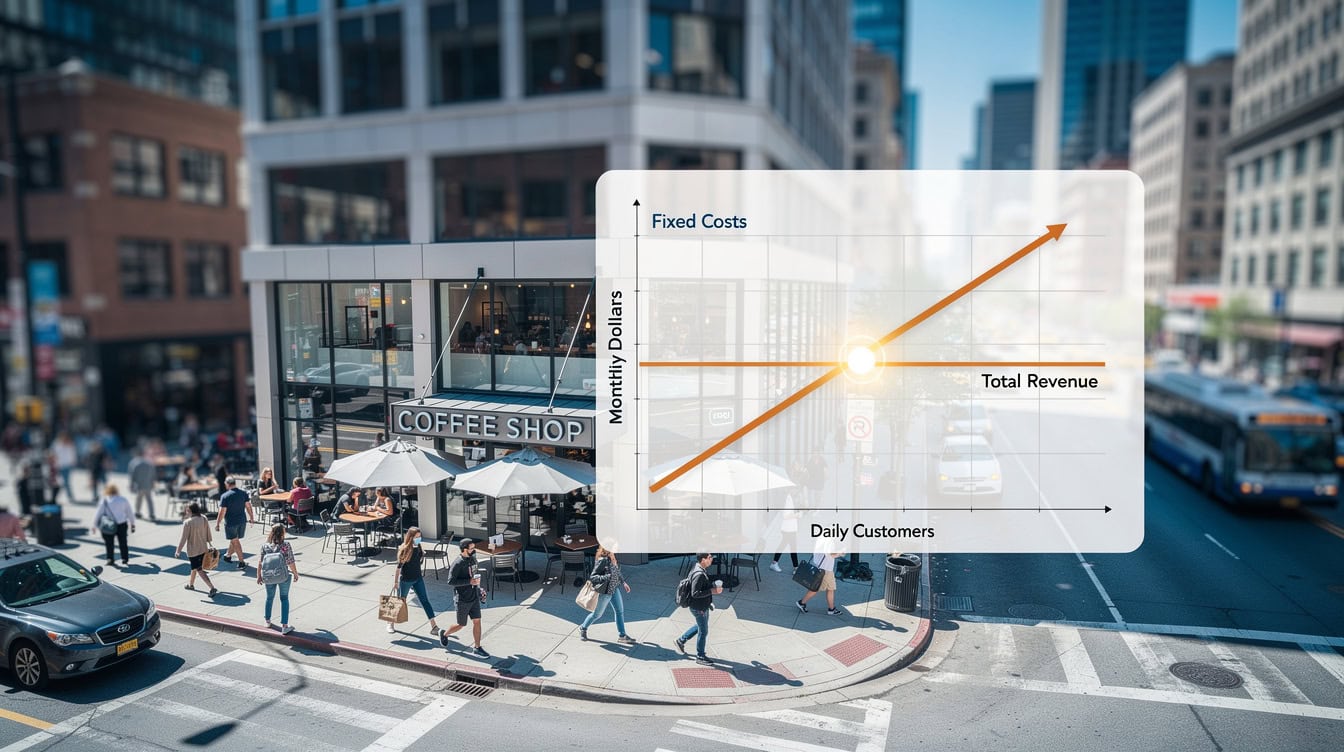
Break-even at 119 customers/day represents 74% of a 40-seat café’s target volume, typically reached between month 9 and month 18.
Cash Flow Modeling: Managing Working Capital and Seasonality
Cash flow modeling tracks when money actually enters and leaves your bank account, which differs from your P&L because of timing: you pay suppliers before customers pay you, and you pay rent on the 1st whether or not it was a good month.
Key cash flow line items for a café:
- Operating cash inflows: daily sales receipts (mostly immediate for café transactions)
- Operating cash outflows: payroll (bi-weekly), rent (monthly), supplier invoices (net 7-30 days), utilities (monthly)
- Investing cash outflows: equipment purchases, leasehold improvements
- Financing cash inflows/outflows: loan draws and repayments
Seasonality modeling: Build a monthly revenue multiplier table. A typical pattern for a US café:
| Month | Revenue Multiplier |
|---|---|
| January | 0.85 |
| February | 0.88 |
| March | 0.95 |
| April | 1.00 |
| May | 1.05 |
| June | 1.02 |
| July | 0.95 |
| August | 0.97 |
| September | 1.03 |
| October | 1.08 |
| November | 1.12 |
| December | 1.10 |
Apply these multipliers to your base monthly revenue to get seasonally adjusted projections. Your cash reserve must cover the January-February trough, which often hits 3-4 weeks after the holiday revenue spike.
For 5-year financial projections, model year-one cash flow monthly and years 2-5 quarterly. Investors want to see that you understand the timing of cash, not just the annual totals.
Seasonality swings of 15-25% between peak and trough months make monthly cash flow modeling essential for working capital planning.
Independent vs. Franchise Financial Comparison
The choice between opening an independent café and buying a franchise changes nearly every line of your financial model. Here’s a direct comparison of the key financial assumptions.
| Financial Metric | Independent Café | Franchise Café |
|---|---|---|
| Startup cost | $80K-$250K | $150K-$500K+ |
| Royalty fees | None | 5-8% of revenue |
| Marketing fees | Self-directed (2-4%) | Required fund (1-3%) |
| Brand recognition | Build from zero | Immediate |
| COGS | Negotiated independently | Supplier mandated (often higher) |
| Net margin (mature) | 8-15% | 6-10% |
| Break-even timeline | 12-24 months | 9-18 months |
| UK turnover benchmark | £100K-£150K/year | Varies by brand |
The UK data from Sage (2023) showing £57,000 in annual profit for independent cafés on £100K-£150K turnover implies a 38-57% gross margin, but this figure likely reflects owner-operator compensation included in profit rather than a pure net income figure. Adjust for your own salary expectations when comparing.
Franchise models offer faster ramp-up and lower customer acquisition costs, but royalty fees (5-8% of revenue) permanently compress net margins. On $600,000 in annual revenue, a 6% royalty costs $36,000/year, which is roughly 35% of the net income a well-run independent would generate. The SBA reports that the average SBA 7(a) loan size across all small business sectors was approximately $479,685 in fiscal year 2023 (U.S. Small Business Administration), giving useful context for how much debt financing café owners typically seek relative to total startup costs.
For franchise-specific modeling, explore franchise model templates that account for royalty structures and brand fee schedules.
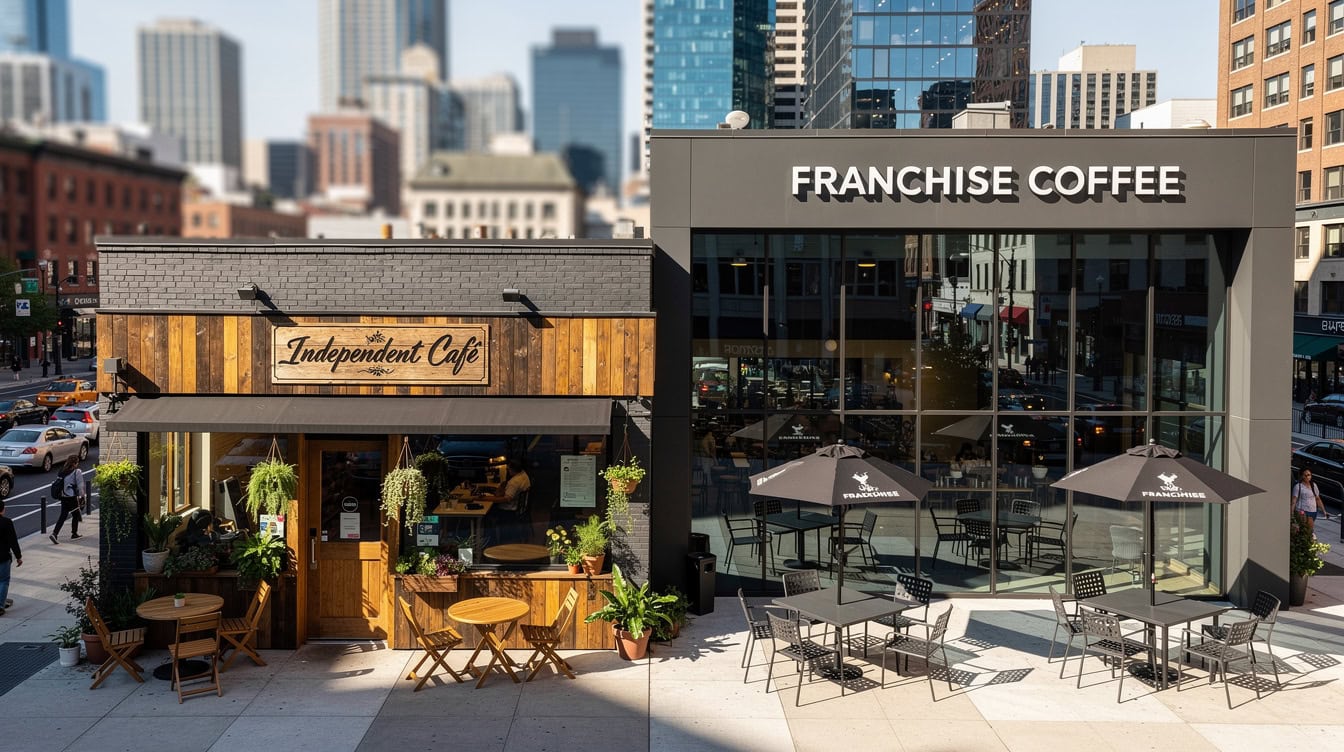
A 6% royalty fee on $600,000 revenue costs $36,000/year, roughly 35% of the net income a comparable independent would generate.
Building Your Coffee Shop Financial Model: Step-by-Step
A complete coffee shop financial model integrates three financial statements: the P&L (income statement), the cash flow statement, and the balance sheet. Each feeds the others, and investors expect all three.
Step 1: Set your revenue assumptions. Define daily customer count by month (using seasonality multipliers), average ticket size by daypart (morning rush vs. afternoon), and revenue mix by category (beverages, food, retail).
Step 2: Build your COGS schedule. Apply category-level COGS percentages (beverages at 28%, food at 35%, retail at 45%) to each revenue stream. Sum to a blended COGS rate and verify it falls in the 25-35% target range.
Step 3: Model labor in detail. List every role, hourly rate, and weekly hours. Calculate gross wages, then apply a 22% employer burden (payroll taxes, workers’ comp, benefits) to get fully-loaded labor cost.
Step 4: Enter fixed operating expenses. Rent, insurance, software subscriptions, and loan repayments go here. These don’t change with volume.
Step 5: Calculate monthly P&L. Revenue minus COGS equals gross profit. Gross profit minus total OpEx equals EBITDA (earnings before interest, taxes, depreciation, and amortization, a common profitability metric). Subtract interest, depreciation, and taxes to reach net income.
Step 6: Build the cash flow statement. Start with net income, add back depreciation (a non-cash charge), and adjust for changes in working capital (inventory, accounts payable).
Step 7: Complete the balance sheet. Assets (cash, equipment, inventory) must equal liabilities (loans, accounts payable) plus equity (owner investment plus retained earnings). If they don’t balance, find the error before sharing with investors.
Step 8: Run scenario analysis. Create three versions of your model: base case, downside (20% lower volume), and upside (20% higher volume). Show investors you’ve stress-tested your assumptions.
For a ready-built framework that handles all three statements, the startup financial model templates at EFM include pre-built scenario toggles and industry-benchmarked assumption sets.
Frequently Asked Questions
How much does it cost to open a coffee shop?
Opening a coffee shop typically costs between $80,000 and $300,000 for an independent location, depending on size, city, and whether you’re building out a raw space. The largest single variable is leasehold improvements: a raw retail space in a high-traffic urban area can cost $50,000-$100,000 to convert into a functional café. Equipment is the second-largest line: a commercial La Marzocca or Synesso espresso machine alone runs $8,000-$20,000. Budget a working capital reserve equal to at least 3 months of fixed costs, typically $15,000-$45,000, to cover the ramp-up period before you reach break-even customer volume.
What is a realistic net profit margin for a coffee shop?
A healthy, well-run coffee shop targets a net profit margin of 8-12% (Growexa, 2024). Margins below 6% usually signal a labor or rent problem: either the café is overstaffed relative to volume, or the rent-to-revenue ratio exceeds 15%. Margins above 15% are achievable for owner-operated cafés where the owner counts as labor but doesn’t draw a separate salary. For financial modeling purposes, use 8-10% as your base case net margin in year 2-3, and show investors how you reach it by controlling COGS below 30% and labor below 33%.
How do I calculate break-even for a coffee shop?
Use the formula: Break-Even Revenue = Fixed Costs / (1 – Variable Cost Ratio). First, identify your monthly fixed costs (rent, fixed salaries, insurance, loan payments). Then calculate your variable cost ratio by adding COGS percentage and variable labor percentage. For example, if fixed costs are $20,000/month and your variable cost ratio is 45%, break-even revenue is $20,000 / 0.55 = $36,364/month. Divide by your average ticket size to get the daily customer count you need. A 40-seat café with an $11 average ticket needs $36,364 / 30 days / $11 = approximately 110 customers per day to break even.
What percentage of revenue should labor cost in a café?
Labor should run 30-35% of revenue for a well-managed café. This includes baristas, a manager, and any kitchen or support staff, plus the employer burden of roughly 20-22% on top of gross wages (covering payroll taxes, workers’ compensation, and benefits). In the US, barista wages typically run $13-$18/hour depending on state minimum wage laws and local market rates. A café doing $600,000/year in revenue should target a total labor spend of $180,000-$210,000. If you’re the owner-operator and not drawing a salary, your labor percentage will look artificially low: normalize it by adding a market-rate owner salary of $50,000-$70,000 before comparing to benchmarks.
How long does it take for a coffee shop to become profitable?
Most independent cafés reach monthly cash flow break-even between month 9 and month 18, and cumulative profitability (recovering the initial investment) between year 2 and year 4. The ramp-up timeline depends on three factors: how quickly you build a regular customer base, how close your opening-month volume is to break-even, and how well you control costs during the low-volume period. Cafés in high-foot-traffic locations (transit hubs, office districts) typically ramp faster, reaching 70-80% of target volume within 3-6 months. Destination cafés in residential neighborhoods may take 12-18 months to build the same volume.
What financial statements do investors expect in a café business plan?
Investors expect three integrated financial statements: a monthly P&L for year 1 and annual P&L for years 2-5, a monthly cash flow statement for year 1, and a balance sheet at the end of each year. Beyond the statements themselves, investors want to see the assumption sheet: the daily customer count, average ticket size, COGS percentages, and wage rates that drive every number. A model without a visible assumption sheet is a red flag. Include a sensitivity table showing how net income changes if customer count drops 20% or COGS rises 5 percentage points. This demonstrates financial literacy and builds investor confidence.
How does a franchise café model differ financially from an independent?
The key financial difference is the royalty fee, which typically runs 5-8% of gross revenue for major café franchises. On $600,000 in annual revenue, a 6% royalty costs $36,000/year, permanently reducing net margin by 6 percentage points compared to an equivalent independent. Franchises also require a marketing fund contribution of 1-3% of revenue. The offset is faster ramp-up: franchise brand recognition typically reduces customer acquisition costs and shortens the break-even timeline by 3-6 months. Startup costs are also higher for franchises ($150,000-$500,000+) due to franchise fees ($20,000-$50,000) and mandated fit-out standards. Model both scenarios side by side before committing.
Build Your Café Model with Confidence
A coffee shop financial model is not a spreadsheet exercise. It’s the document that tells investors, lenders, and your future self whether this business can actually work. Start with realistic daily customer counts, hold COGS to 25-35% of revenue, keep labor below 33%, and stress-test every assumption with a downside scenario.
The numbers in this guide give you the benchmarks. The model gives you the structure. For financial projections that connect all three statements and include pre-built scenario planning, I recommend downloading the EFM Coffee Shop Financial Model with industry-benchmarked assumptions, monthly cash flow tracking, and investor-ready outputs built in. It cuts the build time from weeks to hours and ensures your model holds up under due diligence.

























































