
0 ITEMS

China Solar Will Quadruple to 4,600 GW by 2031

China is not just the largest solar market in the world. It is the market that sets the price of solar for everyone else. Its renewable base is expanding faster than any major economy, solar already makes up more than half of that mix, and the cost of building it has fallen below coal in the country’s sunniest provinces. For institutional investors, that combination of scale and grid parity is rare, but the returns hinge on variables most global models underprice: curtailment in the western provinces, the phase-out of feed-in subsidies, and currency exposure on RMB-denominated cash flows. This guide works through the capacity trajectory to 2031, the LCOE and IRR math behind a representative utility-scale project, the financing structures institutional capital actually uses, and how to size a China position inside a diversified renewable portfolio without taking on hidden concentration risk.
Key Takeaways
- China’s total renewable installed capacity grows from 2,640 GW in 2026 to 4,600 GW by 2031 at an 11.76% CAGR, the fastest sustained buildout of any major economy.
- Solar holds 51.5% of China’s renewable technology mix, implying roughly 1,360 GW of solar capacity in 2026 and approximately 2,370 GW by 2031.
- Utility-scale projects control 82.4% of installed capacity, making grid-connected PPA structures the dominant financing vehicle for institutional capital.
- Global solar capacity scales from 2.92 TW in 2026 to 7.25 TW by 2031 at a 19.91% CAGR, with China supplying both domestic demand and export-grade modules.
- Benchmark LCOE for utility-scale solar in China’s high-irradiance zones has fallen below CNY 0.20/kWh (~USD 0.028/kWh), approaching or beating coal in most provinces.
- Typical project-finance debt-to-equity ratios run 70:30 to 75:25, with 15-to-20-year loan tenors aligned to PPA contract lengths.
- IRR for well-structured utility-scale solar in China ranges from 6% to 10% unlevered, widening to 10%–15% levered under favorable PPA and curtailment assumptions.
China Renewable Energy Market Overview: 2026 Baseline and 2031 Projections
China’s renewable energy sector enters 2026 as the world’s largest installed base, and the trajectory through 2031 is steeper than most institutional models have priced in. Installed renewable capacity reached 2,640 GW in 2026, up from 2,338 GW in 2025, a 12.9% year-on-year jump that outpaced consensus forecasts (Mordor Intelligence). In the same report, the base is projected to reach 4,600 GW by 2031 at an 11.76% CAGR.
For project developers and equity investors, the 12.9% single-year growth rate matters as much as the five-year CAGR. It signals that grid connection queues, module procurement pipelines, and EPC contractor capacity are all under acute pressure, which directly affects construction timelines and CapEx per MW. Developers who lock in EPC contracts and grid interconnection agreements in 2026 capture a structural cost advantage over latecomers.
The policy backdrop reinforces the trajectory. China’s 14th Five-Year Plan targets and the emerging 15th Five-Year Plan framework both embed renewable capacity mandates that translate into guaranteed offtake structures for qualifying projects. Bankability, in this context, is less about counterparty credit risk and more about curtailment exposure and PPA pricing floors.

China added 302 GW of renewable capacity in a single year (2025–2026), a 12.9% YoY increase that signals sustained pipeline pressure through 2031.
Solar Energy’s 51.5% Technology Share: Capacity Buildout and Market Composition
Solar is the dominant technology in China’s renewable mix, and its share is still growing. Solar energy held 51.5% of the Chinese renewable energy market by technology in 2025 (Mordor Intelligence), translating to approximately 1,360 GW of solar-specific installed capacity in 2026 and a projected ~2,370 GW by 2031 when applied to the total capacity forecast.
The technology split matters for financial modeling because solar and wind carry different capacity factors, curtailment profiles, and O&M cost structures. Solar in China’s top-tier irradiance zones (Xinjiang, Inner Mongolia, Qinghai, Gansu) achieves capacity factors of 18%–22%, while eastern coastal provinces average 14%–17%. These ranges feed directly into annual energy yield (AEY) calculations, which underpin every revenue line in a project DCF model.
Distributed generation (rooftop commercial/industrial and residential) accounts for the remaining capacity outside utility-scale, but its financing structure differs sharply. Distributed projects typically use shorter-tenor loans (5–10 years), rely on net-metering or self-consumption economics rather than grid PPAs, and carry higher per-MW development costs due to fragmented site aggregation.
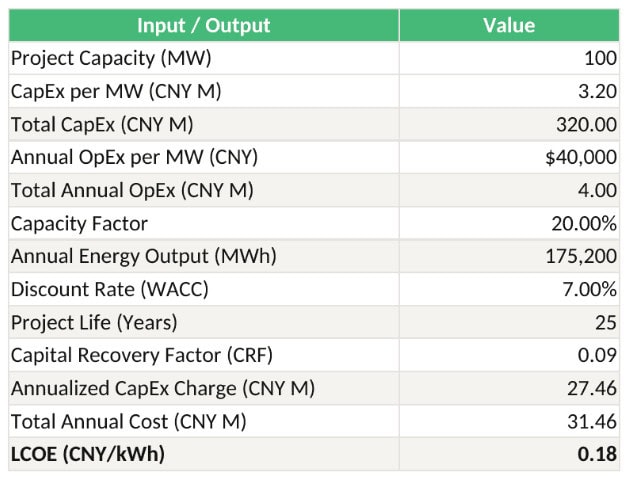
LCOE = (CapEx × CRF + Annual OpEx) / Annual Energy Output. At CNY 3.2M/MW CapEx, 20% CF, and 7% WACC, LCOE = ~CNY 0.180/kWh, confirming grid parity in high-irradiance zones.
Utility-Scale Dominance (82.4%): Financial Modeling for Grid-Connected Projects
Utility-scale projects define the investment opportunity in China solar, and their financial characteristics are well-suited to institutional capital. Utilities controlled 82.4% of China’s installed renewable capacity in 2025 (Mordor Intelligence), and that share is structurally stable because grid-scale economics improve with size while distributed generation faces permitting and aggregation friction.
A standard DCF model for a utility-scale solar project in China uses the following structure:
- Revenue: AEY (MWh) × PPA price (CNY/MWh), adjusted for annual degradation (typically 0.5%–0.7% per year for monocrystalline PERC or TOPCon modules)
- Operating costs: O&M at CNY 30,000–50,000/MW/year, land lease, insurance, and grid access fees
- Depreciation: Straight-line over 20 years for tax purposes under Chinese enterprise income tax rules
- Debt service: Based on the capital stack (see Section 7)
- Terminal value: Residual land and equipment value, or re-powering option value, at year 25
PPA pricing for utility-scale solar in China’s competitive bidding rounds has settled in the CNY 0.18–0.30/kWh range depending on province and grid region, with lower prices in high-irradiance western provinces and higher prices in eastern demand centers. Projects in Xinjiang and Inner Mongolia face higher curtailment risk (historically 5%–15% in peak generation seasons), which must be modeled as a revenue haircut.

Utility-scale projects dominate China’s solar capacity mix at 82.4%, driving the project-finance structures that institutional capital targets.
Global Context: China’s Position in the 2.92 TW to 7.25 TW Solar Expansion
China’s domestic buildout sits inside a global solar expansion that is itself historically unprecedented. The global solar energy installed base is expected to grow from 2.92 TW in 2026 to 7.25 TW by 2031 at a 19.91% CAGR (Mordor Intelligence). Solar already accounted for about 56.1% of global renewable capacity in 2025, with more than 2.5 TW installed worldwide (PV Magazine / GlobalData).
The Asia-Pacific region leads global deployment: installed solar capacity in APAC reached 1,550 GW in 2025 (PV Magazine / GlobalData), with China accounting for the majority of that base. For institutional allocators building multi-regional renewable portfolios, this concentration creates both opportunity and correlation risk. A fund with heavy APAC solar exposure is effectively taking a view on Chinese grid policy, polysilicon supply chains, and CNY/USD exchange rates simultaneously.
Chinese module manufacturers (LONGi, JA Solar, Trina, Canadian Solar) supply roughly 80% of global module demand, meaning cost curves in China propagate directly to project economics in Europe, the US, and emerging markets. Investors in Chinese solar developers, therefore, hold an indirect option on global LCOE compression. For investors who need to translate this global context into a defensible domestic forecast, the China Solar PV Market Study 2026-2031 provides the capacity, technology-mix, and segment data that anchors the financial modeling throughout this analysis.
LCOE Analysis Framework for Chinese Solar Projects 2026–2031
LCOE (Levelized Cost of Energy, the all-in cost per MWh of electricity produced over a project’s life) is the primary metric for comparing solar competitiveness against other generation technologies and across geographies. For Chinese utility-scale solar, LCOE is calculated as:
LCOE = (Total Lifetime Costs) / (Total Lifetime Energy Output)
Or in annualized form:
LCOE = (CapEx × CRF + Annual OpEx) / (Capacity × CF × 8,760)
Where CRF (Capital Recovery Factor) = r(1+r)^n / ((1+r)^n – 1), r = discount rate, n = project life in years, and CF = capacity factor.
Here’s the math for a representative 100 MW project in Inner Mongolia (2026):
- CapEx: CNY 3.2M/MW × 100 MW = CNY 320M total
- Annual OpEx: CNY 40,000/MW × 100 MW = CNY 4.0M
- Capacity factor: 20%
- Annual energy output: 100 MW × 20% × 8,760 hours = 175,200 MWh
- Discount rate: 7% (blended WACC for a 70:30 leveraged structure)
- Project life: 25 years
- CRF at 7% over 25 years: 0.0858
- Annualized CapEx charge: CNY 320M × 0.0858 = CNY 27.5M
- Total annual cost: CNY 27.5M + CNY 4.0M = CNY 31.5M
- LCOE: CNY 31.5M / 175,200 MWh = CNY 0.180/MWh × 1,000 = CNY 0.180/kWh (~USD 0.025/kWh)
This figure sits below the benchmark coal-fired generation cost of CNY 0.25–0.35/kWh in most Chinese provinces, confirming grid parity in high-irradiance zones. Module cost trends reinforce the downward trajectory: polysilicon prices fell from over USD 30/kg in 2022 to below USD 6/kg by late 2024, and module prices have tracked below USD 0.10/W for standard monocrystalline products. According to IRENA’s renewable power generation cost data, the global weighted-average LCOE of utility-scale solar PV fell by 90% between 2010 and 2023 (IRENA), and further learning-curve compression of 15%–20% through 2031 is consistent with those historical solar cost reduction rates.

Solar LCOE in China’s high-irradiance zones crossed below coal-fired generation cost around 2023–2024 and continues to compress through 2031 as module costs decline.
IRR and Cash Flow Modeling: Sensitivity to Policy, Curtailment, and PPA Pricing
IRR (Internal Rate of Return, the discount rate at which a project’s net present value equals zero) is the primary return metric for equity investors in Chinese solar projects. Unlevered project IRR for utility-scale solar in China ranges from 6% to 10%, with levered equity IRR reaching 10%–15% under a 70:30 debt structure at 4.5%–5.5% onshore RMB loan rates.
The three variables that move IRR most significantly are PPA price, curtailment rate, and subsidy status. The table below shows levered equity IRR across a 3×3 sensitivity matrix:
| PPA Price (CNY/kWh) | Curtailment 5% | Curtailment 10% | Curtailment 15% |
|---|---|---|---|
| 0.25 | 14.2% | 12.8% | 11.3% |
| 0.22 | 12.1% | 10.7% | 9.2% |
| 0.18 | 9.4% | 8.0% | 6.5% |
Assumptions: 100 MW project, Inner Mongolia, 20% CF, CNY 3.2M/MW CapEx, 70:30 D/E, 5.0% debt rate, 25-year life, no subsidy.
Policy subsidy scenarios add a further layer. Projects approved under China’s renewable energy subsidy catalog (now largely phased out for new utility-scale projects) carried feed-in tariff premiums of CNY 0.05–0.10/kWh above market price. The phase-out shifts IRR dependency entirely to PPA pricing and curtailment management, making grid region selection and offtake contract negotiation the primary value-creation levers for developers.
For sensitivity analysis in a financial model, the key input ranges to stress-test are: PPA price ±15%, curtailment rate 0%–20%, CapEx ±10%, and discount rate ±100 bps. These four variables explain over 90% of IRR variance in a well-specified project model.
Financing Structures and Capital Stack for Chinese Solar Investments
Chinese solar project finance follows a project-finance structure (ring-fenced SPV with non-recourse or limited-recourse debt) that will be familiar to infrastructure investors globally, with some China-specific features. Typical debt-to-equity ratios run 70:30 to 75:25, with onshore RMB loans from policy banks (China Development Bank, Agricultural Development Bank) or commercial banks at 4.5%–5.5% over 15–20 year tenors.
Construction financing typically uses a short-term bridge loan (12–18 months) that converts to long-term project debt upon commercial operation date (COD). CapEx per MW for utility-scale ground-mount solar in China has fallen to CNY 3.0–3.5M/MW (approximately USD 420,000–490,000/MW) as of 2026, down from CNY 5.0M/MW in 2019. Construction timelines for a 100–200 MW project run 9–15 months from financial close to COD.
Working capital requirements during construction are modest relative to total CapEx (typically 5%–8%), but developers must fund grid connection costs separately. Grid connection fees in China vary by province and voltage level, ranging from CNY 50,000 to CNY 200,000/MW, and are sometimes capitalized into the project cost base.
For offshore or cross-border investors, currency risk is a material consideration. RMB-denominated revenues against USD-denominated equity returns require either natural hedging (RMB equity investment) or explicit FX hedging instruments, which add 50–150 bps to the effective cost of capital. Global new renewable energy investment reached USD 623 billion in 2023 (IRENA), underscoring the scale of capital flows that project-finance practitioners must navigate when structuring cross-border solar deals.

A 70:30 debt-to-equity structure with 15–20 year policy bank tenors is the standard capital stack for utility-scale solar in China, enabling levered equity IRR of 10%–15%.
Portfolio Allocation Strategy: Weighting China Solar in Multi-Regional Renewable Funds
For institutional allocators building multi-regional renewable energy portfolios, China solar offers the largest single-country opportunity set but also the highest concentration of policy and regulatory risk. APAC installed solar capacity reached 1,550 GW in 2025 (PV Magazine / GlobalData), and China represents roughly 85%–90% of that base, meaning an APAC-weighted renewable fund is de facto a China solar fund unless actively diversified.
A practical portfolio construction framework weights China solar exposure against three risk dimensions:
- Policy risk: Subsidy phase-out, curtailment regulation, and grid priority rules. Mitigated by selecting projects in provinces with low historical curtailment (Guangdong, Zhejiang, Jiangsu) and long-term PPA contracts with state-owned utilities.
- Currency risk: RMB/USD volatility. Mitigated by matching liability currency to revenue currency (RMB equity) or using cross-currency swaps.
- Concentration risk: Single-country exposure. Mitigated by pairing China solar with India, Southeast Asia, or MENA solar assets, which carry different regulatory cycles and demand drivers.
A 30%–40% China solar allocation within a diversified APAC renewable fund is defensible for institutional investors with a 10-year horizon, given the CAGR differential between China (11.76%) and global solar (19.91%) and the depth of the investable project pipeline. Allocations above 50% require explicit policy risk mitigation at the portfolio level.
Frequently Asked Questions
What is the projected solar installed capacity in China by 2031?
Applying solar’s 51.5% technology share to China’s total renewable capacity forecast of 4,600 GW by 2031 yields approximately 2,370 GW of solar-specific installed capacity. This projection is based on Mordor Intelligence data showing China’s total renewable base growing from 2,640 GW in 2026 to 4,600 GW in 2031 at an 11.76% CAGR. The actual figure will depend on whether solar’s share of the mix expands further (likely, given continued module cost compression) or whether wind and storage capture a larger share of new additions. For financial modeling purposes, a range of 2,200–2,500 GW by 2031 is a reasonable sensitivity band.
How do I calculate LCOE for a utility-scale solar project in China?
LCOE equals total annualized costs divided by annual energy output. The formula is: LCOE = (CapEx × CRF + Annual OpEx) / (Capacity × CF × 8,760), where CRF = r(1+r)^n / ((1+r)^n – 1). For a 100 MW project in Inner Mongolia with CNY 3.2M/MW CapEx, 20% capacity factor, CNY 40,000/MW OpEx, 7% discount rate, and 25-year life, LCOE works out to approximately CNY 0.180/kWh (USD 0.025/kWh). This is below coal-fired generation cost in most Chinese provinces, confirming grid parity. The key drivers of LCOE sensitivity are CapEx per MW (±10% moves LCOE by ~8%) and capacity factor (±2 percentage points moves LCOE by ~10%).
What IRR should investors expect from utility-scale solar in China?
Unlevered project IRR for utility-scale solar in China ranges from 6% to 10%, depending on province, PPA price, and curtailment exposure. Levered equity IRR, using a 70:30 debt-to-equity structure at 5.0% onshore RMB debt cost, ranges from 10% to 15% under favorable conditions (PPA at CNY 0.25/kWh, curtailment below 5%). At CNY 0.18/kWh PPA pricing and 15% curtailment, levered IRR compresses to approximately 6.5%. The subsidy phase-out for new projects means IRR is now almost entirely a function of negotiated PPA price and grid region curtailment history, making due diligence on grid connection quality a critical pre-investment step.
What financing structure is typical for Chinese solar projects?
Chinese utility-scale solar projects use a project-finance SPV structure with 70:30 to 75:25 debt-to-equity ratios. Debt comes primarily from policy banks (China Development Bank, Agricultural Development Bank) or commercial banks at 4.5%–5.5% interest rates over 15–20 year tenors, aligned to PPA contract lengths. Construction is funded via a 12–18 month bridge loan that converts to long-term project debt at COD. CapEx per MW has fallen to CNY 3.0–3.5M/MW as of 2026. Foreign investors typically structure equity through a WFOE (Wholly Foreign-Owned Enterprise) or joint venture, with RMB equity investment preferred to avoid FX hedging costs of 50–150 bps annually.
How does curtailment affect solar project returns in China?
Curtailment (the forced reduction of solar output by grid operators when supply exceeds transmission capacity) is the single largest operational risk for utility-scale solar in China’s western provinces. Historical curtailment rates in Xinjiang and Gansu have reached 10%–20% in peak generation seasons, directly reducing annual energy yield and revenue. A 10% curtailment rate on a project with CNY 0.22/kWh PPA pricing reduces levered IRR by approximately 1.4 percentage points compared to zero curtailment, based on the sensitivity table in this article. Investors should require curtailment compensation clauses in PPA contracts and prioritize provinces with grid infrastructure investment programs that reduce curtailment risk over the project’s 25-year life.
How should institutional investors size China solar within a renewable energy portfolio?
A 30%–40% China solar allocation within a diversified APAC or global renewable fund is defensible for investors with a 10-year horizon. China’s 11.76% renewable CAGR and the depth of the utility-scale project pipeline justify meaningful exposure, but concentration above 50% introduces correlated policy risk across positions. Diversification into India (strong solar growth, different regulatory cycle), Southeast Asia (Vietnam, Philippines), and MENA (Saudi Arabia, UAE) provides natural hedging against China-specific curtailment regulation or subsidy policy shifts. Currency matching (RMB equity for RMB revenue projects) eliminates the largest single source of return volatility for cross-border allocators.
What is the global solar market size in 2026 and how does China fit in?
The global solar installed base reaches 2.92 TW in 2026 and is projected to grow to 7.25 TW by 2031 at a 19.91% CAGR, according to Mordor Intelligence. China’s approximately 1,360 GW of solar capacity in 2026 represents roughly 47% of the global total, making it by far the largest single-country market. APAC as a whole held 1,550 GW of installed solar capacity in 2025, confirming the region’s dominance. For global fund managers, this concentration means that module pricing, polysilicon supply, and Chinese grid policy are global solar market variables, not just domestic ones. A supply disruption or policy reversal in China propagates to project economics in every other market within 12–18 months.
Conclusion
China’s solar market from 2026 to 2031 presents one of the most quantifiable large-scale investment opportunities in infrastructure finance. The numbers are unambiguous: 11.76% renewable CAGR, 51.5% solar technology share, 82.4% utility-scale dominance, and LCOE already below coal in high-irradiance provinces. The financial modeling frameworks for IRR, LCOE, and DCF are well-established, and the capital stack structures are familiar to any project finance practitioner. The primary risks, curtailment exposure and PPA pricing compression, are modelable and manageable through contract structure and geographic selection.
To pressure-test your investment thesis before committing capital, check out our library of solar financial models — purpose-built for utility-scale projects in China and other high-growth markets. They run IRR, LCOE, and cash flow scenarios, with ready-made sensitivity tables for policy risk, curtailment, and PPA pricing, and model the full capital stack from construction bridge through long-term project debt.
























































