
0 ITEMS

Hair Salon Excel Spreadsheet: Track Finances & Profit
A hair salon Excel spreadsheet works best as seven linked sheets — revenue, expenses, payroll, inventory, cash flow, client metrics, and a dashboard — because that structure captures the three things generic templates miss: commission splits, backbar product costs, and tip income. Those are the line items that most often distort a salon’s true profitability. This guide builds that workbook from scratch, with the exact formula for each sheet, the labor-cost ratio every owner should watch, and a full worked month you can replicate today. Start with the Revenue Tracker and Payroll Calculator, then add the Cash Flow Projection before your next payroll run.
Key Takeaways
- Labor costs consume 45–55% of total salon operating expenses, so a single miscalculated commission formula can erase your monthly profit.
- 82% of business failures cite poor cash flow management as a contributing factor — a 13-week rolling cash flow projection in Excel directly addresses this risk.
- The average U.S. hair salon generates $245,000 in annual revenue; your Excel workbook should benchmark every KPI against this figure.
- Small businesses that regularly review financial statements are 2.5 times more likely to be profitable than those that don’t — a monthly dashboard review takes under 30 minutes.
- A 7-sheet Excel workbook (revenue, expenses, payroll, inventory, cash flow, client metrics, dashboard) covers every financial dimension of a salon without requiring accounting software.
- Salons using dedicated tracking software report 15–25% revenue increases after adoption — Excel is the right starting point, but know the trigger to upgrade.
Why Hair Salons Need Specialized Financial Tracking
Generic business templates fail salon owners because they ignore the service-labor economics that define the industry. A retail store tracks cost of goods sold as its primary expense driver. A salon’s primary driver is labor — and that labor is priced, scheduled, and compensated in ways that require dedicated formulas.
U.S. consumer spending at hair, nail, and personal care salons totaled approximately $62.2 billion in 2022 according to U.S. Bureau of Economic Analysis personal consumption data, confirming the market is large enough to reward financially disciplined operators. Yet only 40% of small businesses are profitable, 30% break even, and 30% consistently lose money, according to Small Business Trends’ 2019 survey of small business profitability — a split that reflects financial management quality more than market opportunity.
Salon-specific tracking matters because:
- Revenue has three streams: service income, retail product sales, and tip income. Each carries different tax treatment and margin profiles.
- Labor is both fixed and variable: a stylist on salary is a fixed cost; one on commission is variable. Your formulas must handle both.
- Inventory has two categories: backbar products consumed during services (a cost of service delivery) and retail products sold to clients (a cost of goods sold with markup).
A spreadsheet built for a restaurant or a consulting firm won’t capture these distinctions. The 7-sheet workbook below does.
The 7-Sheet Excel Workbook Structure for Salons
The complete salon financial workbook contains seven sheets, each with a defined purpose and linked formulas that feed the master dashboard. Build them in this order so each sheet can reference the previous one.
| Sheet Name | Primary Purpose | Key Output |
|---|---|---|
| 1. Revenue Tracker | Log service, retail, and tip income daily | Monthly gross revenue by category |
| 2. Expense Log | Categorize all operating costs | Monthly expense totals by category |
| 3. Payroll Calculator | Compute wages, commissions, and payroll tax | Total labor cost and labor % of revenue |
| 4. Inventory Tracker | Monitor backbar usage and retail stock | COGS, reorder alerts, retail margin |
| 5. Cash Flow Projection | 13-week rolling cash position | Weekly ending cash balance |
| 6. Client Metrics | Track average ticket, visit frequency, retention | Client lifetime value (CLV) |
| 7. Dashboard | Visualize all KPIs in one view | Profit margin, cash runway, revenue vs. target |
Each sheet uses named ranges (defined via Formulas > Name Manager in Excel) so the Dashboard can pull data with readable formulas like =Revenue_Monthly instead of =Sheet1!B47. Microsoft’s Excel specifications and limits documentation confirms the number of sheets in a workbook is limited only by available memory, so you have ample room to expand this 7-sheet structure as your salon grows.
Revenue Tracking Sheet: Service Income, Retail Sales, and Tips
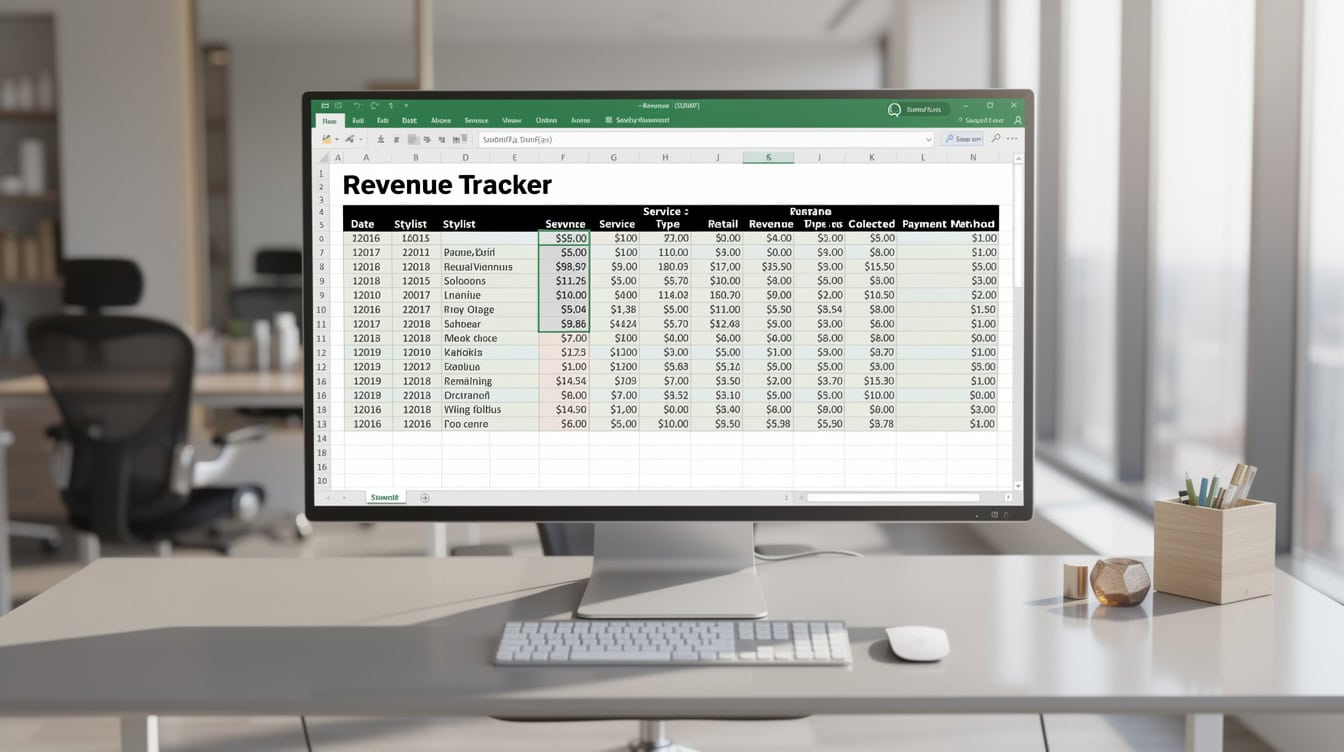
The Revenue Tracker sheet captures every dollar entering the salon, separated by type so you can analyze margin by revenue stream. Set up columns A through G with these headers: Date, Stylist, Service Type, Service Revenue, Retail Revenue, Tips Collected, Payment Method.
At the bottom of each column, use =SUMIF() to aggregate by category. For example, to total service revenue for stylist “Maria” in column D:
=SUMIF(B:B, "Maria", D:D)For monthly totals that update automatically, use:
=SUMPRODUCT((MONTH(A2:A500)=MONTH(TODAY()))*(D2:D500))This formula (a SUMPRODUCT, meaning it multiplies two arrays element-by-element and sums the result) filters revenue to the current calendar month without requiring you to manually update date ranges. Microsoft’s SUMPRODUCT function reference confirms the function accepts up to 255 array arguments, giving you substantial flexibility as you add more revenue categories over time.
The average U.S. hair salon generates $245,000 in annual revenue according to the SBA Office of Advocacy small business data by industry, which works out to $20,417 per month. Enter this as your monthly revenue target in cell I2 and add a conditional formatting rule that turns the monthly total red if it falls below 90% of target.
Labor Cost Calculator: Managing the 45–55% Expense
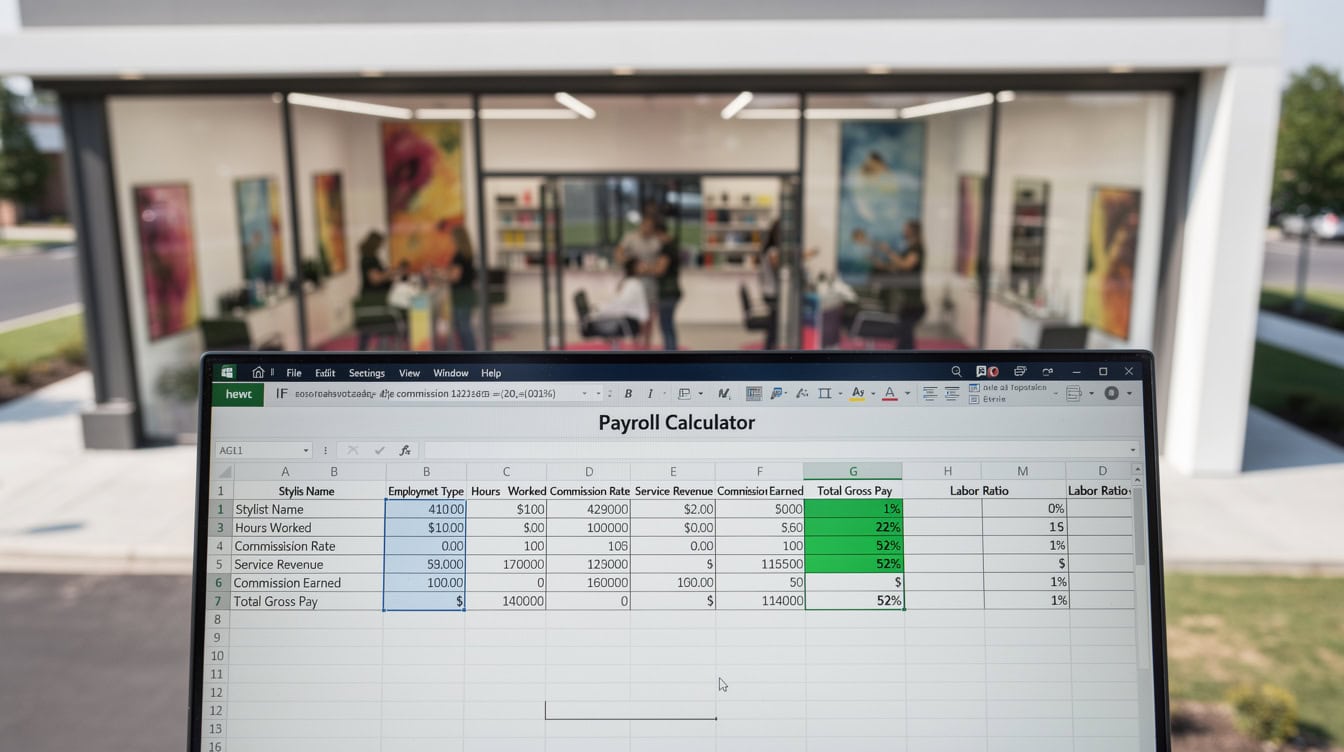
Labor is the single largest cost in any salon, and keeping it within the right band is the difference between profit and loss. IBISWorld’s Hair & Nail Salons in the US industry report puts labor costs at between 45% and 55% of total operating expenses, so your Payroll Calculator sheet must make this ratio visible at all times.
Set up the Payroll Calculator with these columns: Stylist Name, Employment Type (Hourly/Commission/Hybrid), Hours Worked, Hourly Rate, Service Revenue Generated, Commission Rate, Commission Earned, Base Pay, Total Gross Pay, Employer Payroll Tax (7.65%), Total Labor Cost.
Commission formula (for a stylist earning 45% commission on services they perform):
=IF(E2="Commission", F2*G2, IF(E2="Hourly", C2*D2, C2*D2 + F2*G2))Here, column E holds Employment Type, F holds Service Revenue Generated, G holds Commission Rate, C holds Hours Worked, and D holds Hourly Rate. Microsoft’s IF function documentation explains the logical test that returns one value when true and another when false, and Excel’s limit of 64 nested function levels means you can build highly detailed compensation logic without hitting a ceiling.
Labor ratio formula (place this in a summary cell on the Dashboard sheet):
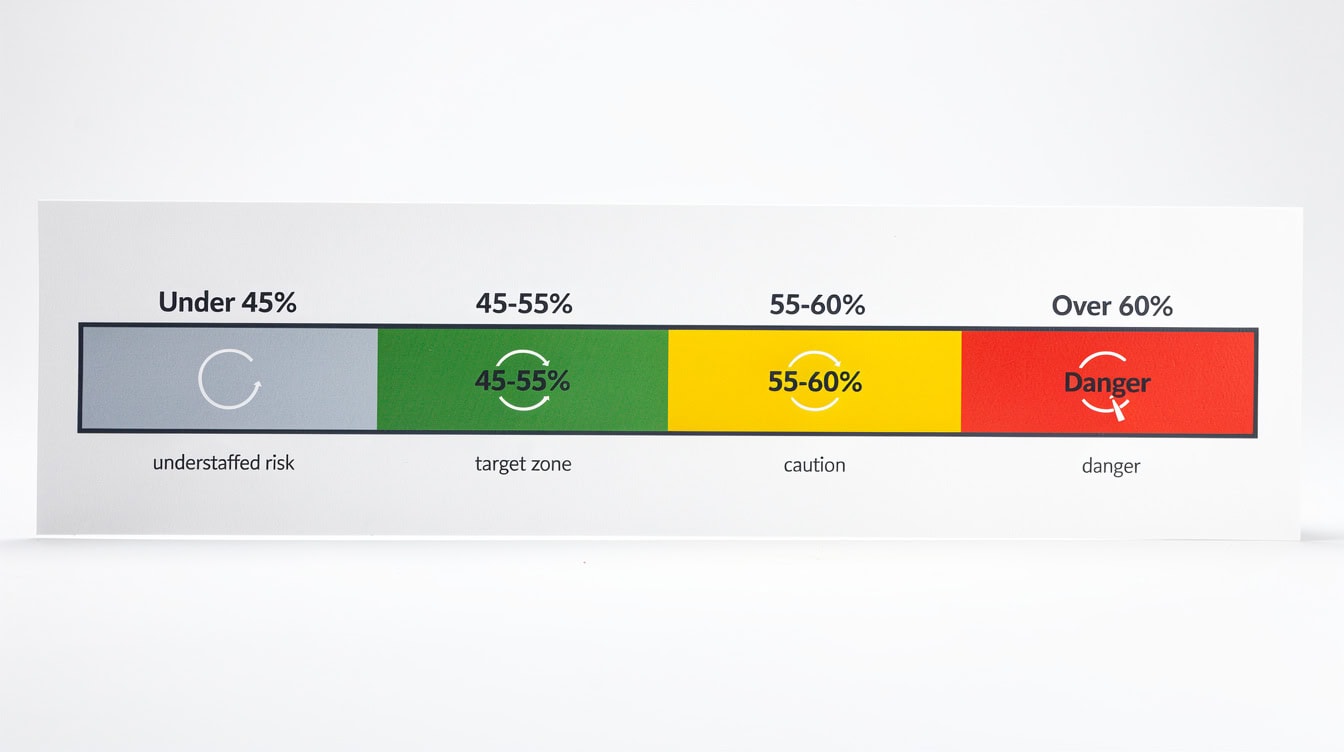
=Payroll_TotalLaborCost / Revenue_MonthlyApply conditional formatting: green if the result is between 0.45 and 0.55, yellow if between 0.55 and 0.60, red if above 0.60. This gives you an instant visual warning before labor costs erode your margin.
Cash Flow Projection: Avoiding the 82% Failure Rate
Cash flow projection is the most critical sheet in the workbook. SCORE’s analysis of why 82% of businesses fail attributes that share of failures to poor cash flow management as a contributing factor, and most salon owners who close their doors aren’t unprofitable on paper — they simply run out of cash between payroll cycles.
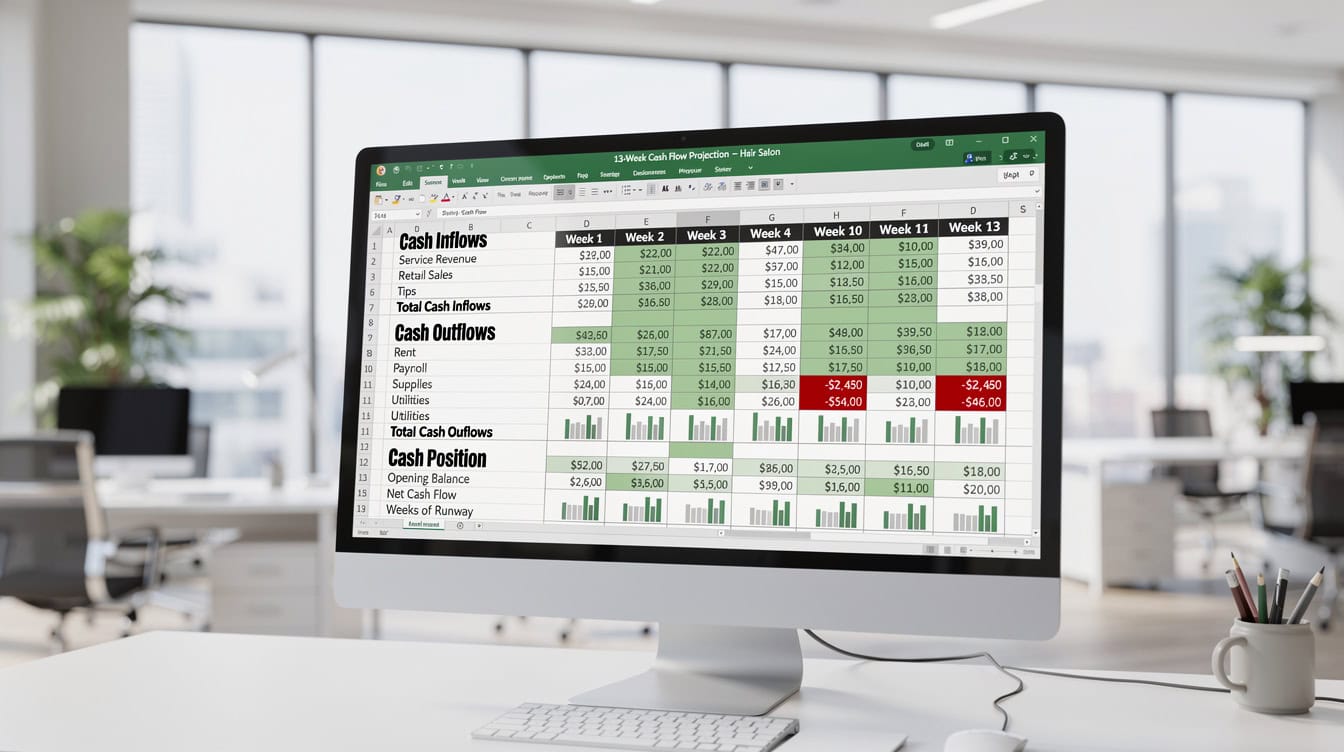
Build a 13-week rolling cash flow projection (13 weeks covers one full quarter and is the standard short-term planning horizon used by financial advisors). The sheet has three sections:
Cash Inflows (rows 3–10): Service revenue, retail revenue, tips, gift card redemptions, other income.
Cash Outflows (rows 12–25): Rent, payroll, product orders, utilities, insurance, marketing, loan payments, owner draw.
Cash Position (rows 27–29): Opening balance, net cash flow, closing balance.
The closing balance formula for Week 1 (column B):
=B27 + SUM(B3:B10) - SUM(B12:B25)For Week 2 (column C), the opening balance pulls from the prior week’s close:
=B29Add a row below the closing balance that calculates weeks of cash runway:
=B29 / AVERAGE(B12:B25)This tells you how many weeks of expenses your current cash balance covers. A runway below 4 weeks is a warning signal requiring immediate action.
Inventory and Product Cost Tracker
Salon inventory splits into two distinct categories with different accounting treatments, and conflating them is one of the most common bookkeeping errors in the industry.
Backbar products (shampoos, conditioners, color, developer used during services) are a cost of service delivery. Track them by service type so you know the true cost of each appointment.
Retail products (items sold to clients) carry a cost of goods sold (COGS) and a retail markup. Industry benchmarks suggest a 50–100% markup on retail products, meaning a product that costs you $8 wholesale should retail for $16–$24.
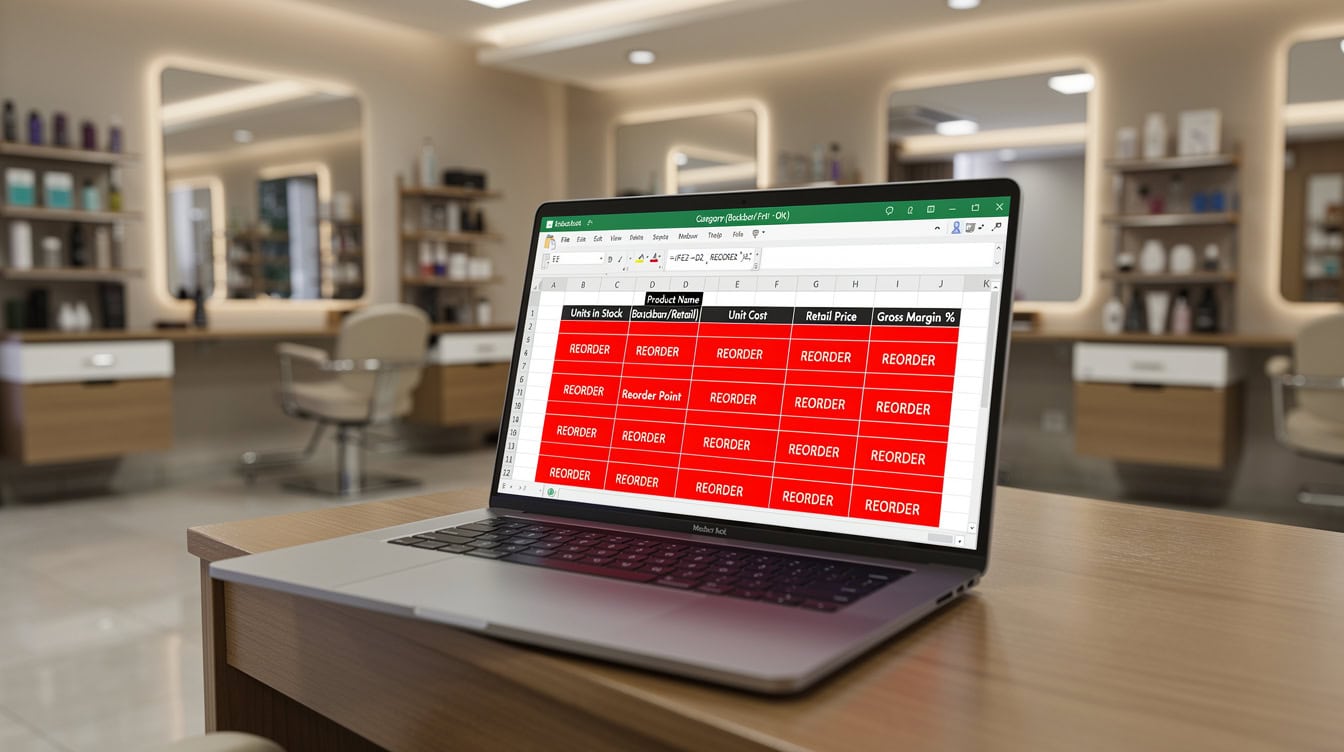
Set up the Inventory Tracker with these columns: Product Name, Category (Backbar/Retail), Unit Cost, Units in Stock, Reorder Point, Units on Order, Retail Price, Gross Margin %.
Reorder alert formula (in a column labeled “Order Now?”):
=IF(D2<=E2, "REORDER", "OK")Where D2 is Units in Stock and E2 is Reorder Point. Apply red fill conditional formatting to any cell showing “REORDER”.
Retail gross margin formula:
=(G2 - C2) / G2Where G2 is Retail Price and C2 is Unit Cost. A margin below 40% on retail products signals your pricing is too low relative to your wholesale cost.
Worked Example: Full Month Financial Calculation
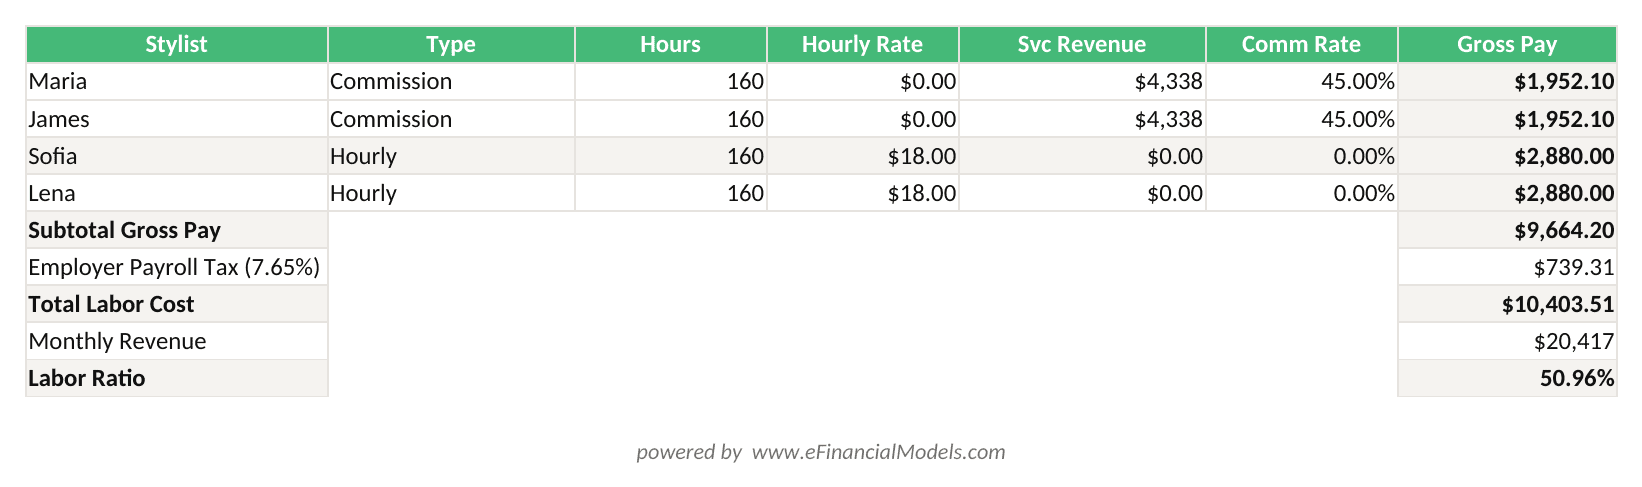
Here’s the math for a 4-stylist salon targeting the $245,000 annual revenue benchmark.
Monthly inputs:
- Monthly revenue target: $20,417
- Service revenue (85% of total): $17,354
- Retail revenue (15% of total): $3,063
- Total stylists: 4 (2 commission at 45%, 2 hourly at $18/hour)
- Average hours per hourly stylist per month: 160
Labor cost calculation:
- Commission stylists: $17,354 × 45% × 2 stylists’ share (50% of service revenue each) = $17,354 × 0.45 × 0.50 × 2 = $7,809
- Hourly stylists: 2 × 160 hours × $18 = $5,760
- Employer payroll tax (7.65%): ($7,809 + $5,760) × 0.0765 = $1,038
- Total labor cost: $14,607
- Labor as % of revenue: $14,607 / $20,417 = 71.5% — this is dangerously above the 55% ceiling.
The formula reveals the problem immediately: two hourly stylists at $18/hour generating only 50% of service revenue is unsustainable. The fix is either shifting both to commission, increasing their service volume, or adjusting pricing. Without the spreadsheet surfacing this ratio, most owners discover the problem only when the bank account is empty.
Monthly Financial Dashboard: KPIs Every Salon Owner Must Monitor
The Dashboard sheet is a single-screen summary that pulls data from all six preceding sheets using named ranges. U.S. Small Business Administration research finds that small businesses which regularly review financial statements are 2.5 times more likely to be profitable than those that don’t, and a well-designed dashboard makes that review take 20 minutes instead of two hours.
Include these seven KPI tiles on the Dashboard:
- Monthly Revenue vs. Target:
=Revenue_Monthly / Revenue_Target— format as percentage with green/red conditional formatting. - Labor Cost Ratio:
=Payroll_TotalLaborCost / Revenue_Monthly— target range 45–55%. - Gross Profit Margin:
=(Revenue_Monthly - COGS_Monthly) / Revenue_Monthly— target 60–70% for service-heavy salons. - Net Profit Margin:
=(Revenue_Monthly - TotalExpenses_Monthly) / Revenue_Monthly— industry average is 8–15% for independent salons. - Cash Runway (weeks):
=CashBalance_Current / AvgWeeklyExpenses— alert below 4 weeks. - Average Ticket:
=Revenue_Monthly / TotalAppointments_Monthly— benchmark $65–$120 depending on market. - Client Retention Rate:
=(Clients_ThisMonth_WhoVisitedLastMonth / Clients_LastMonth) * 100— target above 70%.
Use Excel’s built-in sparklines (mini charts that fit inside a single cell) to show 6-month trends for each KPI without cluttering the dashboard with full-size charts.
From Spreadsheet to Software: When to Make the Transition
Excel is the right tool for salons generating under $300,000 annually with a single location and fewer than 10 stylists. Beyond that threshold, the manual data entry burden and the risk of formula errors start costing more than dedicated software saves.
The Zenoti Salon and Spa Technology Benchmark Report (2022) found that salons and spas using software to track appointments, inventory, and financial performance report revenue increases of 15–25% on average after adoption. That’s a meaningful return, but it requires the salon to already have clean financial data — which is exactly what your Excel workbook provides.
| Scenario | Stay with Excel | Move to Salon Software |
|---|---|---|
| Revenue | Under $300K/year | Over $300K/year |
| Locations | Single location | 2+ locations |
| Stylists | Under 10 | 10 or more |
| Booking volume | Under 200 appts/month | Over 200 appts/month |
| Inventory SKUs | Under 50 products | Over 50 products |
| Payroll complexity | Simple commission or hourly | Mixed models, tips, benefits |
When you do transition, export your Excel data as CSV files. Most salon platforms (Vagaro, Mindbody, Boulevard) accept CSV imports for historical revenue, client records, and inventory counts. Your Excel workbook becomes the migration package.
For salons exploring broader financial modeling beyond day-to-day tracking, the Excel financial models available at EFM cover scenario analysis, valuation, and multi-year projections. Service business owners can also find purpose-built templates in the service business financial model library and the business valuation templates collection for when you’re ready to assess what your salon is worth.

Frequently Asked Questions
What Excel formulas do I actually need for a hair salon spreadsheet?
The five formulas that do the most work in a salon spreadsheet are: SUMIF (to total revenue or expenses by category or stylist), SUMPRODUCT (to filter totals by date range without pivot tables), IF (to handle commission vs. hourly pay logic), conditional formatting rules (to flag KPIs outside target ranges), and simple division for ratio calculations like labor % and gross margin. For example, your labor ratio formula is simply =TotalLaborCost/TotalRevenue, formatted as a percentage. You don’t need advanced functions like VLOOKUP or macros to build a fully functional salon financial workbook — these five cover 90% of what you need.
How do I calculate the true cost of a single hair service in Excel?
True service cost has four components: direct labor (stylist time × hourly equivalent rate), backbar product cost (shampoo, color, developer used), overhead allocation (rent + utilities + insurance divided by total monthly service hours, then multiplied by service duration), and a credit card processing fee if applicable (typically 2.5–3%). For a 90-minute color service with a $25 product cost, 1.5 hours of stylist time at $20/hour equivalent, and $15 overhead allocation, your true cost is $25 + $30 + $15 = $70. If you charge $120, your gross margin is ($120 – $70) / $120 = 41.7%. Build this calculation as a service pricing table in Excel with one row per service type.
How often should I update my salon Excel spreadsheet?
Revenue and tip data should be entered daily, ideally at close of business when the point-of-sale system is reconciled. Expense entries should be logged within 48 hours of each transaction to prevent backlog. Payroll calculations run each pay period (weekly or bi-weekly for most salons). The cash flow projection should be updated every Monday morning so you’re always looking at a fresh 13-week forward view. The Dashboard and monthly financial report require a formal review once per month, ideally within the first 5 business days of the new month. This rhythm takes roughly 15 minutes per day and 90 minutes per month — a small investment given that regular financial review correlates with a 2.5x higher probability of profitability.
What expense categories should a hair salon track in Excel?
A complete salon expense log uses these categories: Rent and occupancy (typically 10–15% of revenue), payroll and commissions (45–55%), product and backbar supplies (5–8%), retail COGS (cost of products sold to clients, 40–50% of retail revenue), utilities (2–4%), insurance (1–2%), marketing and advertising (3–5%), equipment maintenance and depreciation (1–3%), professional fees such as accounting and legal (1–2%), and miscellaneous. Set up each category as a named range so your Dashboard can display expense ratios automatically. If any single category exceeds its benchmark percentage for two consecutive months, that’s your signal to investigate before the variance compounds.
Can I track client lifetime value in Excel without a CRM system?
Yes. Client lifetime value (CLV) is the projected total revenue a client generates over their relationship with your salon. The formula is: CLV = Average Ticket × Annual Visit Frequency × Average Client Lifespan in Years. If your average ticket is $85, a client visits 8 times per year, and the average client stays for 4 years, then CLV = $85 × 8 × 4 = $2,720. In Excel, maintain a Client Metrics sheet with columns for Client ID (never use full names in a shared file for privacy), First Visit Date, Last Visit Date, Total Visits, Total Revenue, and calculated CLV. Use =DATEDIF(B2, TODAY(), "Y") to calculate client tenure in years automatically. Sorting by CLV descending shows you which clients to prioritize for retention outreach.
How do I handle tip income in a salon Excel spreadsheet?
Tip income requires separate tracking for two reasons: it affects stylist compensation reporting (tips are taxable income for employees and must be reported on W-2s) and it inflates apparent revenue if not separated from service income. Create a dedicated Tips Collected column in your Revenue Tracker. At month end, sum tips by stylist using =SUMIF(B:B, "StylistName", F:F) where column F is the tips column. Report this figure to your payroll processor separately from wages. For cash flow purposes, tips received via credit card clear with your regular deposits; cash tips are immediate cash inflows. Never include tip income in your service revenue margin calculations — it distorts your true service profitability picture.
When does an Excel spreadsheet become inadequate for salon financial management?
Excel starts showing its limits when you cross three thresholds simultaneously: more than 200 appointments per month (manual data entry becomes error-prone), more than one location (cross-location consolidation in Excel requires complex linking that breaks easily), and more than 10 stylists with mixed compensation models. At that scale, the 15–25% revenue increase that salons report after adopting dedicated software (Zenoti, 2022) more than justifies the subscription cost. The practical trigger is when you spend more than 5 hours per week maintaining the spreadsheet instead of running the business. Before switching, export your Excel data cleanly — your historical financial records are the foundation for any software migration and for any future business valuation.
Build Your Salon’s Financial Foundation Today
A hair salon Excel workbook isn’t a temporary fix — it’s the financial infrastructure that separates the 40% of small businesses that are profitable from the 60% that aren’t. The seven sheets outlined here give you complete visibility into revenue, labor, cash flow, inventory, and client value, all in a tool you already own.
Start with the Revenue Tracker and Payroll Calculator this week. Add the Cash Flow Projection before your next payroll run. Build the Dashboard once the first two months of data are clean. The discipline of weekly data entry and monthly review is what the SBA’s research confirms as the 2.5x profitability multiplier — not the sophistication of the tool, but the consistency of the practice.
I recommend downloading the EFM Hair Salon Financial Management Excel Template to get a pre-built version of this 7-sheet workbook with all formulas, named ranges, and conditional formatting already configured for your salon’s specific revenue and cost structure.
























































