
0 ITEMS

Window Tint Production Business Financial Model Excel Template
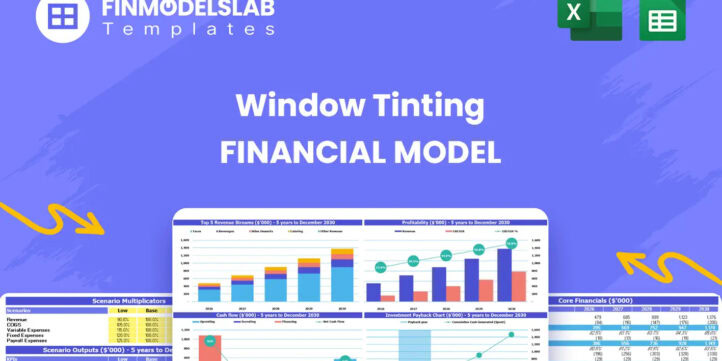
The Window Tinting Financial Model Template helps entrepreneurs, business owners, consultants, analysts, and founders build a structured financial forecast for a window tinting business without starting from a blank spreadsheet. It is designed to support planning for mobile tinting services, shop-based operations, automotive tinting, residential projects, and commercial window film installation. By organizing the main financial drivers in one editable model, it helps users estimate revenue potential, startup costs, operating expenses, payroll, profitability, cash flow, and funding needs with greater clarity. This template is especially useful for anyone preparing a business plan, investor presentation, bank loan application, internal budget, or expansion strategy. Users can enter their own assumptions for customer volume, service pricing, billable hours, marketing spend, customer acquisition costs, staffing, materials, equipment, and overhead. The model then connects those assumptions to forecasted financial statements, allowing users to see how operational decisions may affect monthly and annual performance over a five-year projection period. For window tinting businesses, financial planning depends on understanding the relationship between service mix, job size, technician capacity, film material costs, vehicle expenses, rent, marketing, and labor. This financial model template helps translate those details into practical outputs such as revenue projections, expense forecasts, cash flow planning, profit and loss summaries, and balance sheet estimates. It also supports break-even analysis, helping users understand when the business may become profitable and how changes in pricing, demand, or costs could influence that timeline. Instead of relying on guesswork, the Window Tinting Financial Model gives users a ready-to-use framework for testing decisions before committing capital. It can help compare conservative, base, and growth-oriented scenarios, review key performance indicators, prepare lender-friendly reports, and evaluate whether the business has a realistic path to sustainable profitability. Fully editable and compatible with Excel and Google Sheets, it gives non-financial users and experienced planners a practical tool for budgeting, forecasting, decision-making, and presenting a professional financial plan.


Financial Model Overview
The Window Tinting Financial Model Template is a ready-to-use planning tool built to help users forecast the financial performance of a window tinting business over a multi-year period. It brings together revenue assumptions, service pricing, job volume, material costs, payroll, startup investment, operating expenses, cash flow, profitability, and investor metrics in one structured model. For a window tinting business, financial performance depends on more than just the number of jobs booked. Users also need to understand the mix between automotive, residential, and commercial work, the time required per job, the cost of film and supplies, technician productivity, marketing efficiency, equipment needs, and working capital requirements.
This template helps organize those moving parts into a clear financial planning system that can be edited for a startup, mobile tinting operation, shop-based business, or expansion plan. It is designed for entrepreneurs, founders, operators, consultants, analysts, and business plan writers who need a professional, practical, and presentation-ready forecast for decision-making, funding preparation, or internal budgeting.
All-in-One Dashboard
The all-in-one dashboard gives users a central view of the most important inputs and outputs in the Window Tinting Financial Model. Instead of moving through disconnected calculations, users can review the core operating assumptions and resulting financial outcomes in one place. This section may summarize revenue, gross profit, EBITDA, net income, cash position, break-even timing, payback period, and other performance indicators that matter to owners, lenders, and investors.
The dashboard is useful because it helps users quickly understand whether the current assumptions are producing a viable plan. For example, if marketing spend increases, pricing changes, technician capacity expands, or service volume rises, the dashboard can help show the resulting impact on sales, profitability, and cash flow. This component is especially helpful for non-financial users who want a clean executive view before reviewing detailed schedules. It also supports presentations by making the model easier to explain to partners, banks, investors, advisors, or internal stakeholders who need a concise summary of the business case.
Low, Base, and High Scenario Analysis
The low, base, and high scenario analysis section helps users evaluate how the window tinting business may perform under different market and operating conditions. A single forecast is rarely enough for serious planning because customer demand, pricing, labor availability, material costs, and marketing efficiency can change. This component allows users to compare a conservative case, a most likely case, and a stronger growth case using adjusted assumptions.
Inputs may include customer acquisition rates, average job values, billable hours, revenue growth, direct cost percentages, payroll levels, and operating expenses. The output helps users see how revenue, margins, profit, cash flow, and funding needs change across scenarios. This is valuable for risk planning because it reveals how much room the business has if demand is slower than expected or expenses are higher than planned. It also helps identify upside potential if the company wins more commercial contracts, improves technician utilization, or increases pricing. For investors and lenders, scenario analysis shows that the plan has been stress-tested rather than built around one optimistic projection.
Professional Charts
The professional charts component turns the financial model’s calculations into visual reports that are easier to understand and present. Window tinting financial forecasts can include many detailed assumptions, but charts help convert those assumptions into a clear story. This section may display revenue growth, gross margin trends, EBITDA, net income, cash balances, cost structure, revenue mix, and other key outputs over the forecast period.
Visual reporting is useful for business plans, pitch decks, loan discussions, and management meetings because it allows stakeholders to quickly see the direction of the business. For example, users can show how automotive tinting may provide high-volume recurring work while commercial projects drive larger revenue spikes, or how cash flow improves as fixed costs are spread across a larger customer base. The charts also make it easier to identify problems, such as rising expenses, delayed profitability, or insufficient cash reserves. By presenting the forecast visually, this component helps users communicate financial performance with more confidence and less reliance on dense spreadsheet tables.
ROE Components and DuPont Analysis
The ROE components and DuPont analysis section helps users understand the drivers behind return on equity rather than looking at profitability as a single isolated number. Return on equity is especially relevant when owners or investors want to evaluate whether the capital invested in the window tinting business is generating an attractive return. DuPont analysis typically breaks ROE into underlying components related to profitability, asset efficiency, and financial leverage.
In practical terms, this helps users see whether returns are being driven by strong margins, effective use of assets, or the financing structure of the business. Inputs may include net income, equity, revenue, assets, liabilities, and other balance sheet and income statement values. The outputs help users interpret how operational decisions influence investor-level returns. For example, investing in a service van, cutting plotter, workshop fit-out, or additional staff may affect both assets and profitability. This component is useful for founders, analysts, and investors who want to evaluate not only whether the business is profitable, but also how efficiently it turns invested capital into financial results.
Revenue Inputs and Assumptions
The revenue inputs and assumptions section is where users define the commercial engine of the window tinting business. This component allows users to enter and edit the key drivers that determine sales, such as service categories, pricing, average billable hours, number of customers, customer acquisition costs, marketing spend, conversion rates, repeat business, and growth rates. For a window tinting company, revenue may come from automotive tinting, residential window film installation, commercial contracts, add-on services, removal work, ceramic film upgrades, security film, decorative film, or other service lines.
The model uses these inputs to calculate projected revenue over time, helping users understand how service mix and job volume translate into monthly and annual sales. This section is valuable because it forces the business plan to be built from realistic operating assumptions rather than a simple top-down sales estimate. Users can test whether the average order value, technician capacity, and customer acquisition strategy are aligned with the revenue target. This makes the forecast more useful for budgeting, pricing decisions, marketing planning, and funding discussions.
Bank-Ready Financial Reports
The bank-ready financial reports component organizes the model’s outputs into lender-friendly statements and summaries. When applying for financing, a window tinting business often needs to show more than a revenue forecast. Banks and financing partners typically want to review profit and loss projections, cash flow forecasts, balance sheet assumptions, debt capacity, repayment ability, startup funding needs, and the timing of profitability.
This section helps present those outputs in a professional format that supports loan applications, funding requests, and stakeholder review. Inputs from the rest of the model flow into the financial statements, reducing the need to manually recreate reports. The result is a more consistent and credible set of projections that can be shared with lenders, investors, partners, accountants, or advisors. This component is also useful for internal management because it helps owners review whether the business can cover fixed expenses, support payroll, purchase materials, repay debt, and maintain sufficient cash reserves. A clear report package can make the difference between a rough idea and a funding-ready financial plan.
Revenue Breakdown by Service Stream
The revenue breakdown by service stream component gives users a detailed view of where sales are expected to come from across the window tinting business. Rather than treating all revenue as one combined number, this section separates income by service type so users can evaluate the role of each revenue stream. Automotive tinting may produce frequent jobs with smaller ticket sizes, residential projects may offer higher hourly rates and moderate project values, and commercial work may create larger contracts with longer sales cycles.
Inputs may include pricing, billable hours, number of jobs, average project size, seasonality, customer growth, and service-specific revenue assumptions. The outputs help users identify which services are expected to contribute the most revenue, which lines may offer the strongest margins, and how changes in service mix affect the total forecast. This is useful for marketing strategy, staffing decisions, equipment planning, and capacity management. If commercial work drives significant revenue but requires more preparation and materials, the model can help users plan cash flow and resources accordingly. A detailed revenue breakdown also makes the business plan more credible because it shows how sales are generated at the service level.
KPI Dashboard and Benchmarking
The KPI dashboard and benchmarking component helps users monitor performance using key financial and operational metrics relevant to a window tinting business. This section may include indicators such as revenue growth, gross margin, EBITDA margin, net profit margin, cash balance, customer acquisition cost, average order value, payback period, return metrics, labor efficiency, and cost ratios. It may also help compare projected results against industry benchmarks or reasonable service business standards. The purpose is to give users a practical way to judge whether the forecast is realistic, competitive, and financially healthy.
For example, if material costs are too high as a percentage of revenue, the model can highlight pressure on gross margin. If marketing spend is generating too few customers, the user can revisit acquisition assumptions. If payroll rises faster than revenue, the KPI dashboard can help identify the need for better scheduling, pricing, or capacity utilization. This component supports ongoing decision-making because it gives owners and analysts a concise set of metrics to track as the business launches, grows, or seeks funding.
Startup Cost Breakdown
The startup cost breakdown section helps users estimate the initial investment required to launch or expand a window tinting business. This component may include service vehicles, cutting plotter and software, installation tools, heat guns, film inventory, workshop fit-out, storage, signage, licensing, insurance deposits, website setup, initial marketing, training, rent deposits, office equipment, and working capital.
By organizing these costs in a dedicated section, the model helps users avoid underestimating the funding needed before revenue begins. The outputs can show total startup capital requirements, timing of investment, and how much cash should be available to cover early operating needs. This is especially important for window tinting businesses because upfront equipment and setup choices can influence capacity, service quality, and future growth. A mobile operator may prioritize a service van, portable tools, and travel costs, while a shop-based operation may require more leasehold improvements and fixed overhead. This component is useful for budgeting, investor conversations, loan applications, and deciding whether the launch plan should be phased or fully funded from the start.
Break-Even Analysis
The break-even analysis section helps users identify when the window tinting business is expected to cover its costs and begin generating profit. It connects revenue assumptions, direct costs, fixed expenses, payroll, marketing, and overhead to calculate the sales level or timing required to reach break-even. Inputs may include average pricing, service volume, material costs, labor costs, rent, insurance, vehicle expenses, software, utilities, and administrative costs. The outputs can show the break-even month, required revenue level, and how changes in key assumptions affect the path to profitability. This component is especially useful because a window tinting business often has a mix of variable costs and fixed commitments.
Film materials and supplies may rise with sales, while rent, salaries, insurance, and vehicle costs must be covered regardless of monthly demand. Break-even analysis helps users understand whether the planned customer volume and pricing strategy are sufficient to support the cost structure. It also supports decision-making by showing how faster customer acquisition, higher-margin commercial contracts, better supplier pricing, or tighter expense control can shorten the time required to reach sustainable profitability.
File types:
Excel – Single-User: .xlsx
Excel – Multi-User: .xlsx
Similar ProductsOther customers were also interested in...

 HenrySheykin
Solar Panel Manufacturing Plant Business Plan Fina...
The Solar Panel Manufacturing Financial Model helps users turn a solar factory concept into a struct... Read more
Coal Mining Financial Model Excel Template
The Coal Mining Financial Model helps users turn a mining project concept, expansion plan, or invest... Read more
Metal Mining Business Financial Model Excel Templa...
The Metal Mining Financial Model Financial Model Template helps users turn a mining project concept ... Read more
Food Production Financial Model Excel Template
The Food Manufacturing Financial Model helps entrepreneurs, founders, consultants, analysts, and bus... Read more
Clothing Line Business Financial Model Excel Templ...
The Clothing Line Financial Model helps founders, apparel entrepreneurs, consultants, analysts, and ... Read more
T-Shirt Printing Business Financial Model Excel Te...
The T-Shirt Printing Financial Model helps entrepreneurs, founders, business owners, consultants, an... Read more

Gold Mining Business Financial Model Excel Templat...
The Gold Mining Financial Model Financial Model Template helps users turn a gold mining project into... Read more
Biodiesel Manufacturing Business Financial Model E...
The Biodiesel Manufacturing Financial Model helps entrepreneurs, founders, business owners, consulta... Read more
Organic Fertilizer Production Financial Model Exce...
The Organic Fertilizer Production Financial Model helps users turn a fertilizer plant concept into a... Read more
Drone Manufacturing Financial Model Excel Template
The Drone Manufacturing Financial Model Financial Model Template helps turn a UAV production concept... Read more
You must log in to submit a review.