
0 ITEMS

Shoe Line Business Financial Model Excel Template
The Shoe Manufacturing Financial Model Financial Model Template helps entrepreneurs, founders, consultants, analysts, and business owners build a structured financial forecast for a footwear production business. Instead of relying on a generic spreadsheet, this template is designed around the real operating drivers of shoe manufacturing, including production volume, product pricing, raw material costs, labor requirements, inventory needs, equipment investment, and working capital. It gives users a practical way to estimate startup costs, forecast revenue assumptions, plan operating expenses, and understand how the business may perform over a multi-year period. This template is especially useful for people preparing a business plan, investor presentation, bank loan package, internal budget, or expansion strategy for a shoe company, footwear brand, or manufacturing facility. Users can customize the model to reflect their own product lines, such as sneakers, sandals, dress shoes, boots, flats, or private-label footwear. By editing assumptions for unit production, average selling price, cost of goods sold, staffing, marketing, rent, equipment, and other inputs, buyers can quickly see how changes affect revenue, profitability, cash flow, break-even timing, and funding requirements. The model connects core planning areas in one editable file, helping users move from assumptions to financial statements and decision-ready outputs. It supports revenue forecasting, payroll planning, operating expense budgeting, capital expenditure planning, gross margin analysis, profitability review, cash flow forecasting, and break-even analysis. This makes it easier to understand whether the business can support its cost structure, when additional funding may be needed, and which products or growth plans are most attractive financially. Built for both Excel and Google Sheets, the Shoe Manufacturing Financial Model is ready to use, fully customizable, and suitable for professional reporting. It helps users save time by providing pre-built formulas, structured assumptions, investor-ready outputs, and visual dashboards instead of starting from a blank workbook. Whether you are launching a new footwear brand, building a shoe factory financial plan, reviewing production economics, or preparing funding documents, this template helps turn business ideas into clear financial projections and better decision-making.
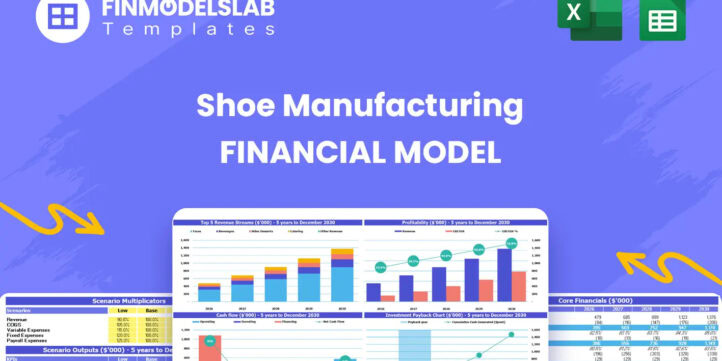


Financial Model Overview
The Shoe Manufacturing Financial Model Financial Model Template is a ready-to-use planning tool built for entrepreneurs, footwear brand owners, manufacturers, consultants, analysts, and founders who need to evaluate the economics of a shoe production business. It is designed around the financial realities of manufacturing, where revenue depends on production volumes and selling prices, profitability depends heavily on material costs and labor efficiency, and cash flow can be affected by inventory purchases, equipment investment, supplier terms, and working capital requirements.
The template helps users organize assumptions, forecast revenue, estimate startup costs, model operating expenses, project payroll, analyze profitability, and prepare investor-ready financial outputs. Instead of building a complex model from scratch, users can start with a structured framework tailored to shoe manufacturing and then customize the inputs for their own products, pricing, production facility, staffing plan, sales channels, and growth strategy. It is useful for business planning, funding applications, investor discussions, bank presentations, internal budgeting, and strategic decision-making.
All-in-One Dashboard
The all-in-one dashboard brings together the core inputs and core outputs of the Shoe Manufacturing Financial Model in one central view, giving users a practical starting point for understanding the entire forecast. This component is designed to summarize the most important planning assumptions, such as production volume, pricing, direct material costs, labor requirements, capital expenditures, startup investment, and operating cost drivers, while also displaying the resulting financial outputs such as revenue, gross profit, EBITDA, net income, cash balance, and funding needs.
For a shoe manufacturing business, this is especially valuable because decision-makers need to see how operational choices translate into financial performance. A change in leather cost, unit production, labor efficiency, or product pricing can quickly affect margin and cash flow. The dashboard helps users review the business at a glance, compare assumptions against results, and identify whether the current plan supports a realistic path to growth. It is useful for owners preparing a financial plan, consultants presenting options to clients, or founders explaining the business model to investors and lenders.
Low, Base, and High Scenario Analysis
The low, base, and high scenario analysis component allows users to test how the shoe manufacturing business may perform under different market and operating conditions. The base scenario can represent the expected plan, while the low scenario may reflect slower sales, lower production volume, higher material costs, delayed orders, or reduced pricing power. The high scenario can model stronger demand, better factory utilization, improved margins, higher direct-to-consumer sales, or faster expansion. This structure helps users avoid relying on only one forecast and instead evaluate a range of possible outcomes.
In a footwear manufacturing business, assumptions can shift quickly because leather, textiles, rubber, packaging, freight, wages, and advertising costs may change over time. The scenario tool helps users understand how changes in production volume, average sales price, product mix, cost of goods sold, payroll, or operating expenses affect profitability, cash flow, break-even timing, and funding requirements. This is useful for risk management, investor conversations, bank loan preparation, and strategic decision-making because it shows not only the upside potential but also the financial resilience of the business if performance falls below plan.
Professional Charts
The professional charts component converts the financial forecast into clear visual reports that can be used for presentations, internal reviews, business plans, and funding discussions. Instead of forcing users to interpret long rows of numbers, the model presents key trends through easy-to-read charts covering areas such as revenue growth, cost structure, gross profit, EBITDA, cash flow, profitability, and other financial metrics. For a shoe manufacturing business, charts are especially helpful because they make production scaling, margin improvement, and cash movement easier to understand.
Users can visually track how revenue grows as unit production increases, how gross margin changes as direct material and labor costs shift, and how cash balance responds to startup investment or working capital needs. These outputs help founders, managers, and advisors communicate the financial story of the footwear business more effectively. The charts can support investor decks, lender meetings, board discussions, or management reporting by showing the most important results in a presentation-ready format. They also help identify patterns and pressure points that may not be obvious from the financial statements alone.
ROE Components and DuPont Analysis
The ROE components and DuPont analysis section helps users understand the drivers behind return on equity rather than looking at a single profitability metric in isolation. This component breaks return on equity into key underlying factors, such as profit margin, asset efficiency, and financial leverage, allowing users to see how the shoe manufacturing business generates returns for owners or investors. In a manufacturing environment, ROE can be influenced by many factors, including the amount invested in equipment, factory build-out, inventory, working capital, and fixed assets, as well as the margin earned on each product line.
A footwear company may show revenue growth but still deliver weak returns if production assets are underused, costs are too high, or capital is tied up inefficiently. This analysis helps users evaluate whether the business is using its equity effectively and where improvements may be possible. For example, a founder can review whether increasing production volume improves asset turnover, whether sourcing changes improve margins, or whether financing choices affect investor returns. It is useful for investor reporting, strategic planning, capital allocation, and assessing whether the business model can create attractive long-term value.
Revenue Inputs
The revenue inputs section allows users to define the core assumptions that drive sales in the Shoe Manufacturing Financial Model. This component may include product categories, expected unit production, sales volume, average selling price, annual growth rates, channel mix, and pricing adjustments over time. Because shoe manufacturing businesses often sell multiple product lines, the model can be customized for products such as leather oxfords, modern sneakers, ballet flats, dress boots, sandals, or any other footwear category the user plans to produce.
The value of this section is that it links operational production assumptions directly to financial projections. Users can test how many units must be produced and sold, what pricing levels are required, and how changes in demand affect overall revenue. For example, adjusting sneaker volume, raising the price of premium boots, or adding a new product line can immediately flow through the model and affect projected sales, gross profit, EBITDA, and cash flow. This section is useful for market planning, product strategy, production scheduling, fundraising, and business plan preparation because it clearly documents the assumptions behind the revenue forecast.
Bank-Ready Reports
The bank-ready reports component organizes the financial outputs into a format that can support lender reviews, loan applications, investor due diligence, and formal business planning. This section focuses on producing clear, structured financial statements and summaries that stakeholders typically expect to see, such as profit and loss projections, cash flow forecasts, balance sheet views, profitability metrics, funding needs, and repayment capacity indicators. For a shoe manufacturing business, lenders often want to understand how startup capital will be used, whether the company can maintain positive cash flow, how much inventory and equipment investment is required, and whether projected revenue can support operating expenses and debt service.
This component helps present those answers in a professional and organized way. Users can customize the assumptions, then use the resulting reports to explain the financial plan with greater confidence. It is useful for founders seeking a small business loan, manufacturers applying for equipment financing, footwear brands preparing investor materials, or consultants building a complete financial package for clients. The goal is to make the numbers easier to review, explain, and defend.
Revenue Breakdown
The revenue breakdown component gives users a more detailed view of how total revenue is generated across product lines, sales categories, or revenue streams. Rather than showing only one top-line sales figure, this section helps users understand which footwear products contribute the most to revenue and how the product mix affects the overall financial plan. A shoe manufacturer may produce multiple styles with very different economics, such as affordable sandals with high volume, premium boots with higher prices, sneakers with broader market appeal, or formal shoes with different labor and material requirements.
By separating revenue by stream, users can compare the sales contribution of each product category and identify where growth is coming from. This section may use inputs such as units sold, average selling price, annual production growth, pricing changes, and product-level assumptions. The outputs help users evaluate whether the business is too dependent on one product, whether higher-margin items should receive more focus, and how changes in the mix affect revenue and profitability. It is useful for product planning, pricing decisions, investor explanations, and manufacturing strategy.
KPI Dashboard
The KPI dashboard component tracks key performance indicators that help users monitor the financial and operational health of the shoe manufacturing business. While the all-in-one dashboard provides a broad summary of inputs and outputs, the KPI dashboard focuses more specifically on performance metrics that can be used to evaluate progress against goals and benchmarks. These may include revenue growth, gross margin, EBITDA margin, net profit margin, cash balance, return metrics, production-related indicators, cost ratios, break-even timing, and other measures relevant to footwear manufacturing.
This section helps users see whether the business is becoming more efficient as it scales, whether margins are improving, and whether expenses remain under control. It can also support comparison against industry expectations or internal targets. For example, users can review whether material costs are consuming too much of sales, whether payroll is sustainable relative to revenue, or whether the company has enough cash to support production growth. The KPI dashboard is useful for monthly reviews, investor updates, management meetings, and strategic decisions because it translates the forecast into measurable business performance indicators.
Startup Costs and CapEx Planning
The startup costs and CapEx planning component helps users estimate the initial investment required to launch or expand a shoe manufacturing operation. This section is particularly important because footwear production often requires meaningful upfront spending before revenue is generated. Inputs may include manufacturing equipment, sewing machines, cutting machinery, molds, lasts, finishing tools, factory build-out, leasehold improvements, delivery vehicles, e-commerce platform development, office setup, licenses, deposits, initial marketing, and working capital reserves.
The model helps organize these costs into a structured startup budget so users can see how much funding may be needed before operations begin. It can also separate one-time capital expenditures from ongoing operating expenses, which is important for understanding cash requirements and future profitability. For founders and business owners, this component supports better launch planning by reducing the risk of underestimating the true cost of getting started. For investors and lenders, it provides a clear explanation of how funds will be used and whether the requested capital aligns with the operational plan. It is useful for budgeting, fundraising, loan applications, and deciding whether to launch at a small scale or invest in a larger production facility.
Cash Flow Forecasting and Working Capital Planning
The cash flow forecasting and working capital planning component helps users understand how money moves through the shoe manufacturing business over time. This is critical because a company can appear profitable on paper while still facing cash pressure due to inventory purchases, supplier payments, payroll timing, production lead times, customer collections, marketing spend, and equipment investments. The model can forecast monthly and annual cash inflows and outflows, showing when the business may have excess cash and when it may need additional working capital.
Inputs may include sales timing, cost of goods sold, payroll, rent, operating expenses, capital expenditures, inventory needs, receivables, payables, and financing assumptions. Outputs may include projected cash balance, net cash flow, minimum cash point, funding gaps, and liquidity trends. For a shoe manufacturer, this helps plan production schedules, negotiate supplier terms, evaluate whether pre-orders could improve cash flow, and determine if a line of credit or external funding may be needed. This component is useful for avoiding cash shortages, managing growth responsibly, supporting lender discussions, and making operational decisions with a clear understanding of liquidity.
File types:
Excel – Single-User: .xlsx
Excel – Multi-User: .xlsx
Similar ProductsOther customers were also interested in...

 HenrySheykin
Solar Panel Manufacturing Plant Business Plan Fina...
The Solar Panel Manufacturing Financial Model helps users turn a solar factory concept into a struct... Read more

Coal Mining Financial Model Excel Template
The Coal Mining Financial Model helps users turn a mining project concept, expansion plan, or invest... Read more

Metal Mining Business Financial Model Excel Templa...
The Metal Mining Financial Model Financial Model Template helps users turn a mining project concept ... Read more
Food Production Financial Model Excel Template
The Food Manufacturing Financial Model helps entrepreneurs, founders, consultants, analysts, and bus... Read more
Clothing Line Business Financial Model Excel Templ...
The Clothing Line Financial Model helps founders, apparel entrepreneurs, consultants, analysts, and ... Read more
T-Shirt Printing Business Financial Model Excel Te...
The T-Shirt Printing Financial Model helps entrepreneurs, founders, business owners, consultants, an... Read more

Gold Mining Business Financial Model Excel Templat...
The Gold Mining Financial Model Financial Model Template helps users turn a gold mining project into... Read more
Biodiesel Manufacturing Business Financial Model E...
The Biodiesel Manufacturing Financial Model helps entrepreneurs, founders, business owners, consulta... Read more
Organic Fertilizer Production Financial Model Exce...
The Organic Fertilizer Production Financial Model helps users turn a fertilizer plant concept into a... Read more
Drone Manufacturing Financial Model Excel Template
The Drone Manufacturing Financial Model Financial Model Template helps turn a UAV production concept... Read more
You must log in to submit a review.