
0 ITEMS

All Day Bar & Restaurant Financial Model Excel Template
The All-Day Restaurant Financial Model helps users turn a food and beverage concept into a structured, editable financial forecast that can support planning, budgeting, funding preparation, and operational decision-making. Built for an all-day dining model, it gives entrepreneurs, restaurant owners, consultants, analysts, and founders a practical way to estimate revenue assumptions, customer volume, average spend, menu mix, startup costs, operating expenses, payroll, cash flow, profitability, and investment returns before committing capital or presenting the business to stakeholders. This financial model template is designed for users who need more than a simple budget. It connects key restaurant drivers such as weekday and weekend covers, average check size, cost of goods sold, staffing levels, rent, fixed overheads, and growth assumptions into a five-year forecast. Instead of guessing whether the restaurant can cover its costs, reach break-even, or generate sustainable profit, users can work from a ready-made framework that shows how changes in pricing, traffic, food costs, labor efficiency, and capital needs affect the overall financial picture. The template is especially useful for business plans, investor presentations, bank loan applications, internal reviews, and expansion planning. It helps users organize assumptions clearly, test low, base, and high scenarios, review financial statements, evaluate cash flow timing, and understand whether the business has enough working capital to operate smoothly. By showing projected revenue, expenses, EBITDA, returns, and liquidity in one model, it supports better conversations with partners, lenders, investors, and management teams. Because the All-Day Restaurant Financial Model is fully customizable, buyers can adapt it to their own menu, location, operating schedule, staffing plan, supplier costs, and growth strategy. It is suitable for new restaurant launches, food hall concepts, quick-service restaurants, casual dining formats, and operators planning a modern all-day restaurant with breakfast, lunch, dinner, sides, beverages, and desserts. The result is a time-saving, investor-ready financial planning tool that helps users make more confident decisions with organized numbers instead of scattered estimates.


Financial Model Overview
The All-Day Restaurant Financial Model is a ready-to-use financial model template created for entrepreneurs, restaurant founders, operators, consultants, analysts, and business planners who need to evaluate the financial potential of an all-day dining concept. Restaurants depend on many moving parts, including customer traffic, average check size, menu mix, food costs, labor scheduling, rent, startup investment, working capital, and cash flow timing.
This template brings those variables into one organized model so users can estimate revenue, forecast expenses, review profitability, test scenarios, and prepare investor-ready outputs without building a full restaurant forecast from scratch. It is especially useful for business plans, funding applications, internal budgeting, launch planning, and strategic decision-making because it connects the operational assumptions behind the restaurant with projected financial results over time.
All-in-One Dashboard
The all-in-one dashboard gives users a central view of the most important inputs and outputs in the All-Day Restaurant Financial Model. It is designed to help users quickly understand how the business is expected to perform without moving through every detailed worksheet first. The dashboard may summarize key assumptions such as customer volume, average spend, revenue growth, cost percentages, staffing levels, startup investment, and operating expense drivers, then translate those inputs into outputs such as projected sales, gross profit, EBITDA, cash flow, payback period, and profitability indicators. For restaurant planning, this is useful because founders and stakeholders often need a fast, clear view of the model before reviewing the details.
A strong dashboard also supports better decision-making by showing whether the restaurant concept is financially balanced, whether costs are aligned with revenue potential, and whether the business can support its launch and growth objectives. For investor or lender conversations, the dashboard helps present the financial story in a concise format that is easier to explain and update.
Low, Base, and High Scenario Analysis
The low, base, and high scenario analysis component allows users to compare how the all-day restaurant could perform under different business conditions. A base case can reflect the expected operating plan, while a low case can show the effect of weaker traffic, lower average checks, higher food costs, slower growth, or more conservative margins.
A high case can test stronger customer demand, better table turnover, improved menu pricing, stronger beverage sales, or more efficient labor deployment. This section typically uses assumptions such as daily covers, average check size, sales mix, cost of goods sold, payroll levels, rent, marketing spend, and growth rates to generate different results for revenue, profitability, cash flow, and return metrics.
Scenario analysis is valuable because restaurants face uncertainty from seasonality, local competition, wage pressure, supplier pricing, customer behavior, and opening ramp-up. By seeing how the model changes across different cases, users can prepare contingency plans, set more realistic targets, define funding needs with more confidence, and explain risks more professionally to investors, lenders, or business partners.
Professional Charts
The professional charts component transforms the financial forecast into visual outputs that are suitable for presentations, internal meetings, and funding discussions. Instead of relying only on rows of numbers, users can view trends in revenue, expenses, profitability, cash flow, and key financial metrics through pre-built graphs and visual summaries. These charts may show how sales grow over the forecast period, how operating costs change as a percentage of revenue, how EBITDA develops over time, and how cash balances move month by month or year by year.
For an all-day restaurant, charts are especially helpful because stakeholders often want to understand the relationship between customer traffic, menu economics, labor cost, and profitability quickly. Visual reporting also makes it easier to spot trends that may be difficult to identify in a detailed spreadsheet, such as rising cost pressure, a delayed cash flow recovery, or a meaningful improvement in margins after the restaurant reaches stable operations. This component supports investor-ready communication by making financial outputs easier to review, explain, and defend.
ROE Components and DuPont Analysis
The ROE components section uses DuPont-style analysis to help users understand what is driving return on equity in the restaurant business. Rather than looking at return as a single isolated number, this component breaks performance into underlying drivers such as profitability, asset efficiency, and leverage. It may use inputs and outputs from the income statement, balance sheet, and financing assumptions to show how net margin, asset turnover, and equity structure contribute to overall shareholder returns.
For a restaurant, this is useful because return can be influenced by multiple factors, including the size of the initial build-out, equipment investment, working capital, debt funding, menu margin, and sales productivity. A strong ROE view helps founders and investors see whether returns are being created by healthy operations or by financial structure alone. It also supports strategic decisions around capital investment, pricing, expansion, and financing. By isolating the components of return, the All-Day Restaurant Financial Model gives users a more analytical way to evaluate whether the business can generate attractive shareholder value over time.
Revenue Inputs
The revenue inputs component is where users define the core assumptions that drive the restaurant’s sales forecast. For an all-day restaurant, revenue may be built from daily customer volume, average spend per customer, weekday and weekend traffic differences, menu categories, service periods, and growth assumptions over time. The model can reflect how traffic changes between slower weekdays and busier weekends, how average check size differs across meal periods, and how the menu mix affects total sales.
Revenue categories may include wraps, bowls, breakfast and brunch items, sides, beverages, desserts, or other customizable product lines depending on the concept. This section is important because restaurant revenue forecasting becomes much more credible when it is tied to operational logic rather than a single top-down sales estimate. By editing covers, pricing, average checks, and sales mix, users can see how different operating choices affect monthly and annual revenue. The section supports pricing decisions, menu planning, location feasibility, staffing assumptions, and investor discussions because it clearly documents the assumptions behind the forecasted sales.
Bank-Ready Reports
The bank-ready reports component gives users structured financial outputs that can support loan applications, funding submissions, and stakeholder review. Restaurants often need outside capital for build-out, equipment, deposits, launch marketing, inventory, payroll, and working capital, so lenders need to see more than a general business idea. This section can include lender-friendly outputs such as profit and loss forecasts, cash flow statements, balance sheet projections, debt service visibility, startup funding needs, profitability summaries, and repayment-related metrics.
The purpose is to present the restaurant’s financial position in a format that is clear, organized, and easier for banks, credit providers, or financing partners to review. Users can rely on these outputs to show how the business expects to generate revenue, cover operating expenses, manage liquidity, and support financing obligations. For entrepreneurs and consultants, the bank-ready reports reduce the time needed to prepare professional financial documents and help ensure that important numbers are not scattered across disconnected files. This makes the model useful for both early-stage launch planning and formal funding preparation.
Revenue Breakdown
The revenue breakdown component provides a detailed view of how total restaurant revenue is distributed across different streams, categories, or menu groups. For an all-day restaurant, this may include major food and beverage categories such as core menu items, breakfast or brunch offerings, sides, drinks, desserts, catering-style sales, or other revenue streams that the user chooses to include. The section uses assumptions from the revenue input area, such as sales mix percentages, average check values, customer counts, pricing, and growth rates, then converts those assumptions into a more detailed revenue forecast.
This level of detail is useful because two restaurants with the same total sales can have very different profitability depending on what they sell. High-margin beverages, lower-margin food items, breakfast traffic, weekend demand, and specialty menu items can all change the financial outcome. By reviewing the breakdown, users can identify which categories contribute most to sales, where pricing strategy may need adjustment, and which menu streams may deserve additional marketing focus. It also helps support menu profitability analysis and gives investors a clearer view of the commercial logic behind the forecast.
KPI Dashboard
The KPI dashboard component tracks performance metrics that help users evaluate whether the restaurant is operating in line with expectations and industry standards. Key performance indicators may include revenue growth, gross margin, food cost percentage, labor cost percentage, prime cost, EBITDA margin, average check, customer volume, cash balance, payback period, and other operational or financial ratios. This dashboard is valuable because restaurant success is not measured only by total revenue. A restaurant can generate strong sales but still struggle if labor costs are too high, food waste is not controlled, or cash flow is weak.
The KPI dashboard helps users monitor the health of the business from several angles and compare results against planning targets or industry benchmarks. It also supports ongoing management after launch because users can update assumptions or actuals and quickly review whether performance is improving or deteriorating. For stakeholders, the KPI dashboard provides a clean way to communicate the financial discipline of the concept and show that management understands the metrics that matter most in food and beverage operations.
Startup Cost and Initial Capital Planning
The startup cost and initial capital planning component helps users estimate the upfront investment required to open the all-day restaurant and prepare it for operations. This section can include one-time costs such as lease deposits, build-out, fixtures, kitchen equipment, refrigeration, point-of-sale systems, signage, licenses, permits, legal setup, professional fees, initial inventory, pre-opening payroll, launch marketing, and working capital reserves.
For a restaurant, underestimating startup costs can create serious cash pressure before the business has a chance to stabilize, so this component gives users a more disciplined way to define funding needs before launch. Inputs may be customized based on the size of the restaurant, location, service model, menu complexity, equipment requirements, and opening strategy. The outputs help show total capital required, how funds are allocated, and whether additional financing may be needed to cover the early operating period. This is especially useful for business plans, investor decks, bank applications, and founder planning because it connects the opening budget with the cash flow forecast and reduces the risk of missing important pre-opening expenses.
Break-Even Analysis
The break-even analysis component helps users identify when the restaurant is expected to cover its fixed and variable costs and begin generating profit. This section may use revenue forecasts, cost of goods sold, payroll, rent, utilities, marketing, overhead, and other operating expenses to calculate the sales level or time period required to reach break-even. For an all-day restaurant, break-even planning is especially important because the business must balance food margins, labor scheduling, customer traffic, and fixed occupancy costs from the earliest months of operation.
Users can test how changes in average check size, daily covers, food cost percentage, labor costs, or rent affect the break-even point. The output can help founders understand whether the planned concept has enough revenue capacity to support its cost structure and how quickly the business may become self-sustaining. It also gives investors and lenders a clear milestone to evaluate risk. By including break-even analysis inside the financial model, users can make better decisions about pricing, staffing, marketing, operating hours, and the amount of working capital needed during the launch phase.
File types:
Excel – Single-User: .xlsx
Excel – Multi-User: .xlsx
Similar ProductsOther customers were also interested in...


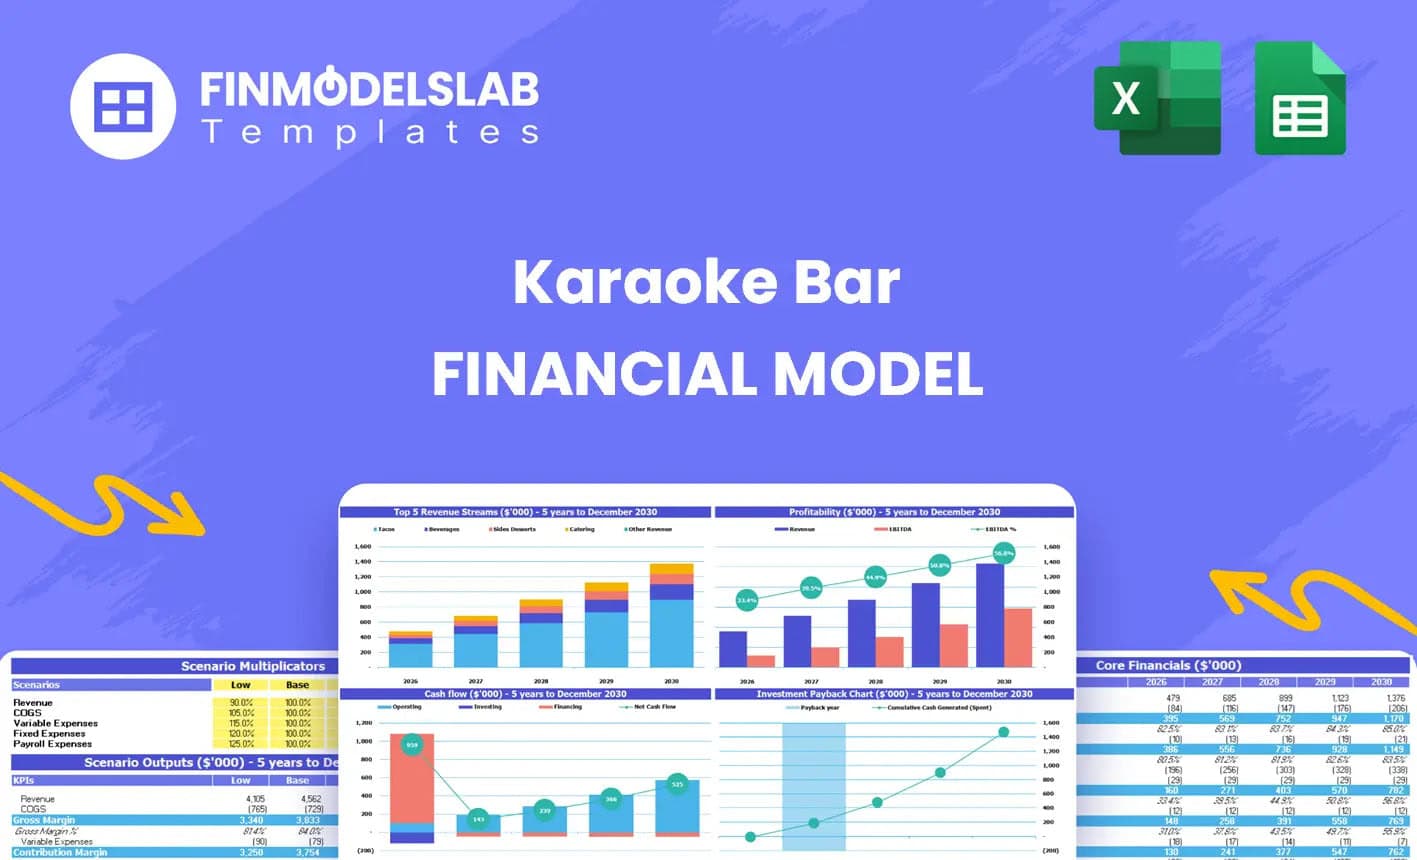
 HenrySheykin
Karaoke Bar Business Plan Financial Model Excel Te...
The Karaoke Bar Financial Model helps entrepreneurs, business owners, consultants, founders, and ana... Read more
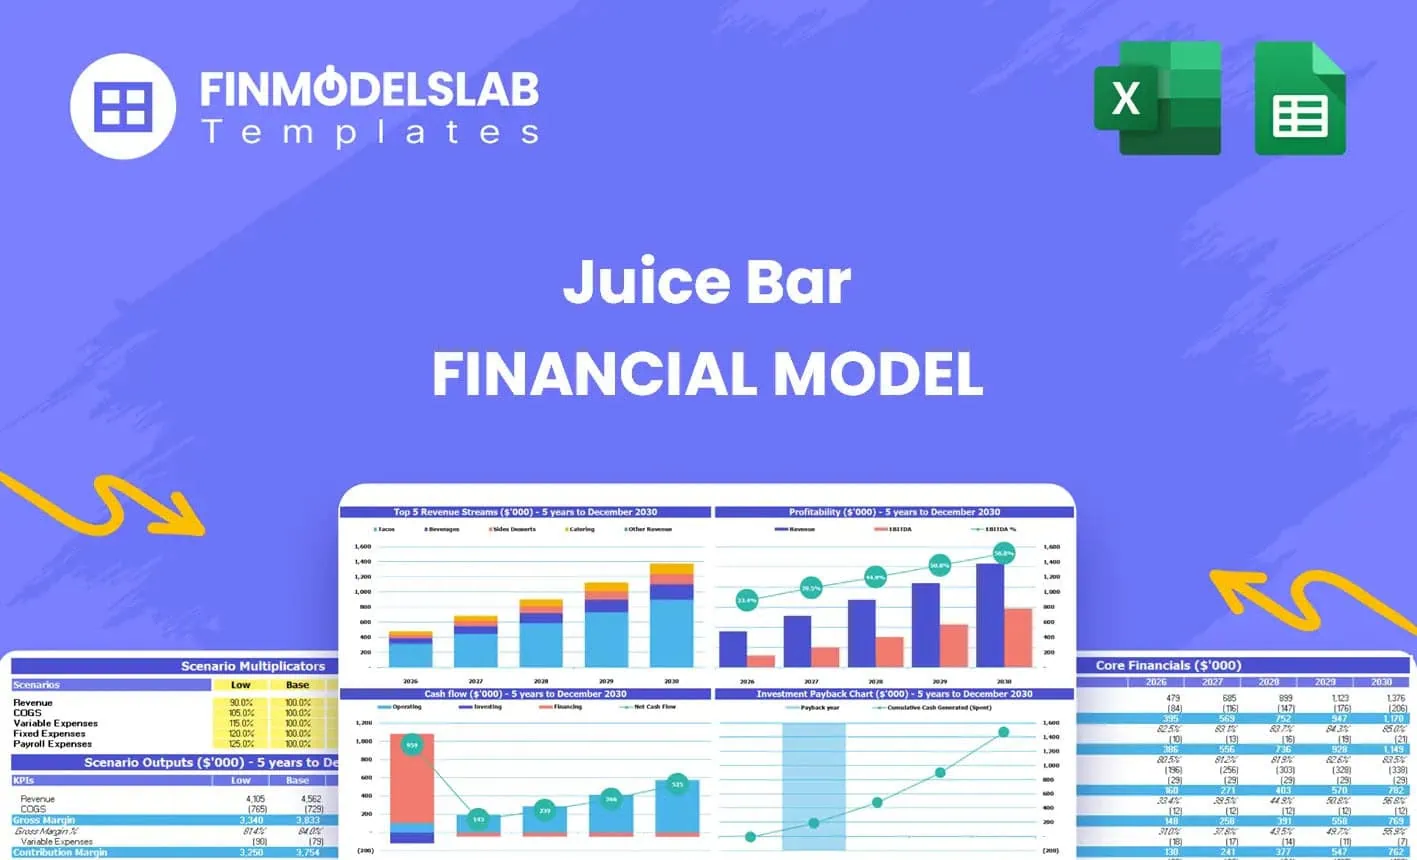
Juice Bar Financial Model Excel Template
The Juice Bar Financial Model helps entrepreneurs, founders, consultants, analysts, and business own... Read more
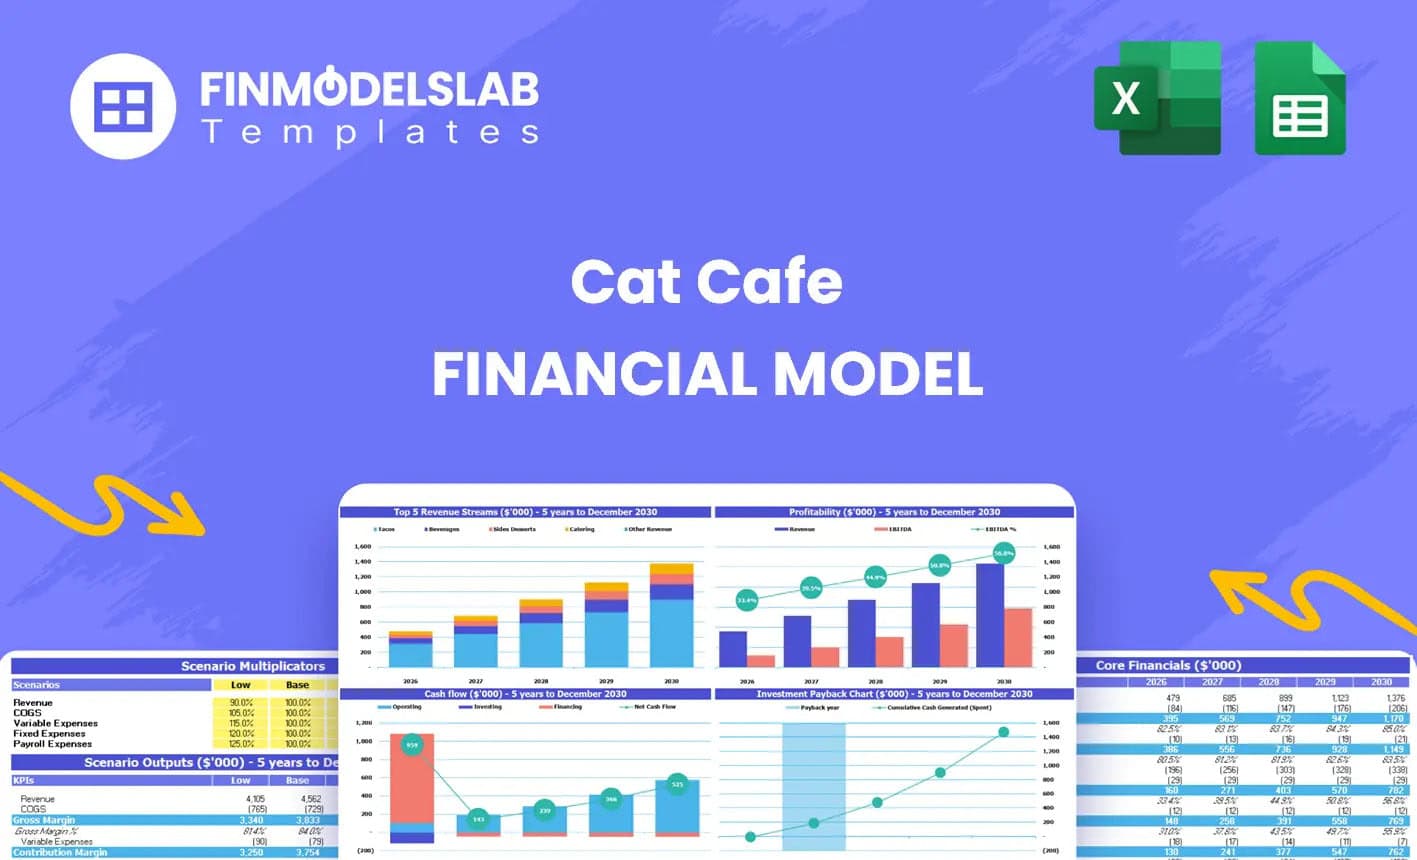
Cat Cafe Financial Model Excel Template
The Cat Cafe Financial Model helps entrepreneurs, founders, business owners, consultants, and analys... Read more

 Andreas
Start Up Bar Financial Model
Start Up Bar Business Financial Model presents the case of an investment in a bar business and its o... Read more

 Giorgos
Golf & Entertainment Center – 5 Year Financi...
Financial Model providing an advanced 5-year financial plan for a startup or operating Golf & En... Read more

Coffee and Snack Financial Model
This is a financial model for starting a coffee shop with snacks. The model supports both sitting cl... Read more

Cocktail Bar – 5 Year Financial Model
Financial Model providing an advanced 5-year financial plan for a startup or operating Cocktail Bar.... Read more
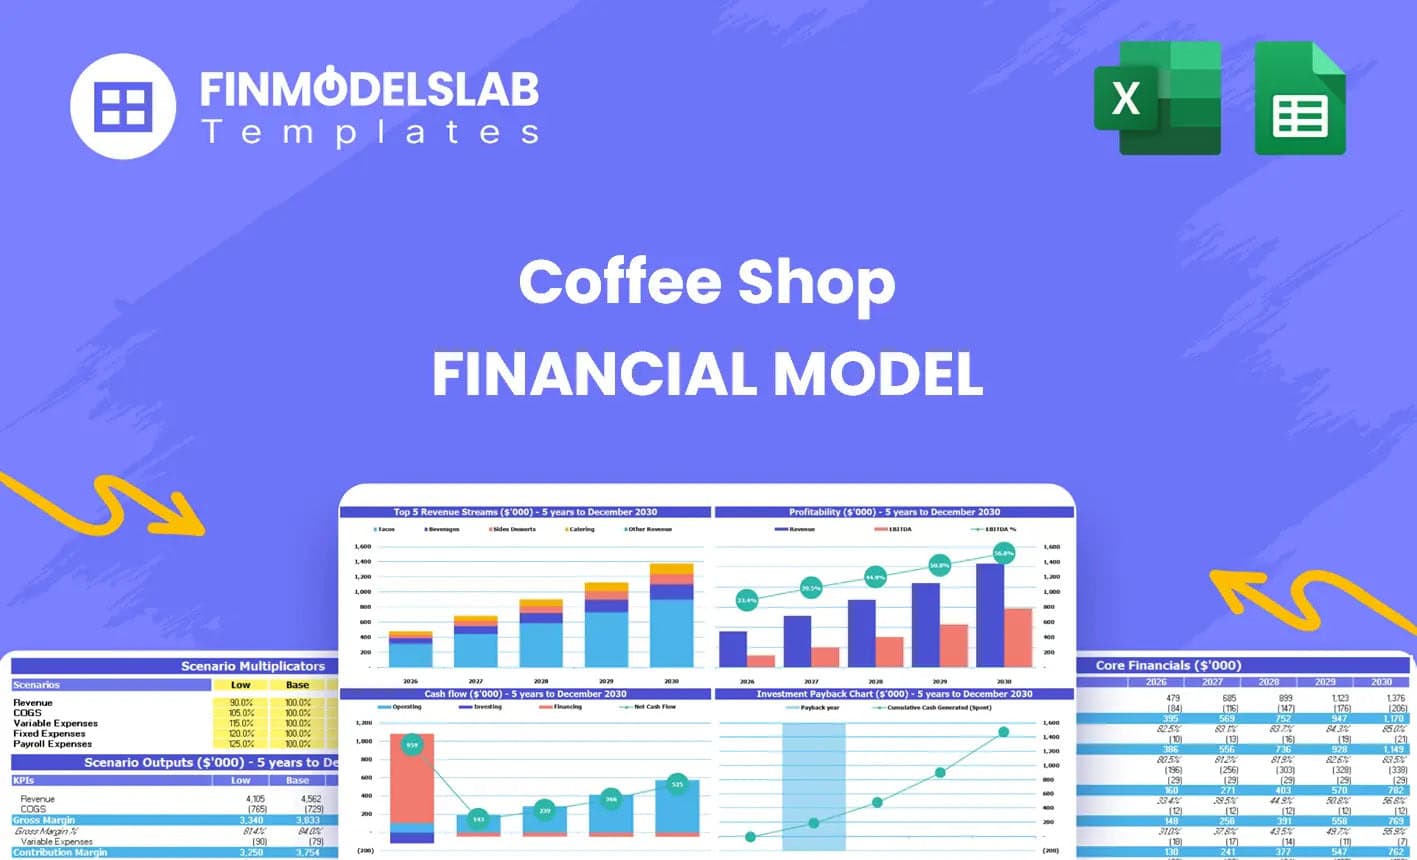
Coffee Shop Financial Model Excel Template
The Coffee Shop Financial Model helps entrepreneurs, founders, business owners, consultants, and ana... Read more
Bar Financial Model Excel Template
The Bar Financial Model Financial Model Template helps entrepreneurs, bar owners, consultants, analy... Read more
Cafe Financial Model Excel Template
The Cafe Financial Model is a ready-to-use financial model template designed to help entrepreneurs, ... Read more
You must log in to submit a review.