
0 ITEMS

Brewery Business Plan Financial Model Excel Template
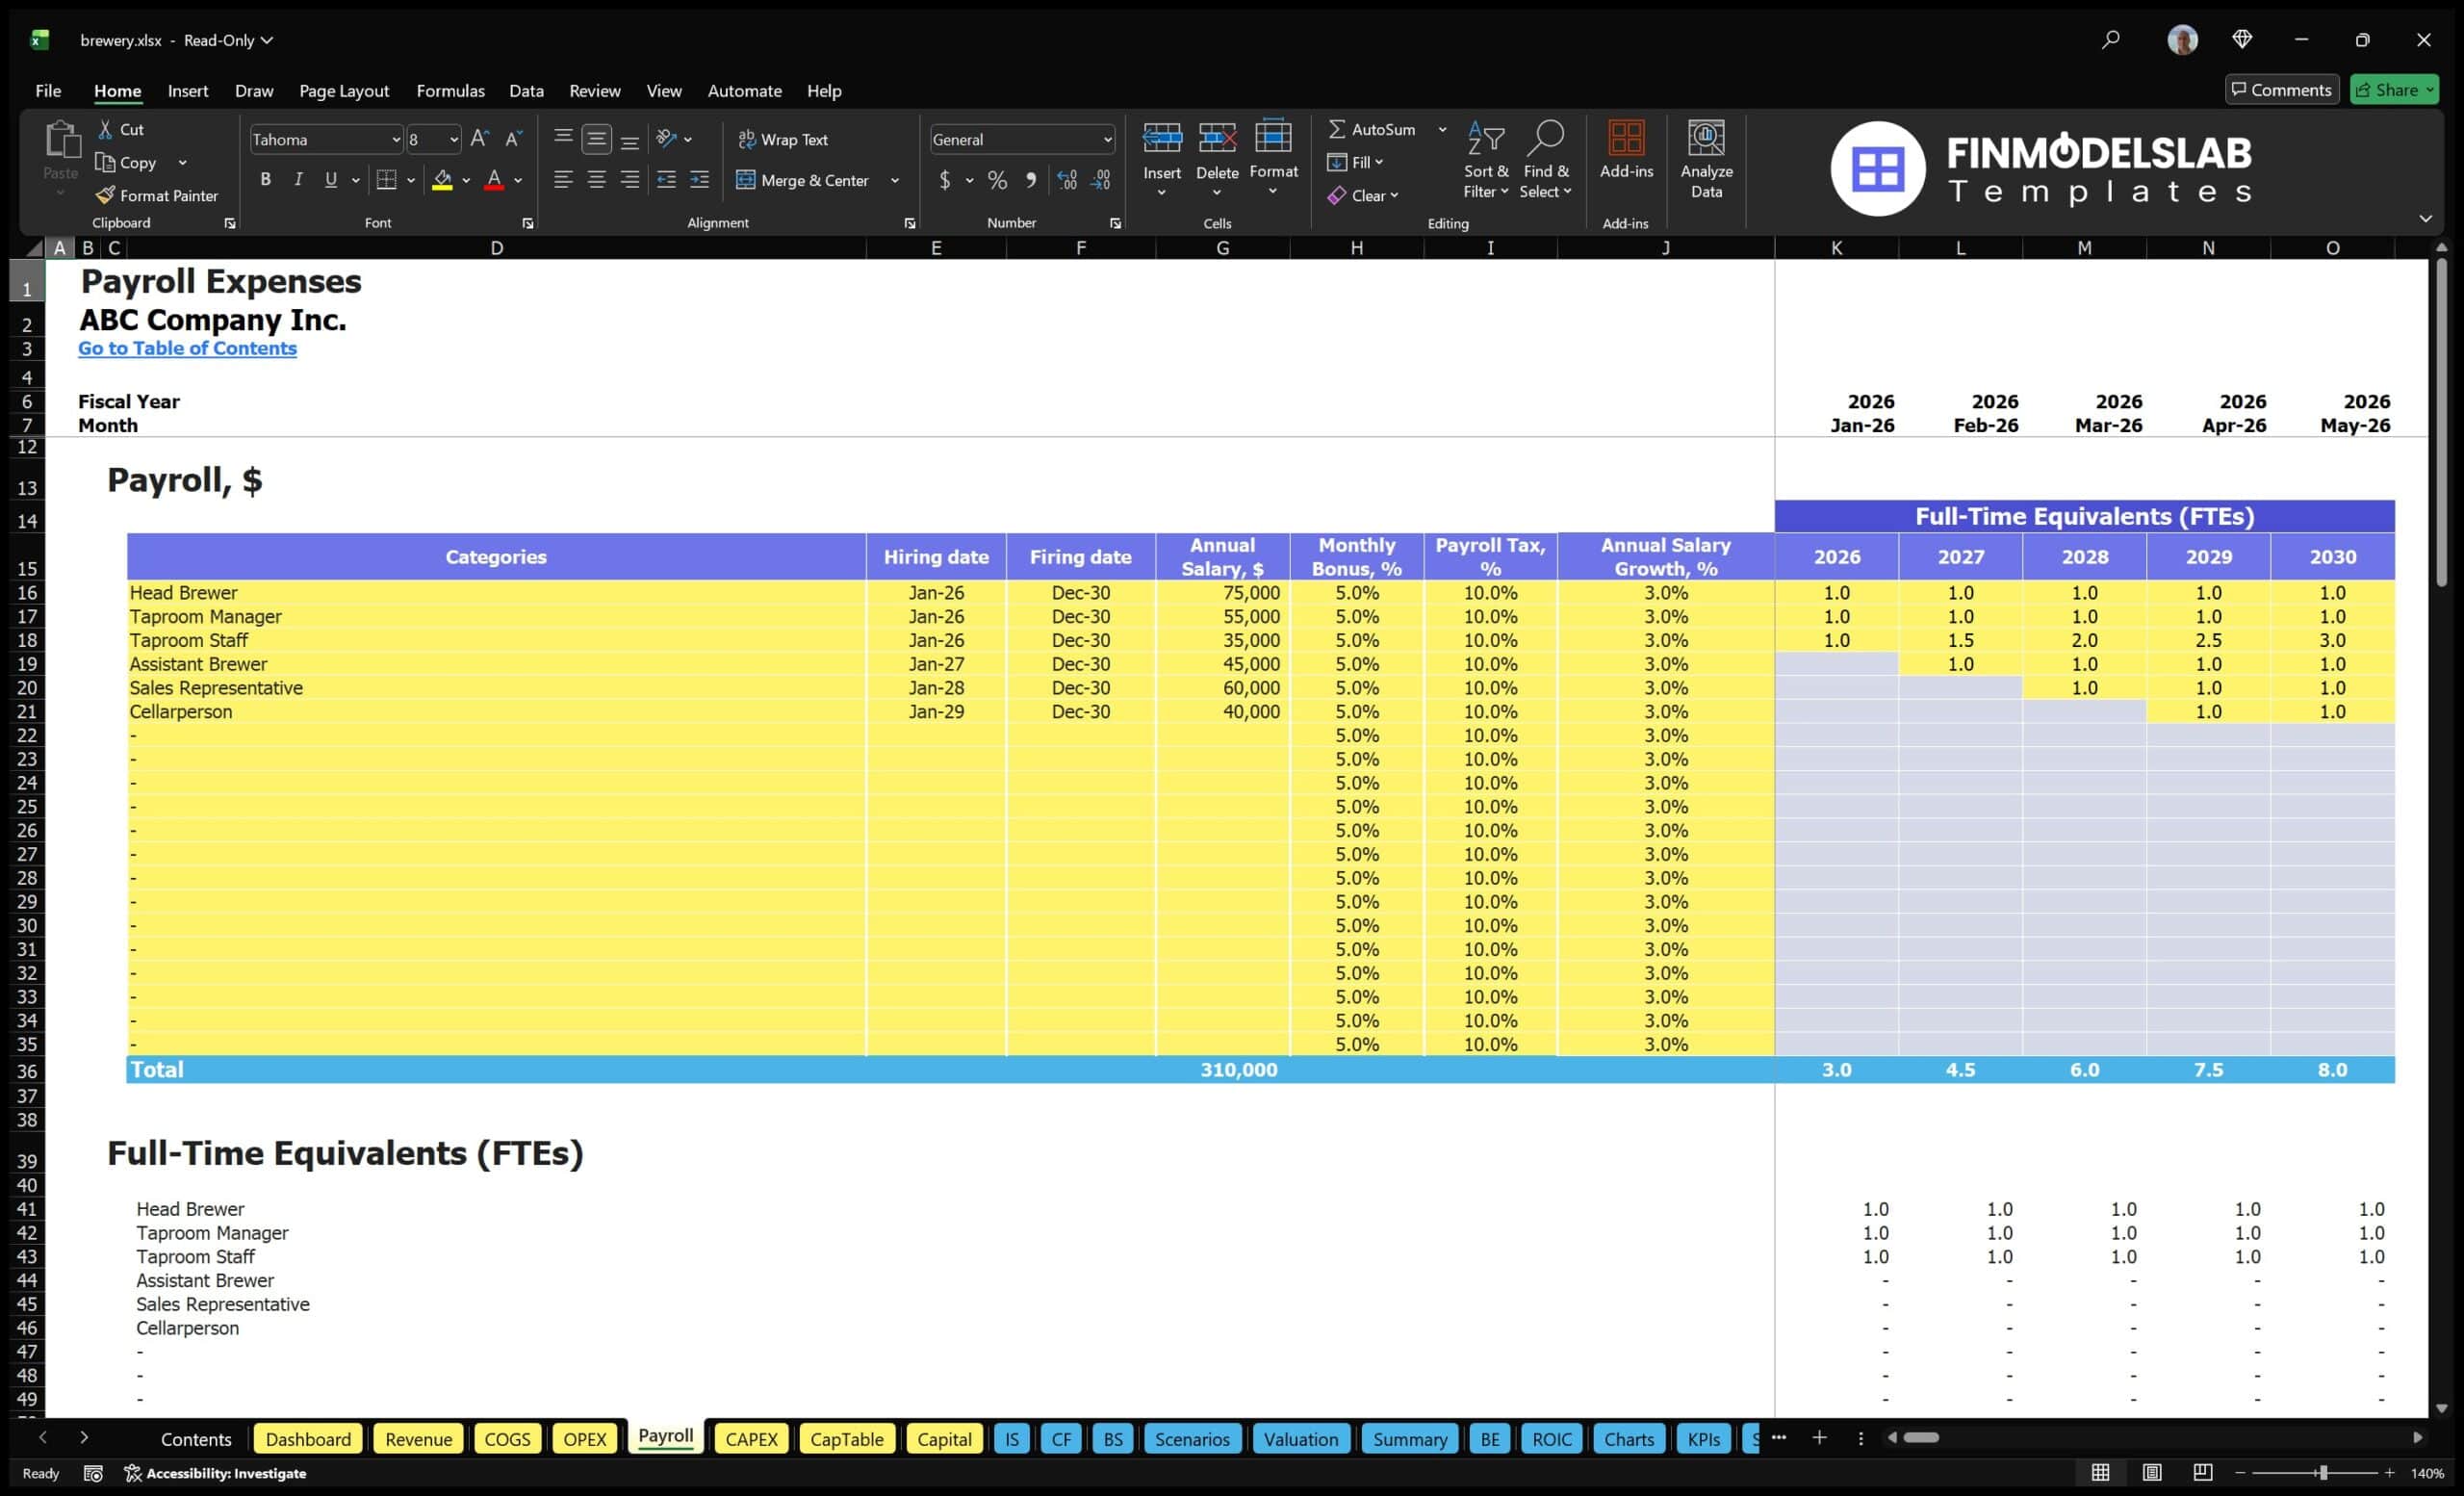
The Brewery Financial Model helps founders, brewery operators, consultants, and analysts turn a brewery concept into a structured five-year financial forecast. Instead of starting with a blank spreadsheet, users can work from a ready-made model built around the economics of a craft brewery, including production volume, beer pricing, product mix, operating expenses, payroll, startup costs, cash flow, and profitability. It is designed to support business planning, lender conversations, investor presentations, internal budgeting, and strategic decision-making. This financial model template is especially useful for entrepreneurs preparing to launch a microbrewery, taproom, or craft beer production business, as well as established brewery owners planning expansion, new equipment purchases, or additional revenue streams. Users can adjust assumptions for beer lines, sales volumes, pricing, ingredient costs, staffing, capital expenditures, and operating overhead to see how changes flow through the forecast. The model helps clarify whether the business has enough revenue potential to cover its cost structure, reach break-even, and generate sustainable profit over time. The Brewery Financial Model brings together key financial planning outputs in one editable workbook, including dashboards, scenario analysis, charts, revenue inputs, revenue breakdowns, KPI tracking, financial statements, and investor-oriented reports. It helps users evaluate low, base, and high cases, compare performance against benchmarks, review return metrics, and understand how production growth, pricing strategy, and cost control affect the long-term financial outlook. This makes it a practical tool for people who need clear numbers for funding documents, business plans, feasibility studies, or operational planning. Because the template is fully customizable and compatible with Excel and Google Sheets, users can tailor it to their own brewery size, location, product strategy, and funding structure. It saves time by providing built-in formulas, formatted outputs, and organized assumption sections while still giving users flexibility to personalize the model. Whether you are estimating startup investment, planning payroll, forecasting monthly cash flow, reviewing profitability, or preparing to explain your financial plan to lenders and stakeholders, this template provides a structured foundation for making more informed brewery business decisions.
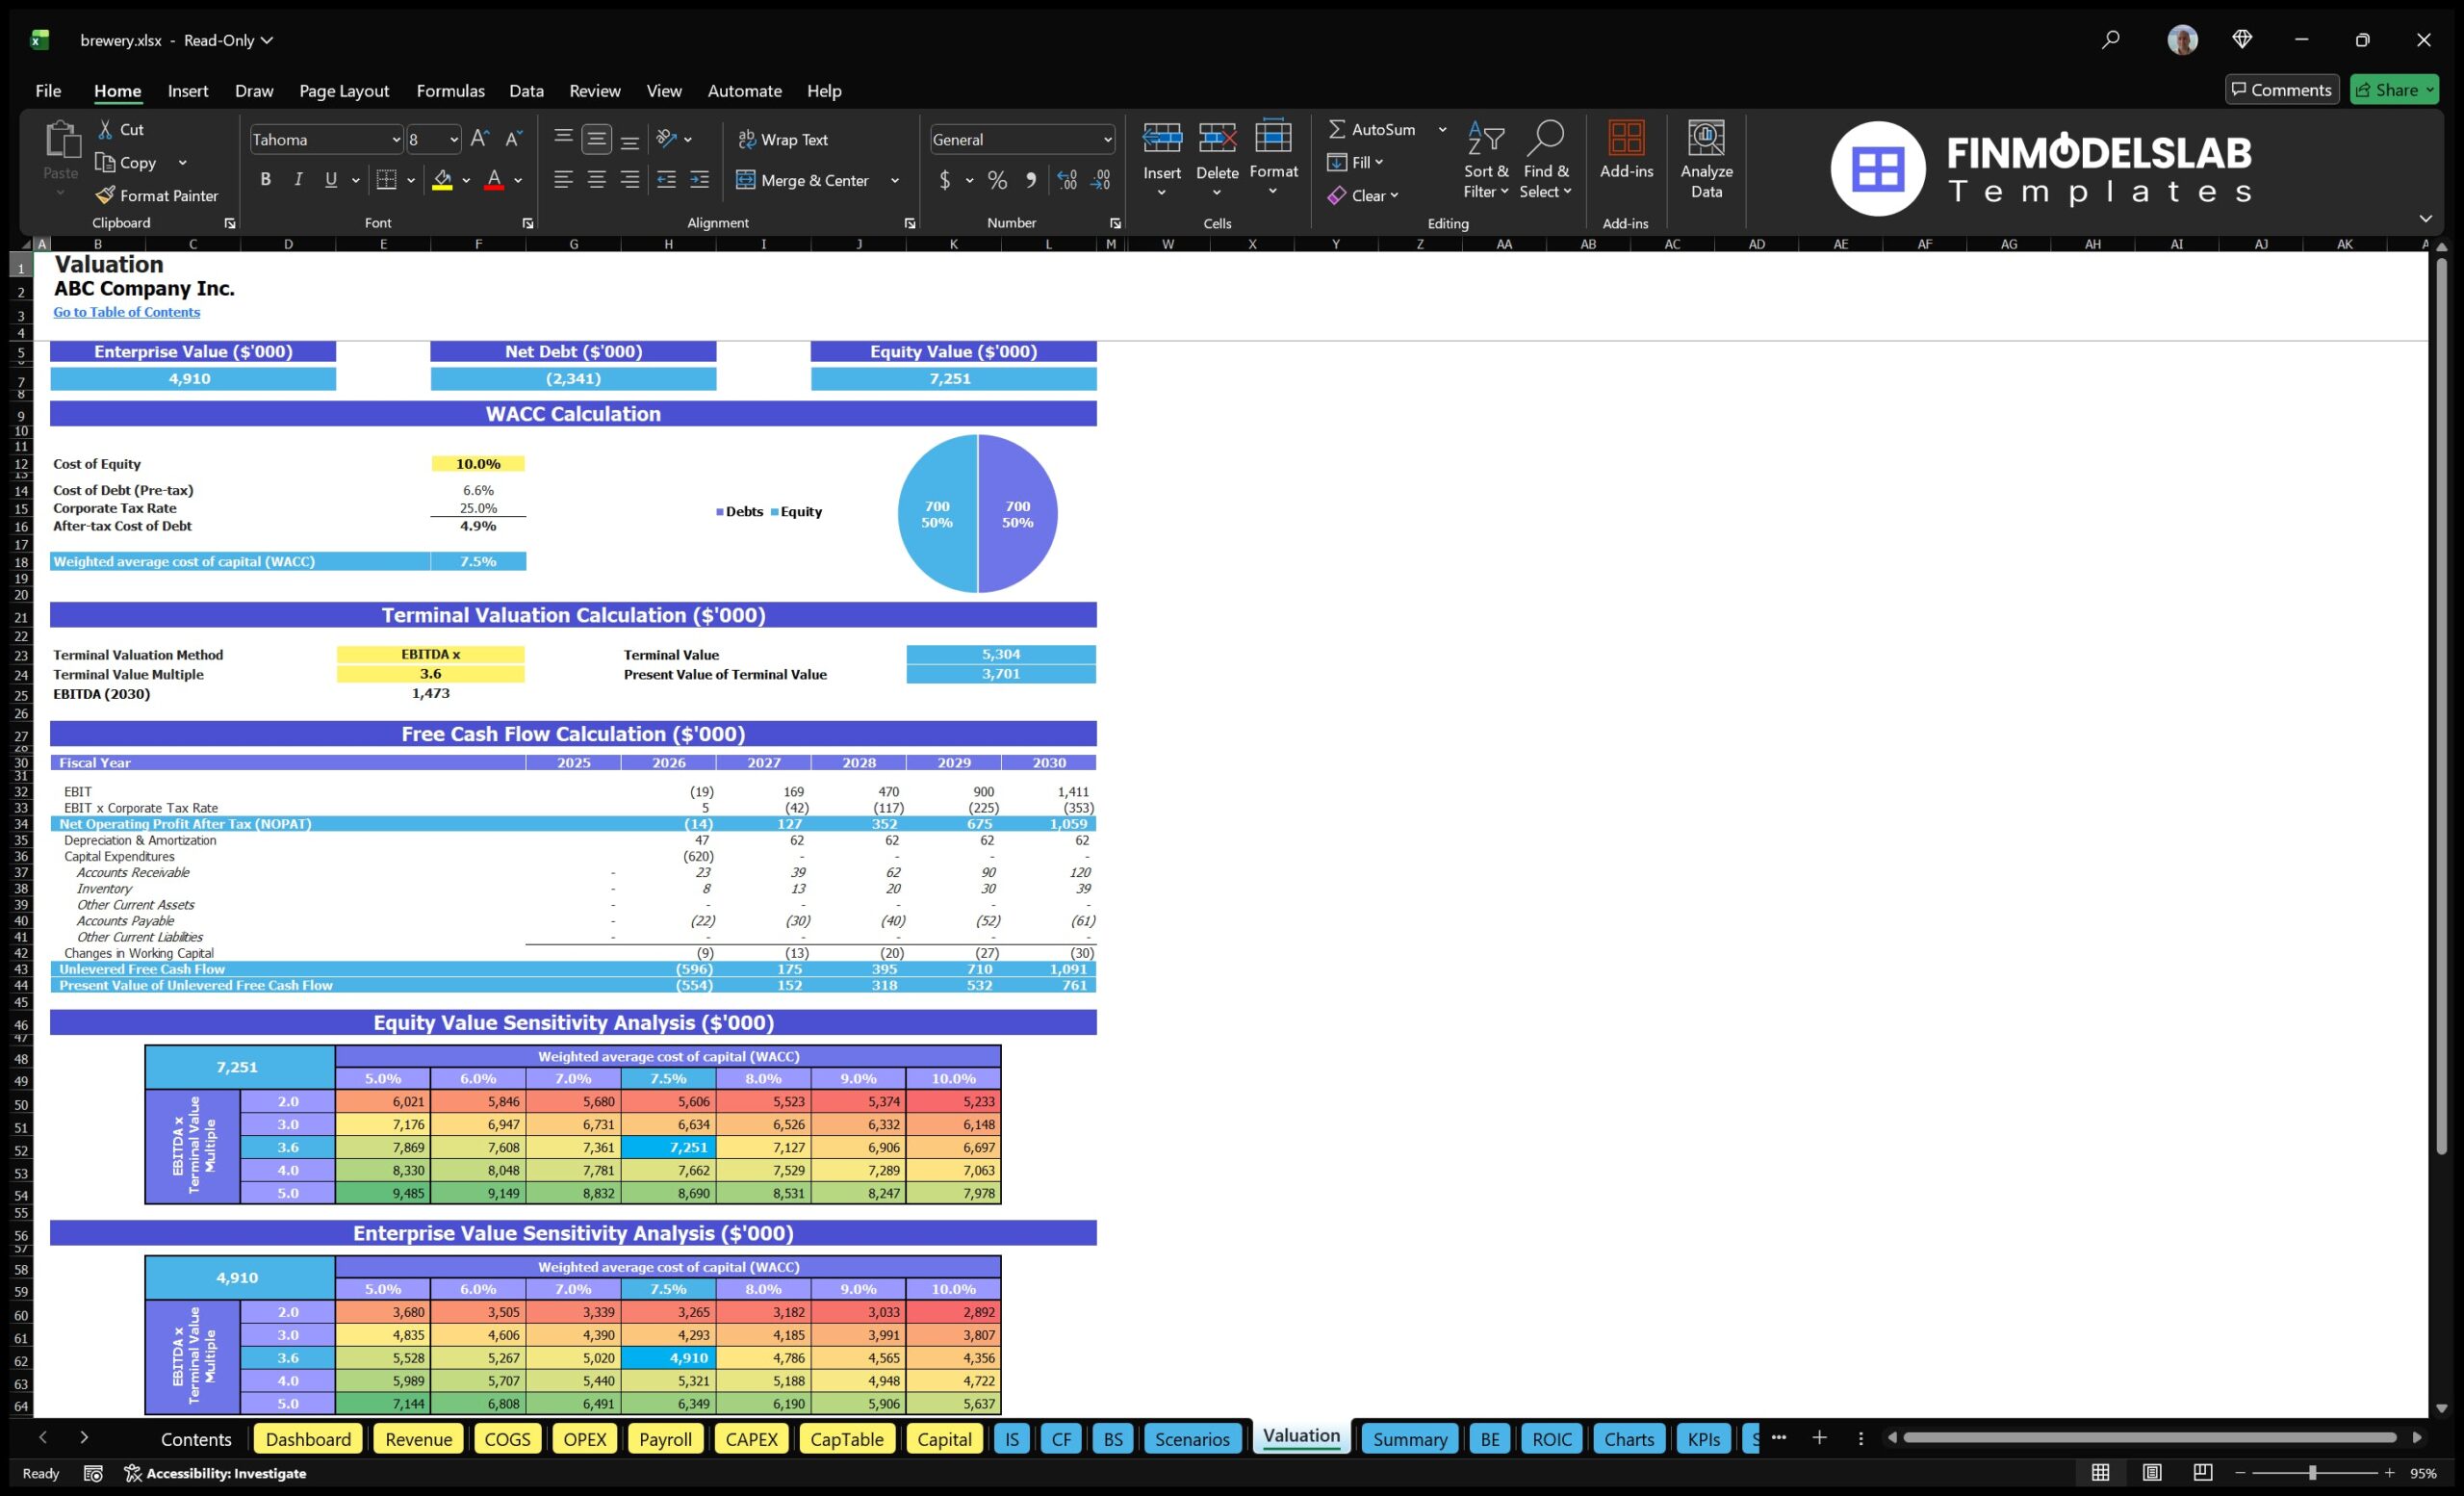
Financial Model Overview
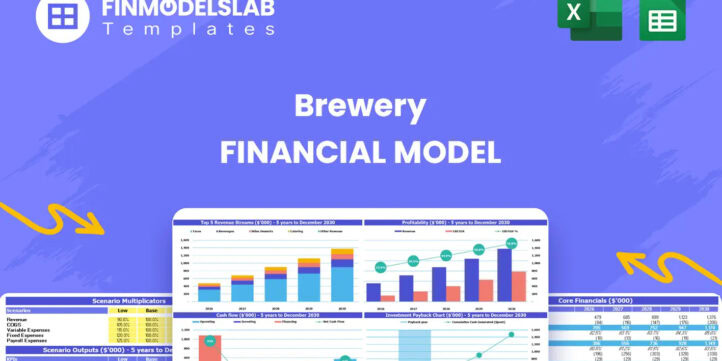
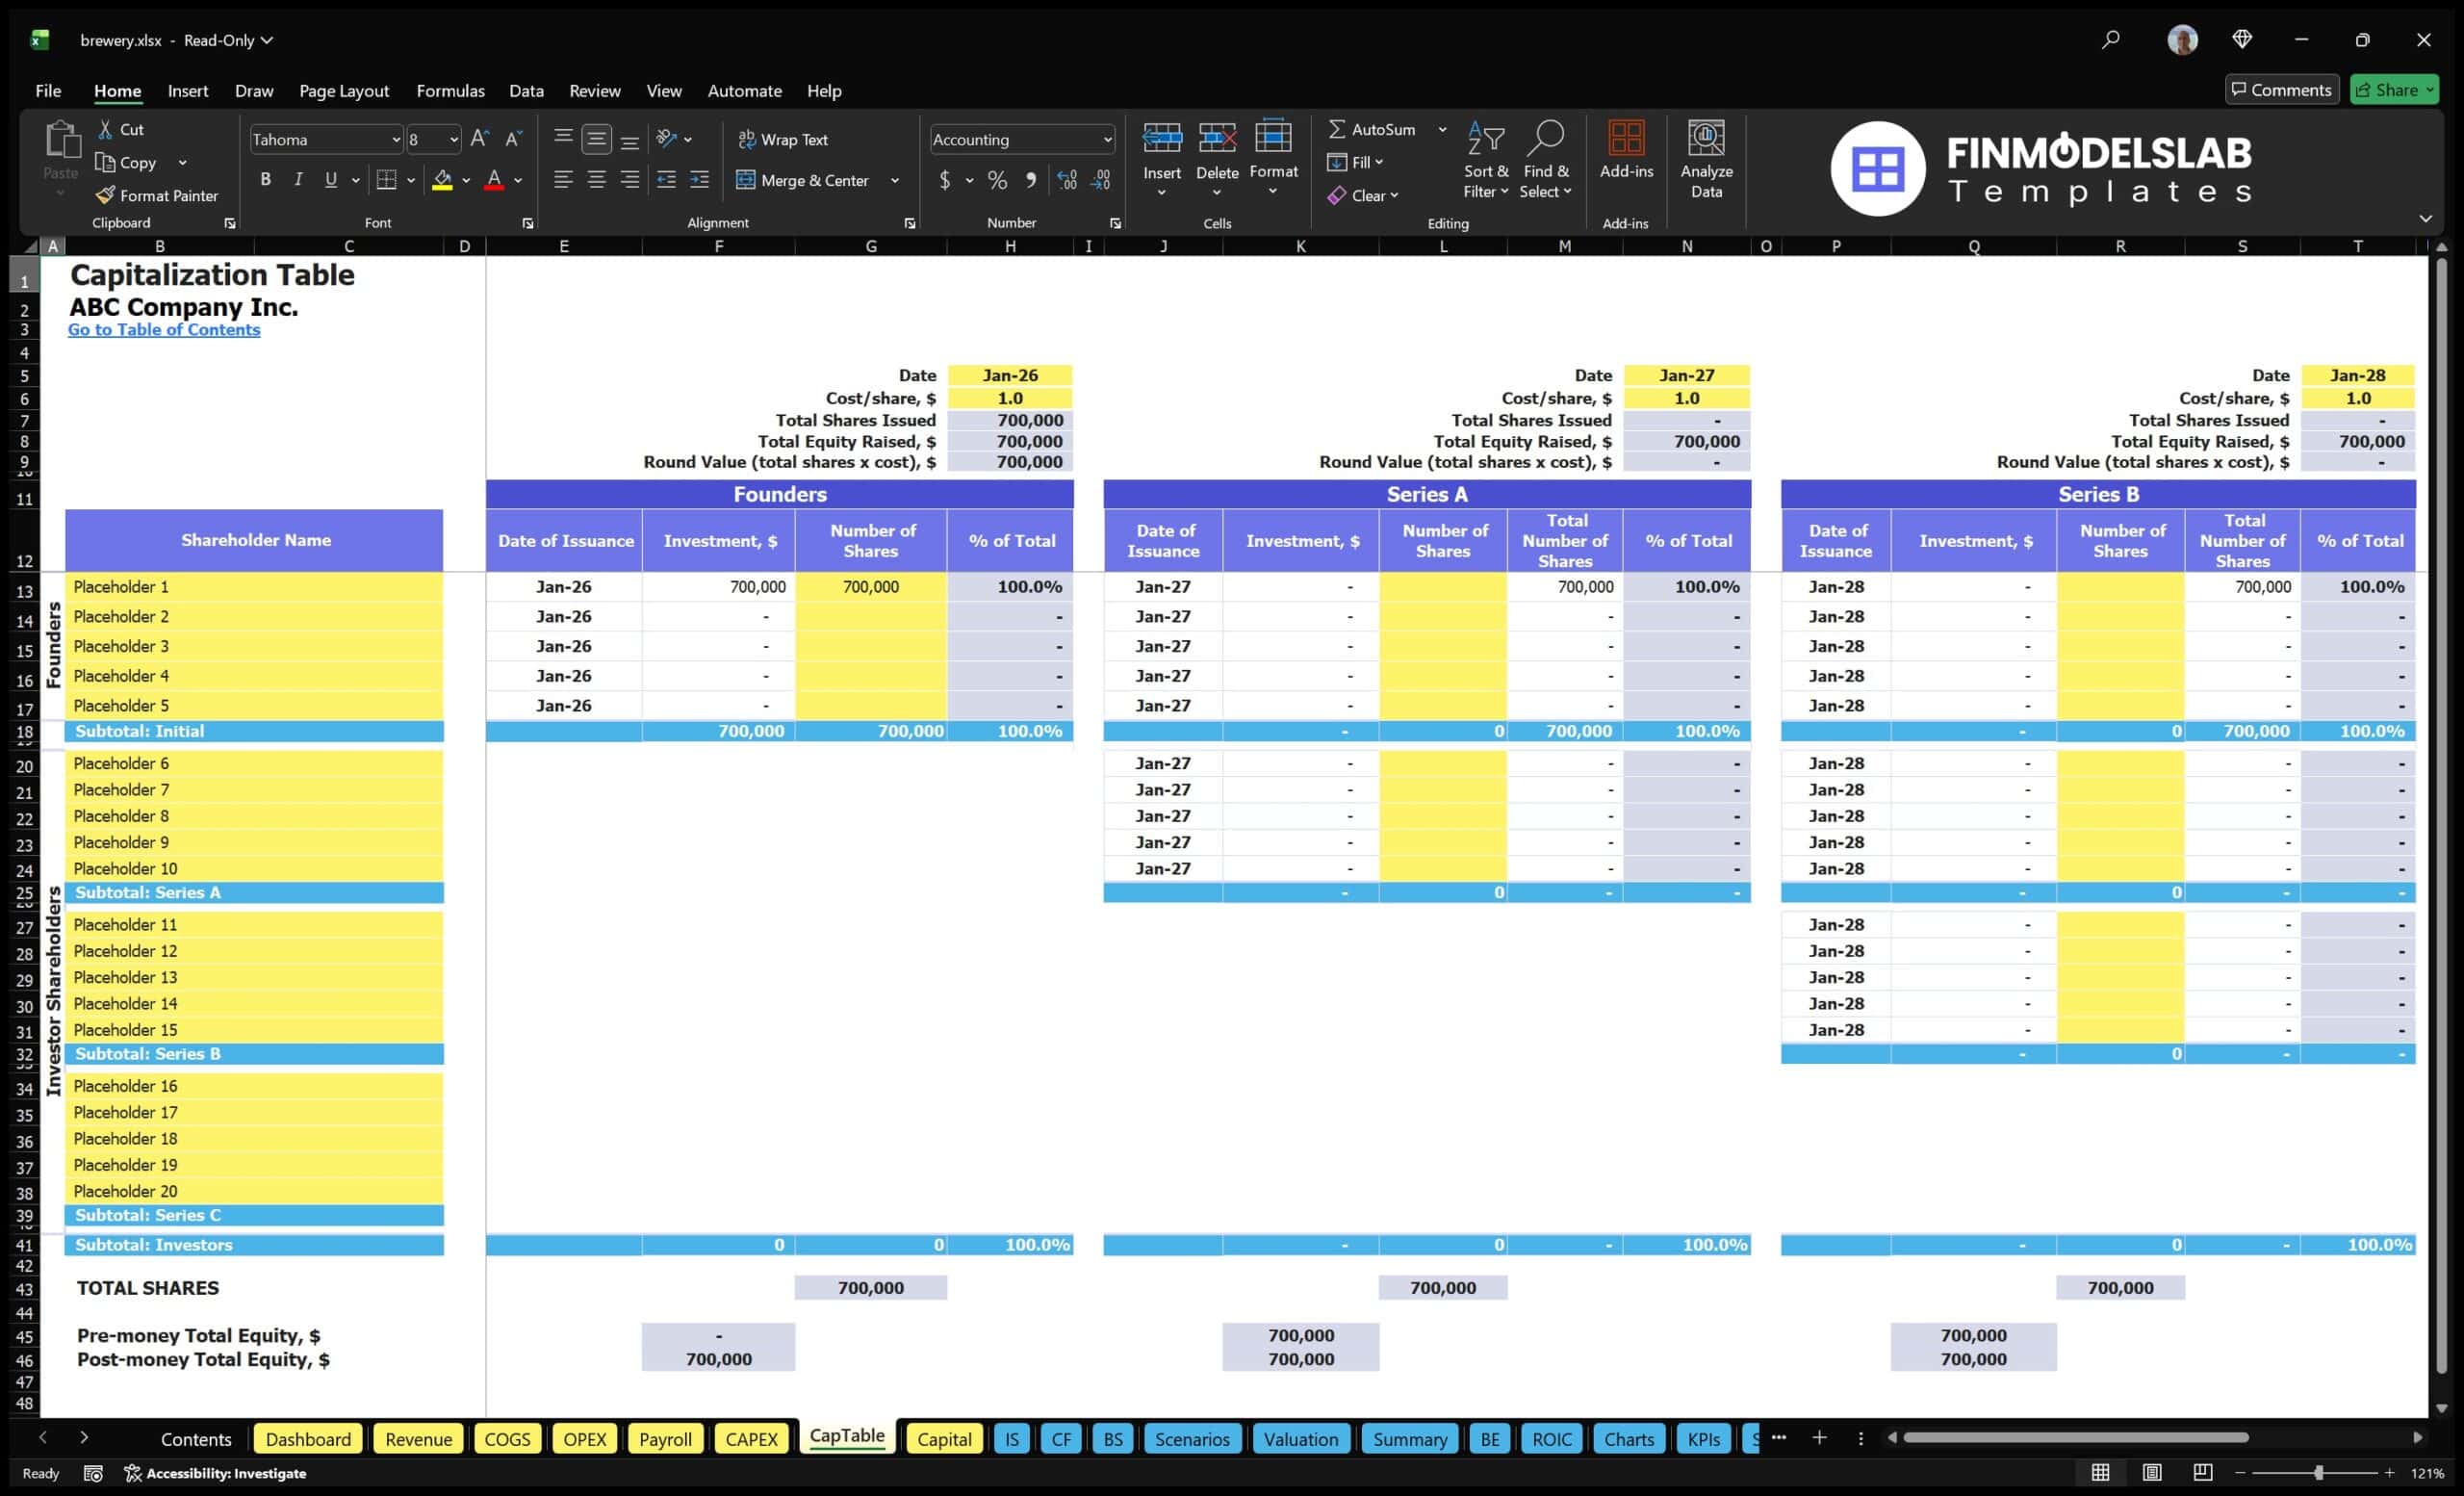
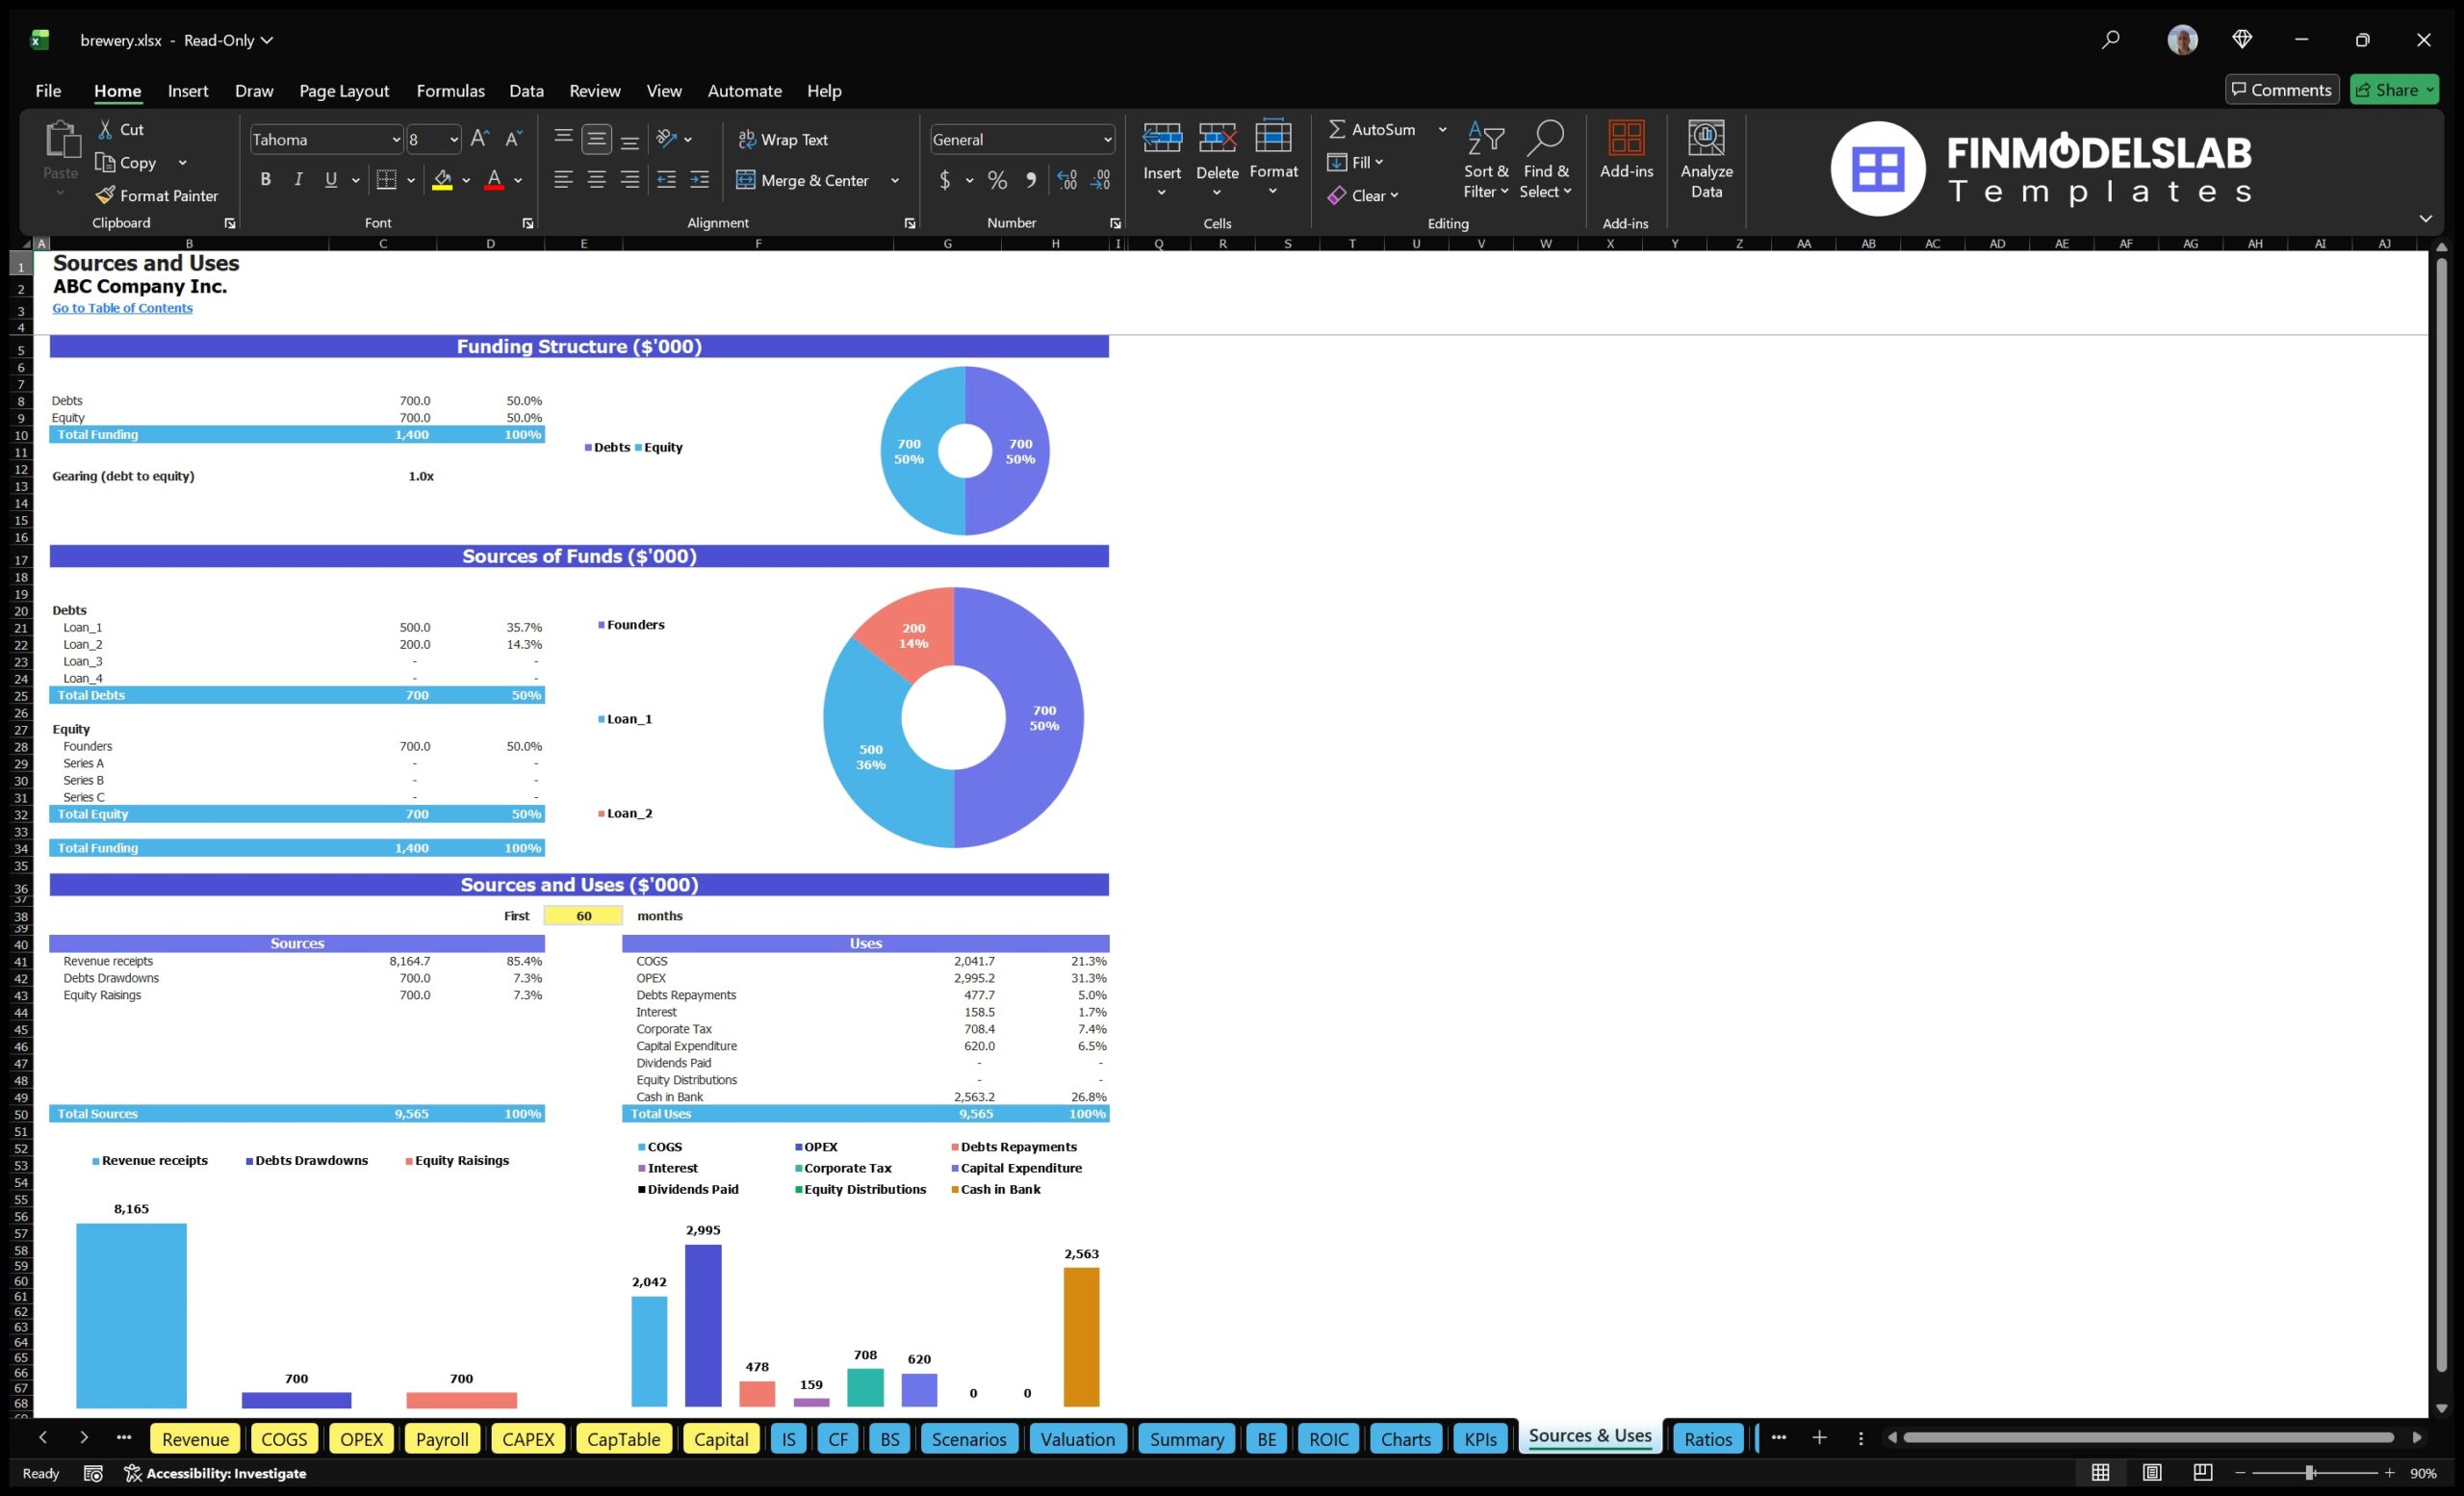
The Brewery Financial Model is a ready-to-use financial model template built for entrepreneurs, brewery founders, craft beer operators, consultants, and analysts who need to plan, fund, or evaluate a brewery business with clear financial projections. A brewery is capital-intensive, operationally detailed, and highly dependent on production volume, product mix, pricing, ingredient costs, taproom performance, wholesale demand, staffing, and working capital. This template brings those moving parts into one structured model so users can forecast revenue, operating expenses, startup investment, cash flow, profitability, and funding needs over a multi-year period. Instead of trying to build formulas and reports from scratch, users can enter their own assumptions and review the outputs in a format suitable for internal planning, lender review, investor discussions, and business plan development. The model is editable, practical, and designed to help users understand whether their brewery can scale profitably, maintain liquidity, and reach sustainable financial performance.
All-in-One Dashboard
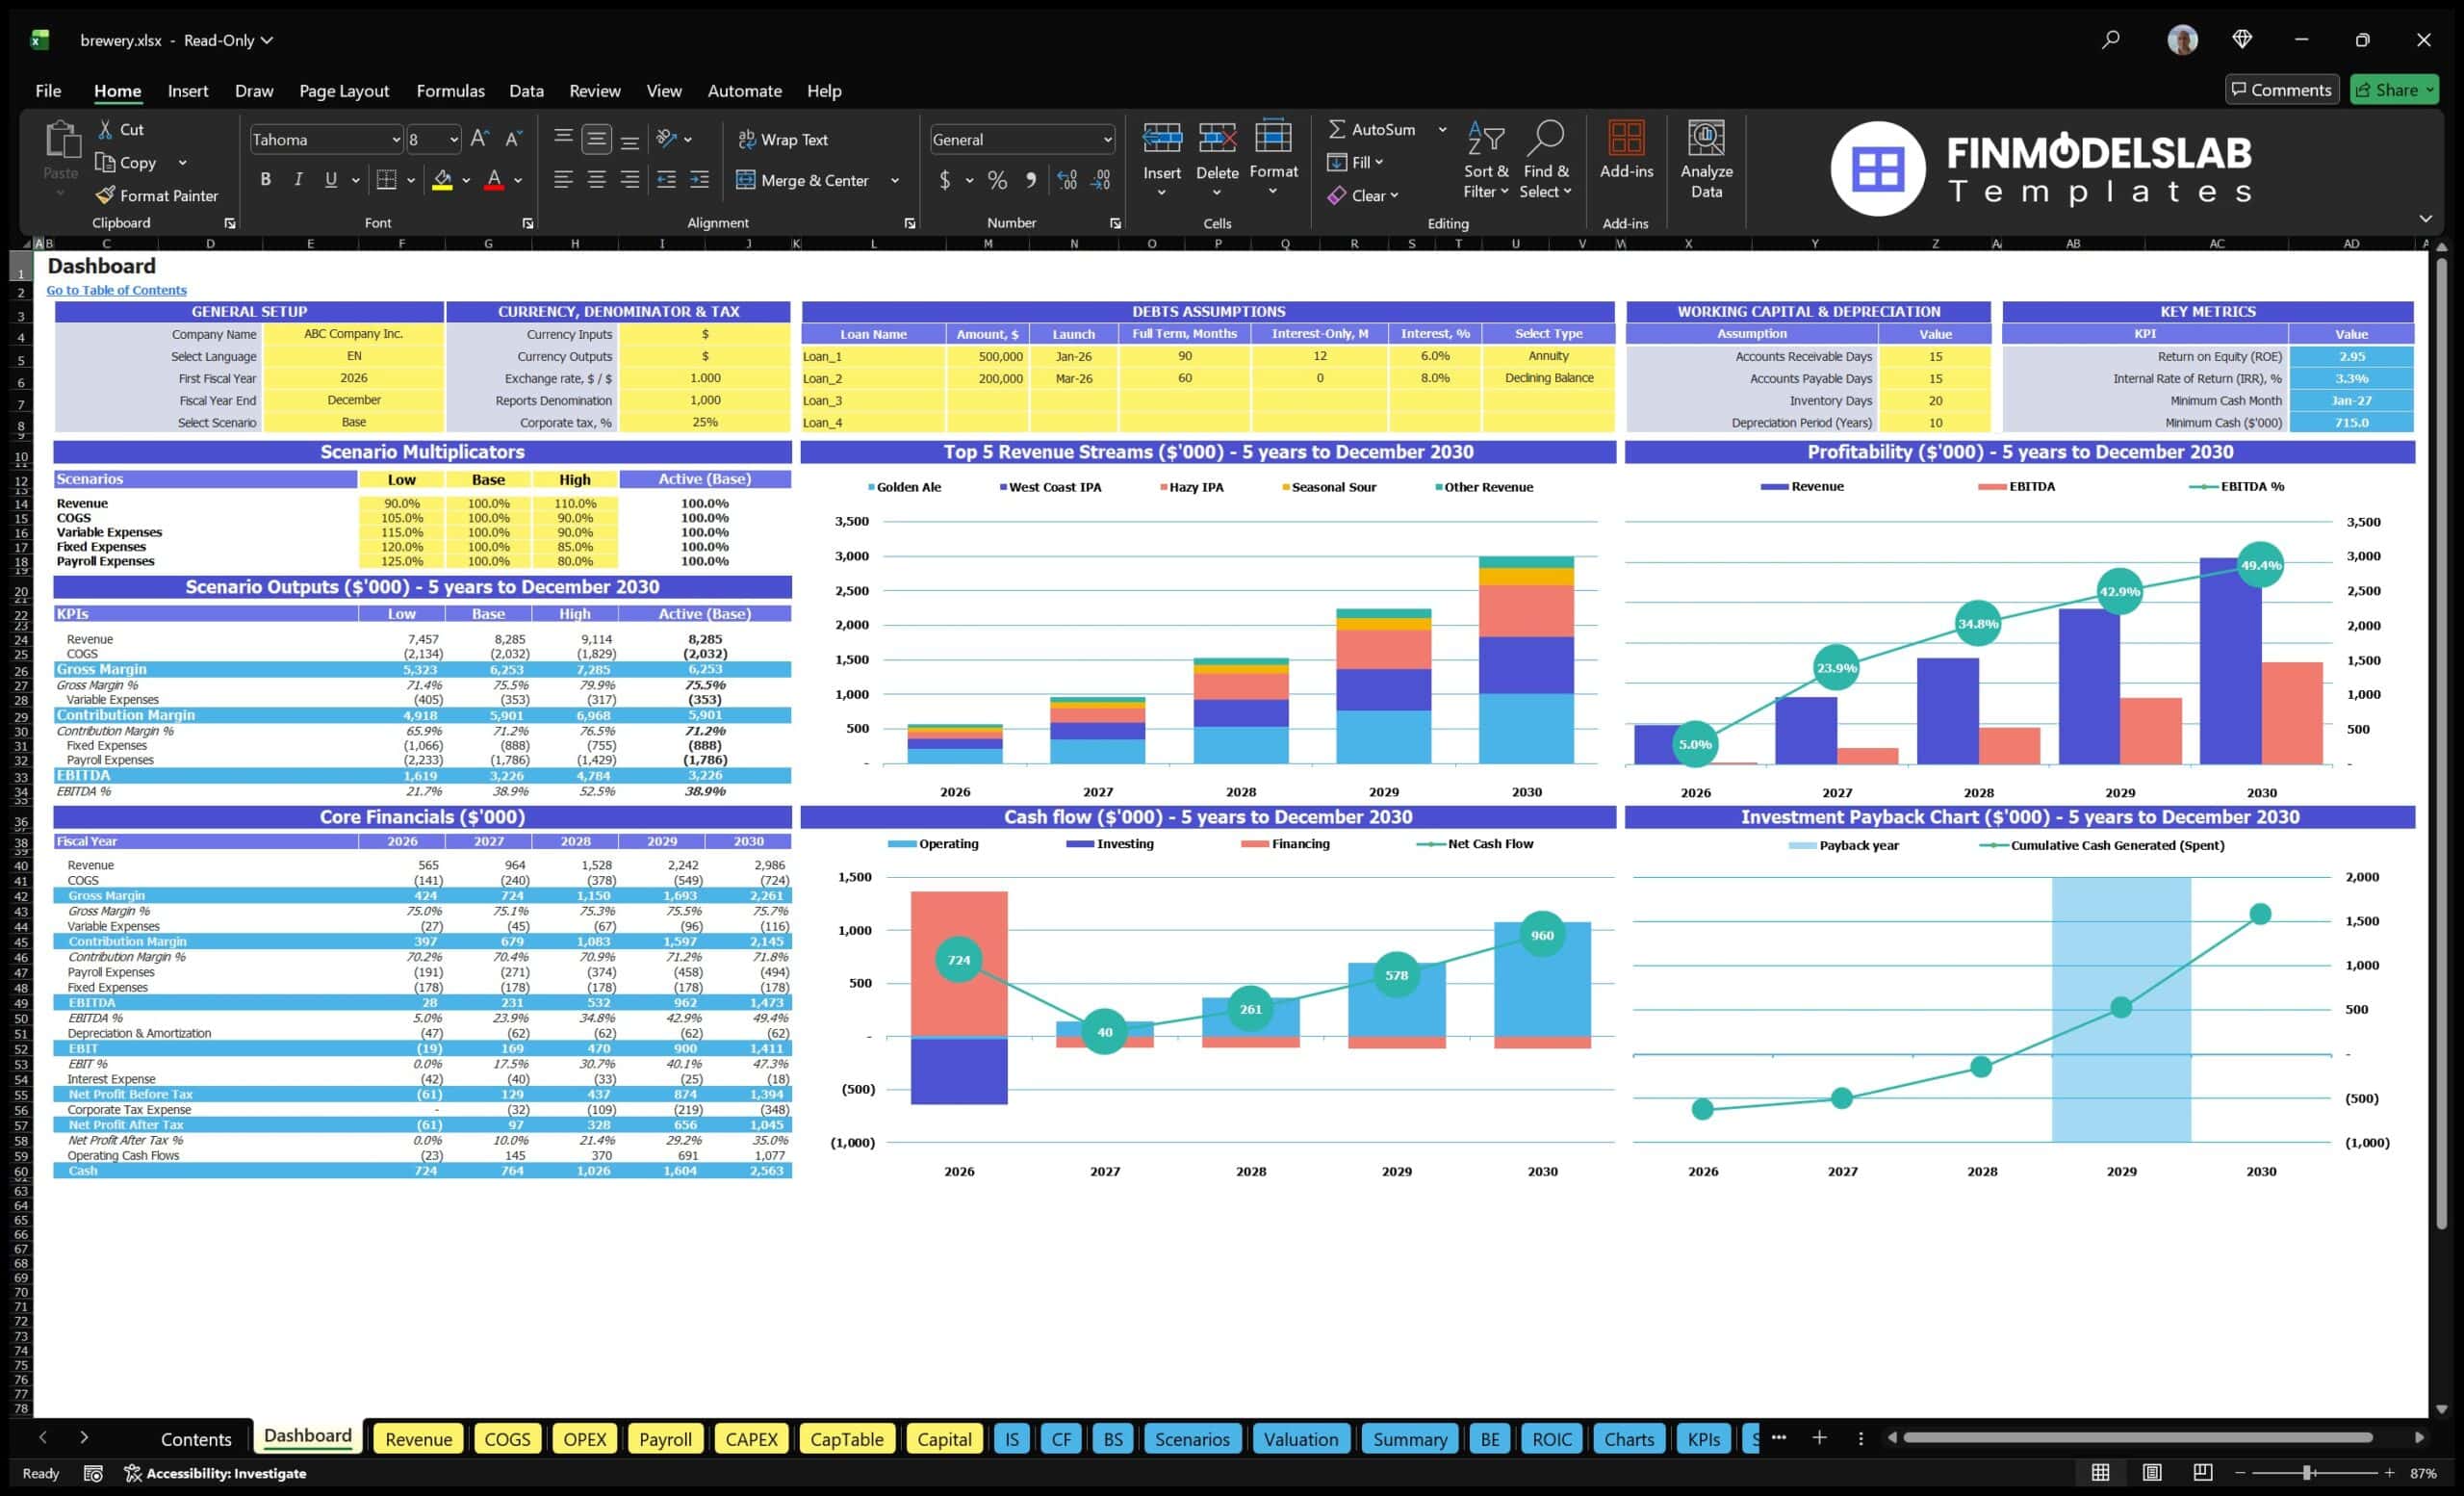
The all-in-one dashboard gives users a centralized view of the most important assumptions and outputs in the Brewery Financial Model. This section is designed to connect the core inputs, such as production volume, beer pricing, revenue mix, operating costs, capital spending, payroll, and financing assumptions, with the core outputs that matter for planning and decision-making. Users can quickly review projected revenue, gross profit, EBITDA, net income, cash balance, funding requirements, return metrics, and other high-level results without searching across multiple worksheets. For brewery founders and business owners, this dashboard helps translate detailed operating assumptions into a clear financial picture. For lenders, investors, and advisors, it provides a concise summary of how the brewery is expected to perform over time. The dashboard is especially useful when comparing different planning cases, checking whether the model reflects realistic expectations, and preparing for stakeholder conversations where users need to explain the financial logic behind the brewery’s launch, expansion, or funding plan.
Low Base High Scenario Analysis
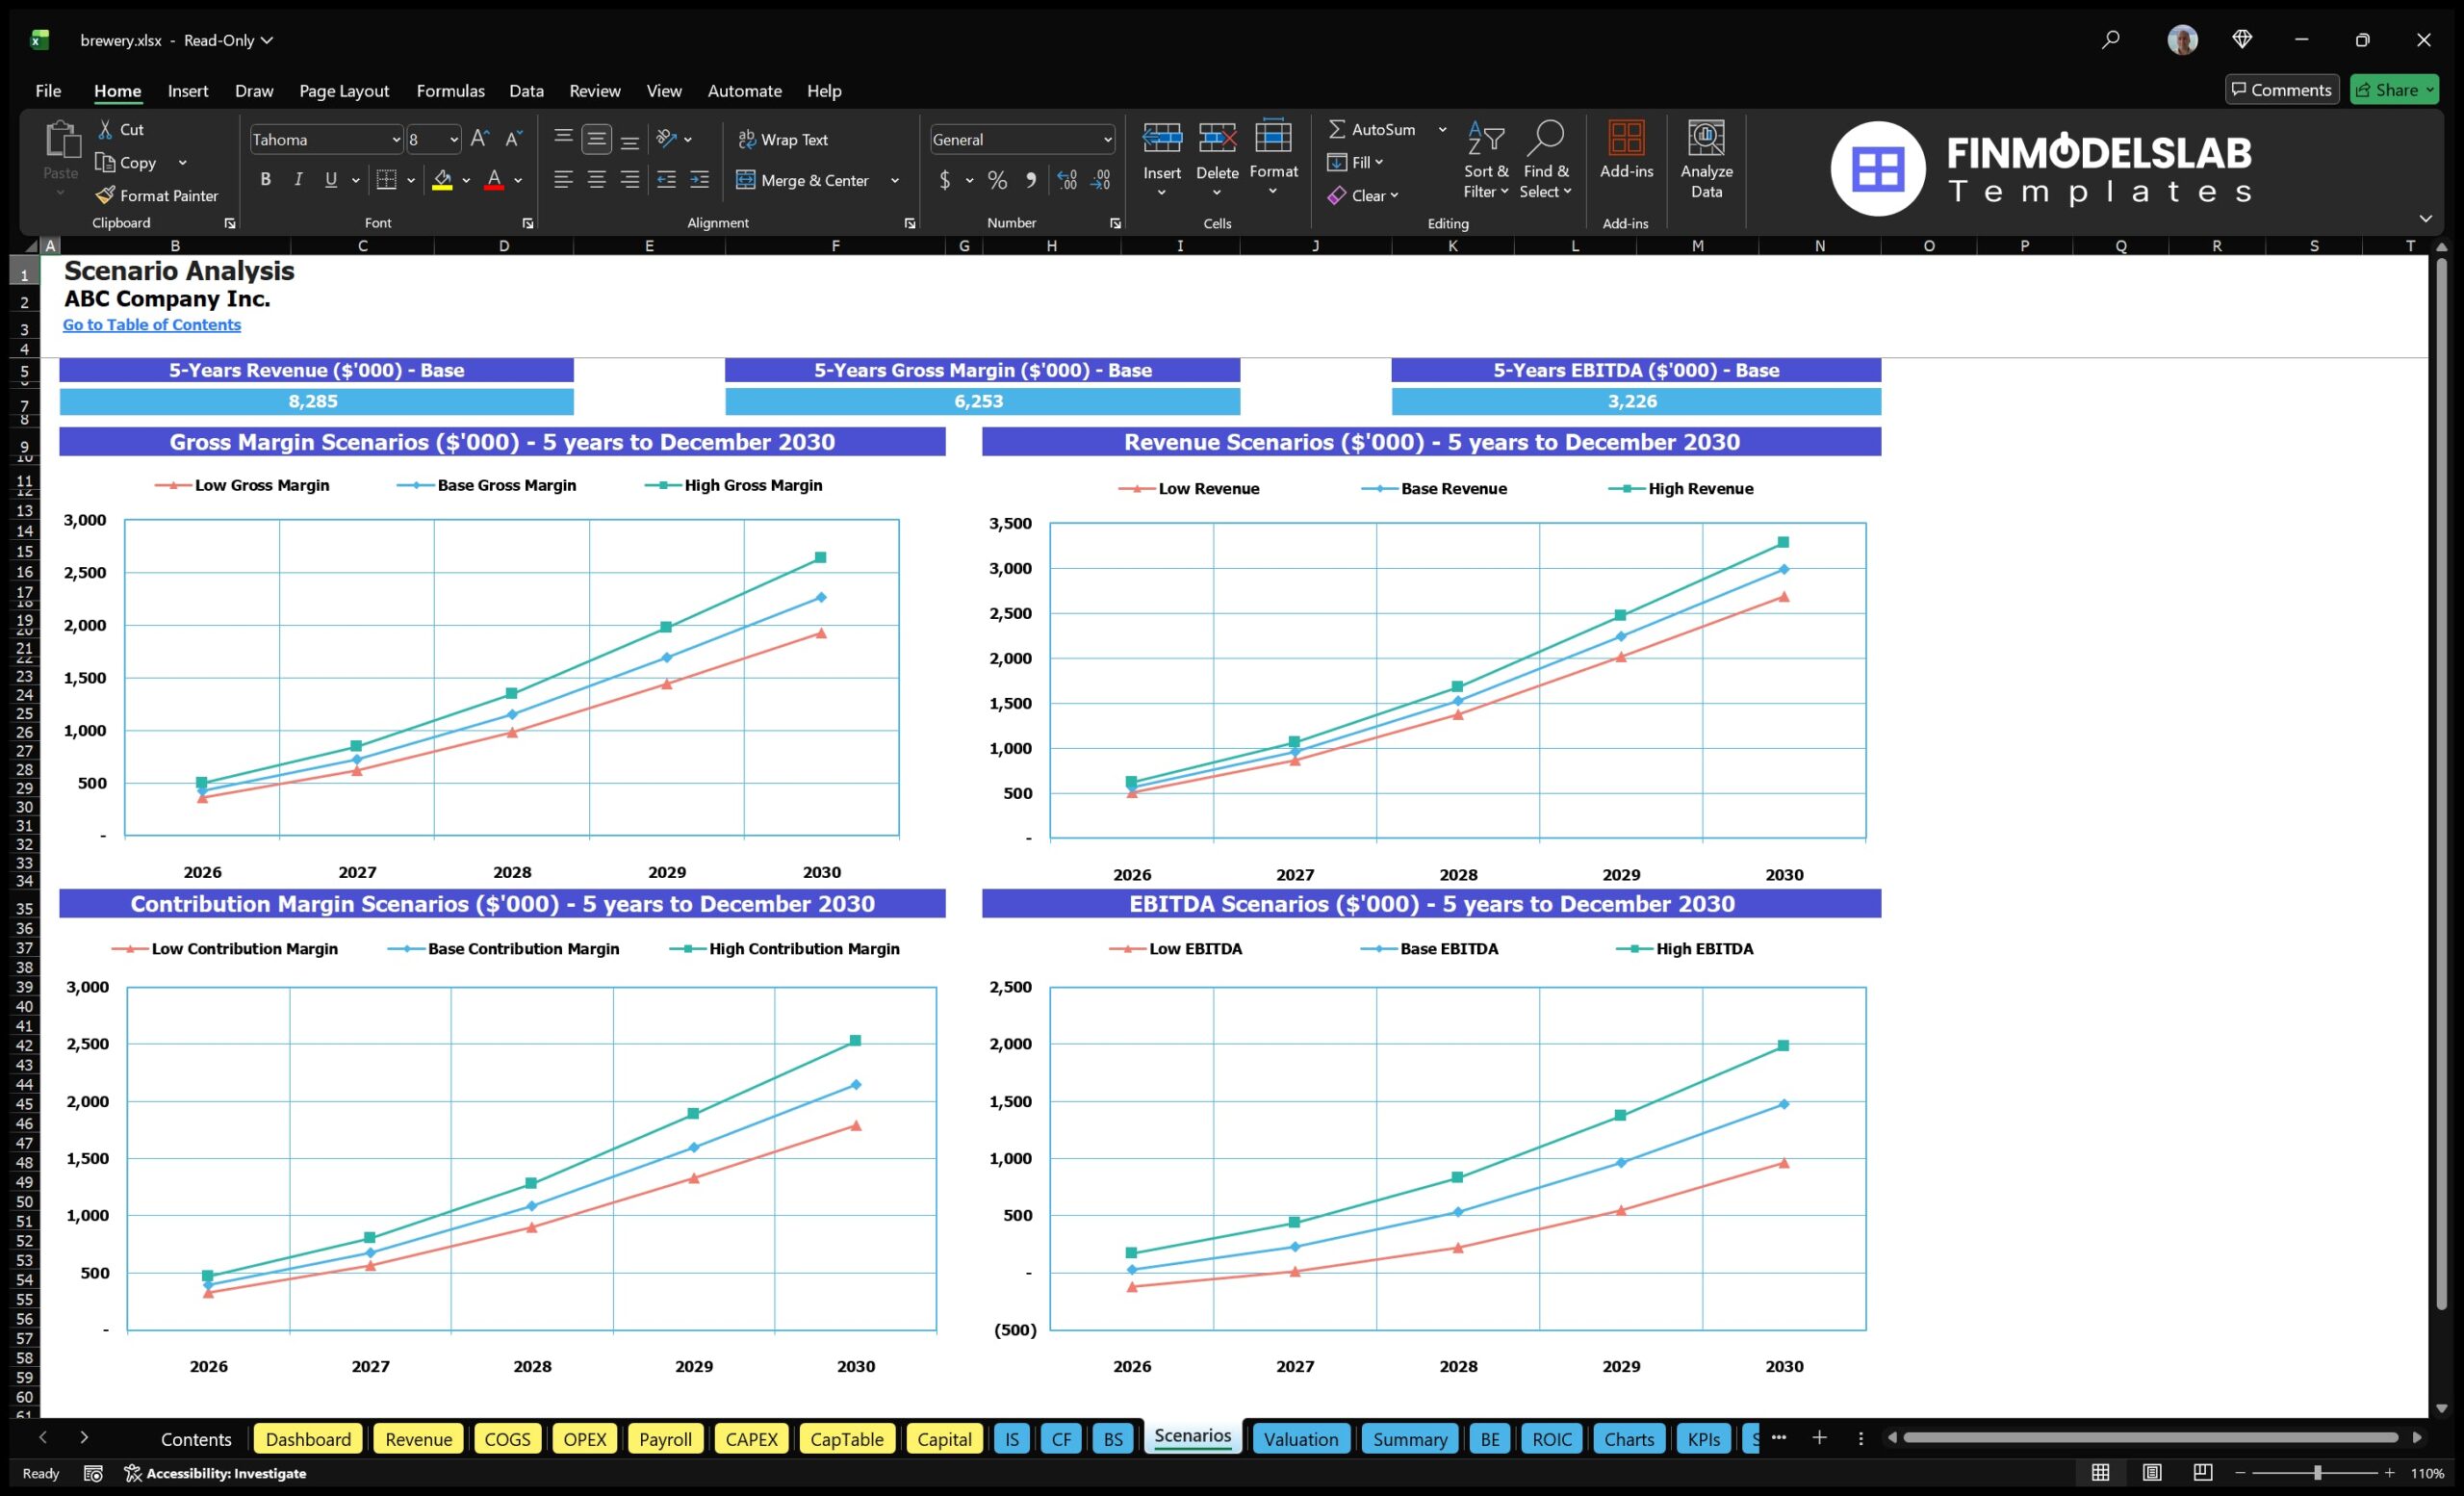
The low, base, and high scenario analysis section allows users to test how the brewery may perform under different market and operating conditions. Breweries face uncertainty around customer demand, taproom traffic, wholesale adoption, production capacity utilization, ingredient costs, labor costs, pricing power, and timing of growth. This component helps users model conservative, expected, and optimistic outcomes by adjusting key drivers such as sales volume, average selling price, product mix, cost of goods sold, staffing levels, operating expenses, and capital investment timing. The outputs show how each scenario affects revenue, profit margins, cash flow, break-even timing, and overall financial performance. This is valuable because it helps users avoid planning around a single fixed forecast and instead understand the range of possible outcomes. A lender or investor may want to see whether the brewery can survive a slower ramp-up, while a founder may want to know what happens if production scales faster than expected. Scenario analysis supports better risk management, contingency planning, and strategic decision-making by showing the financial impact of both upside potential and downside risk.
Professional Charts and Visual Reports
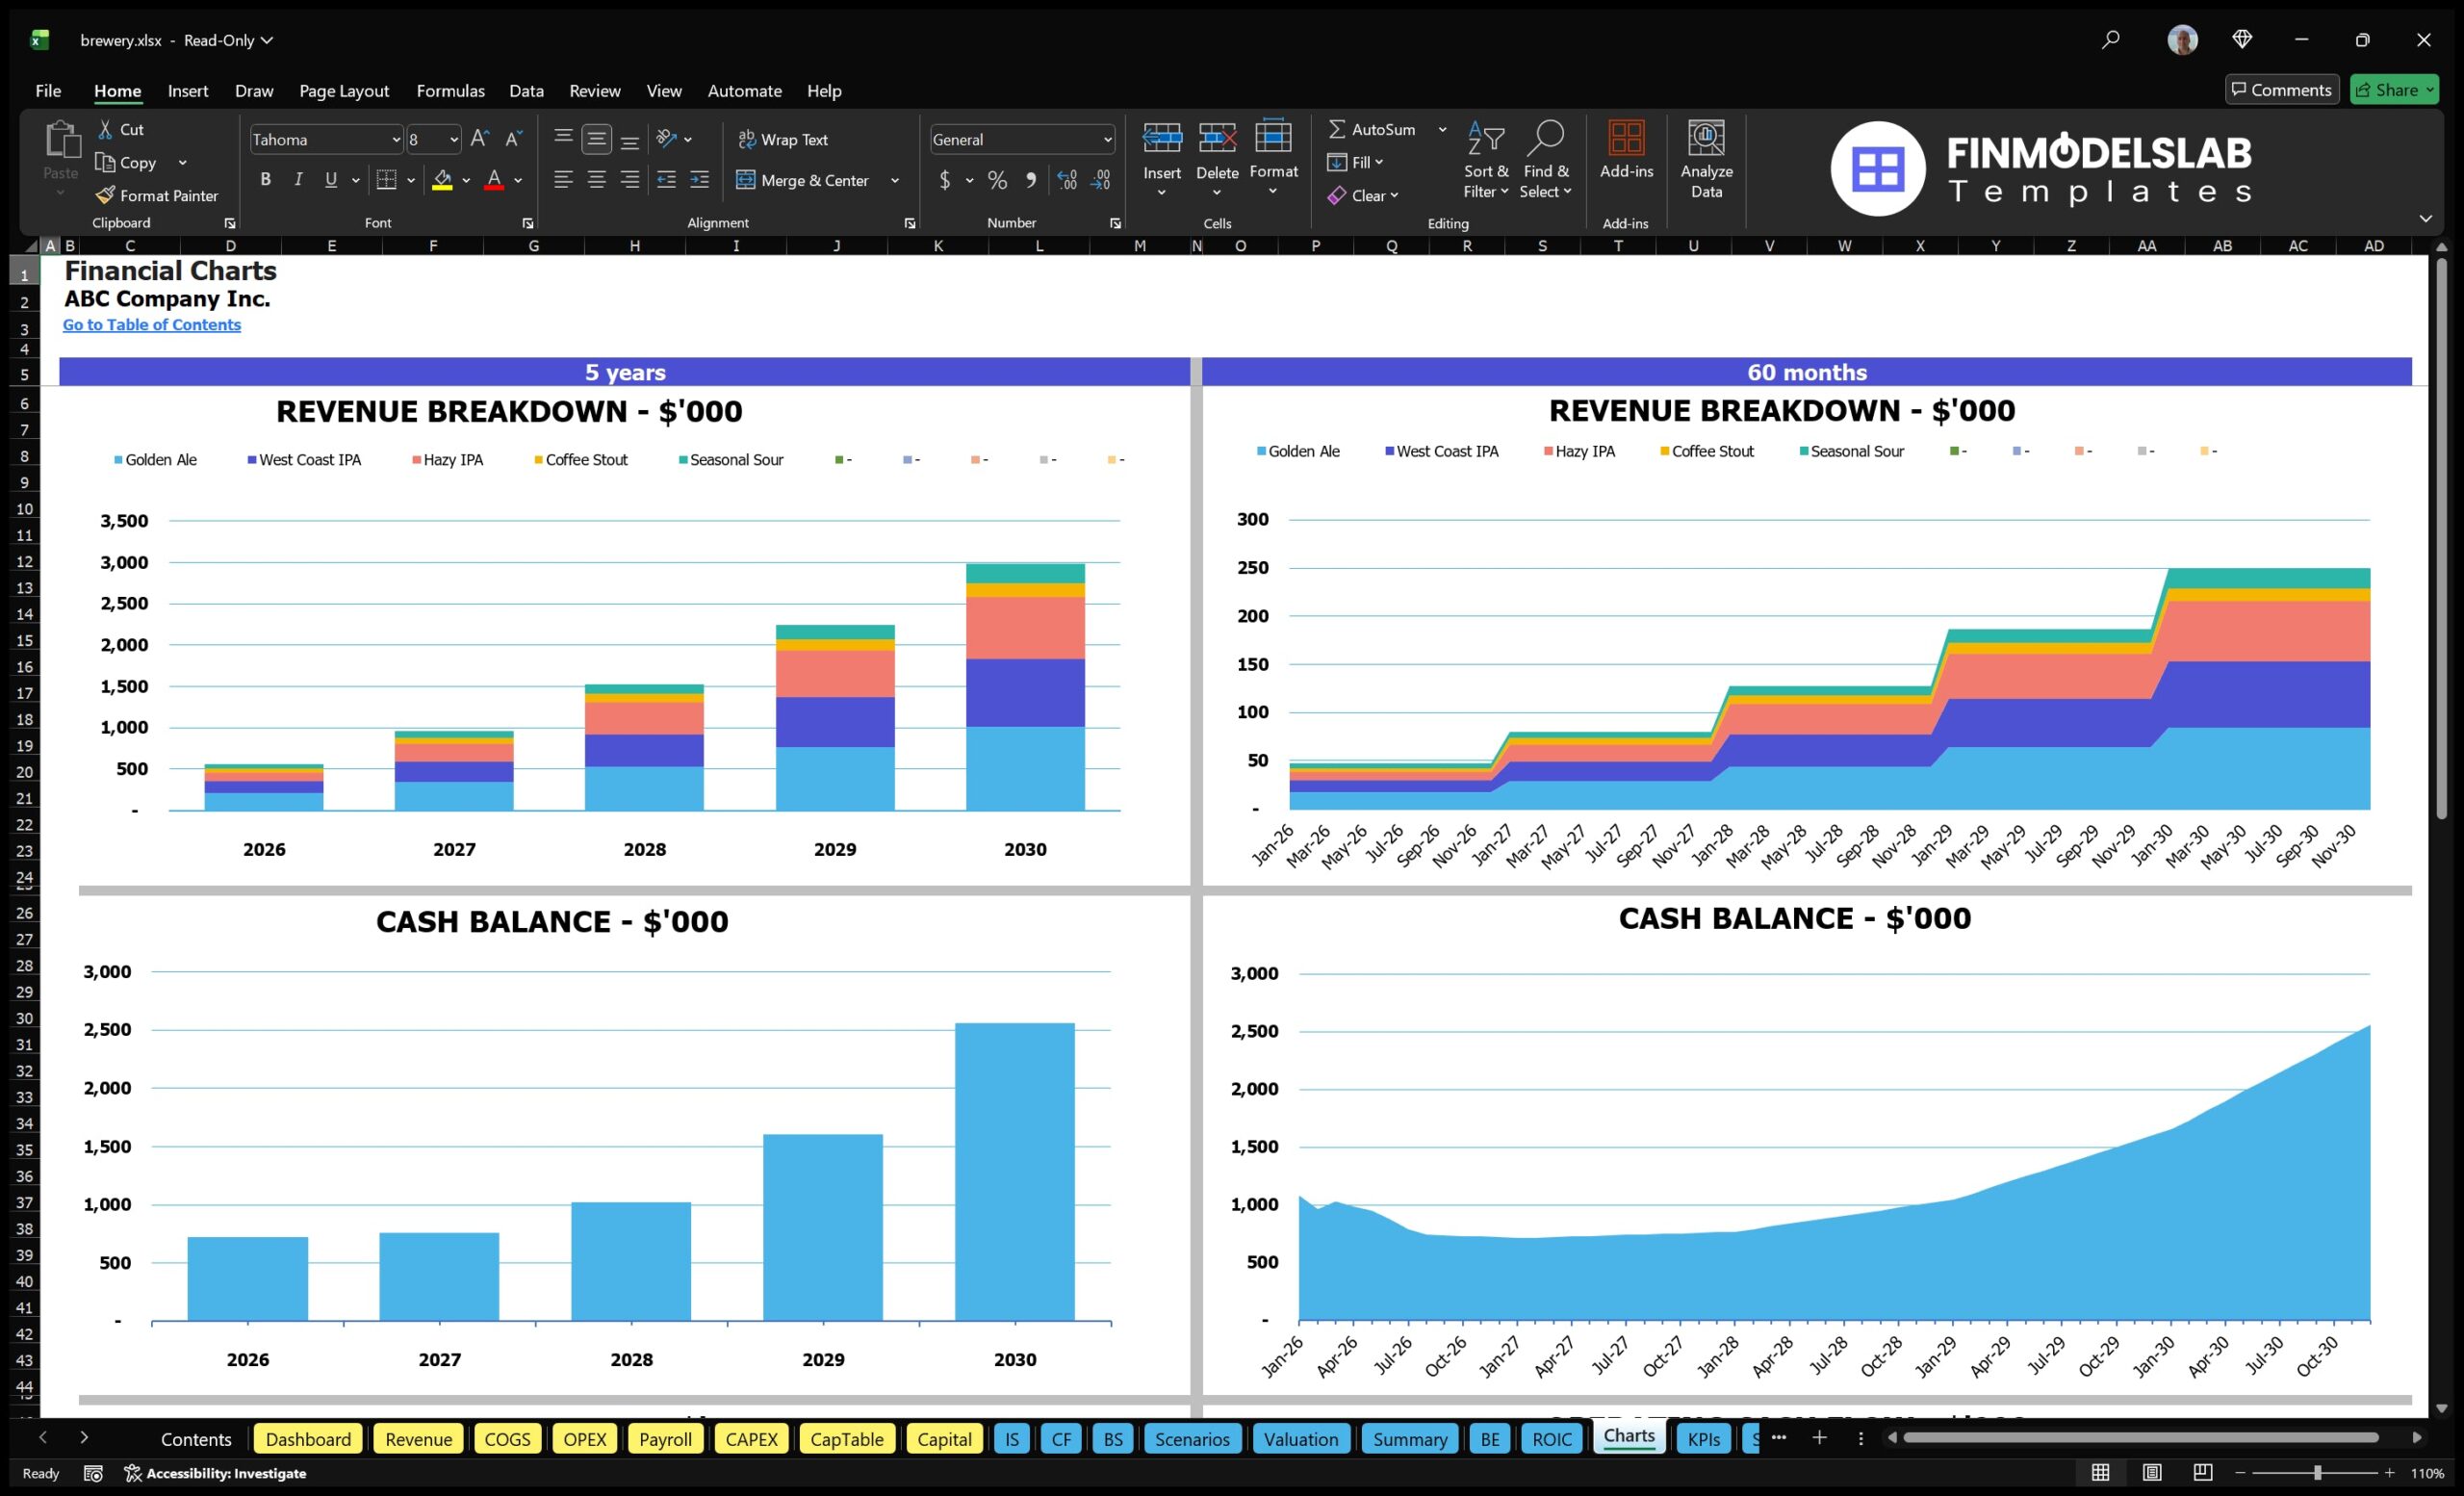
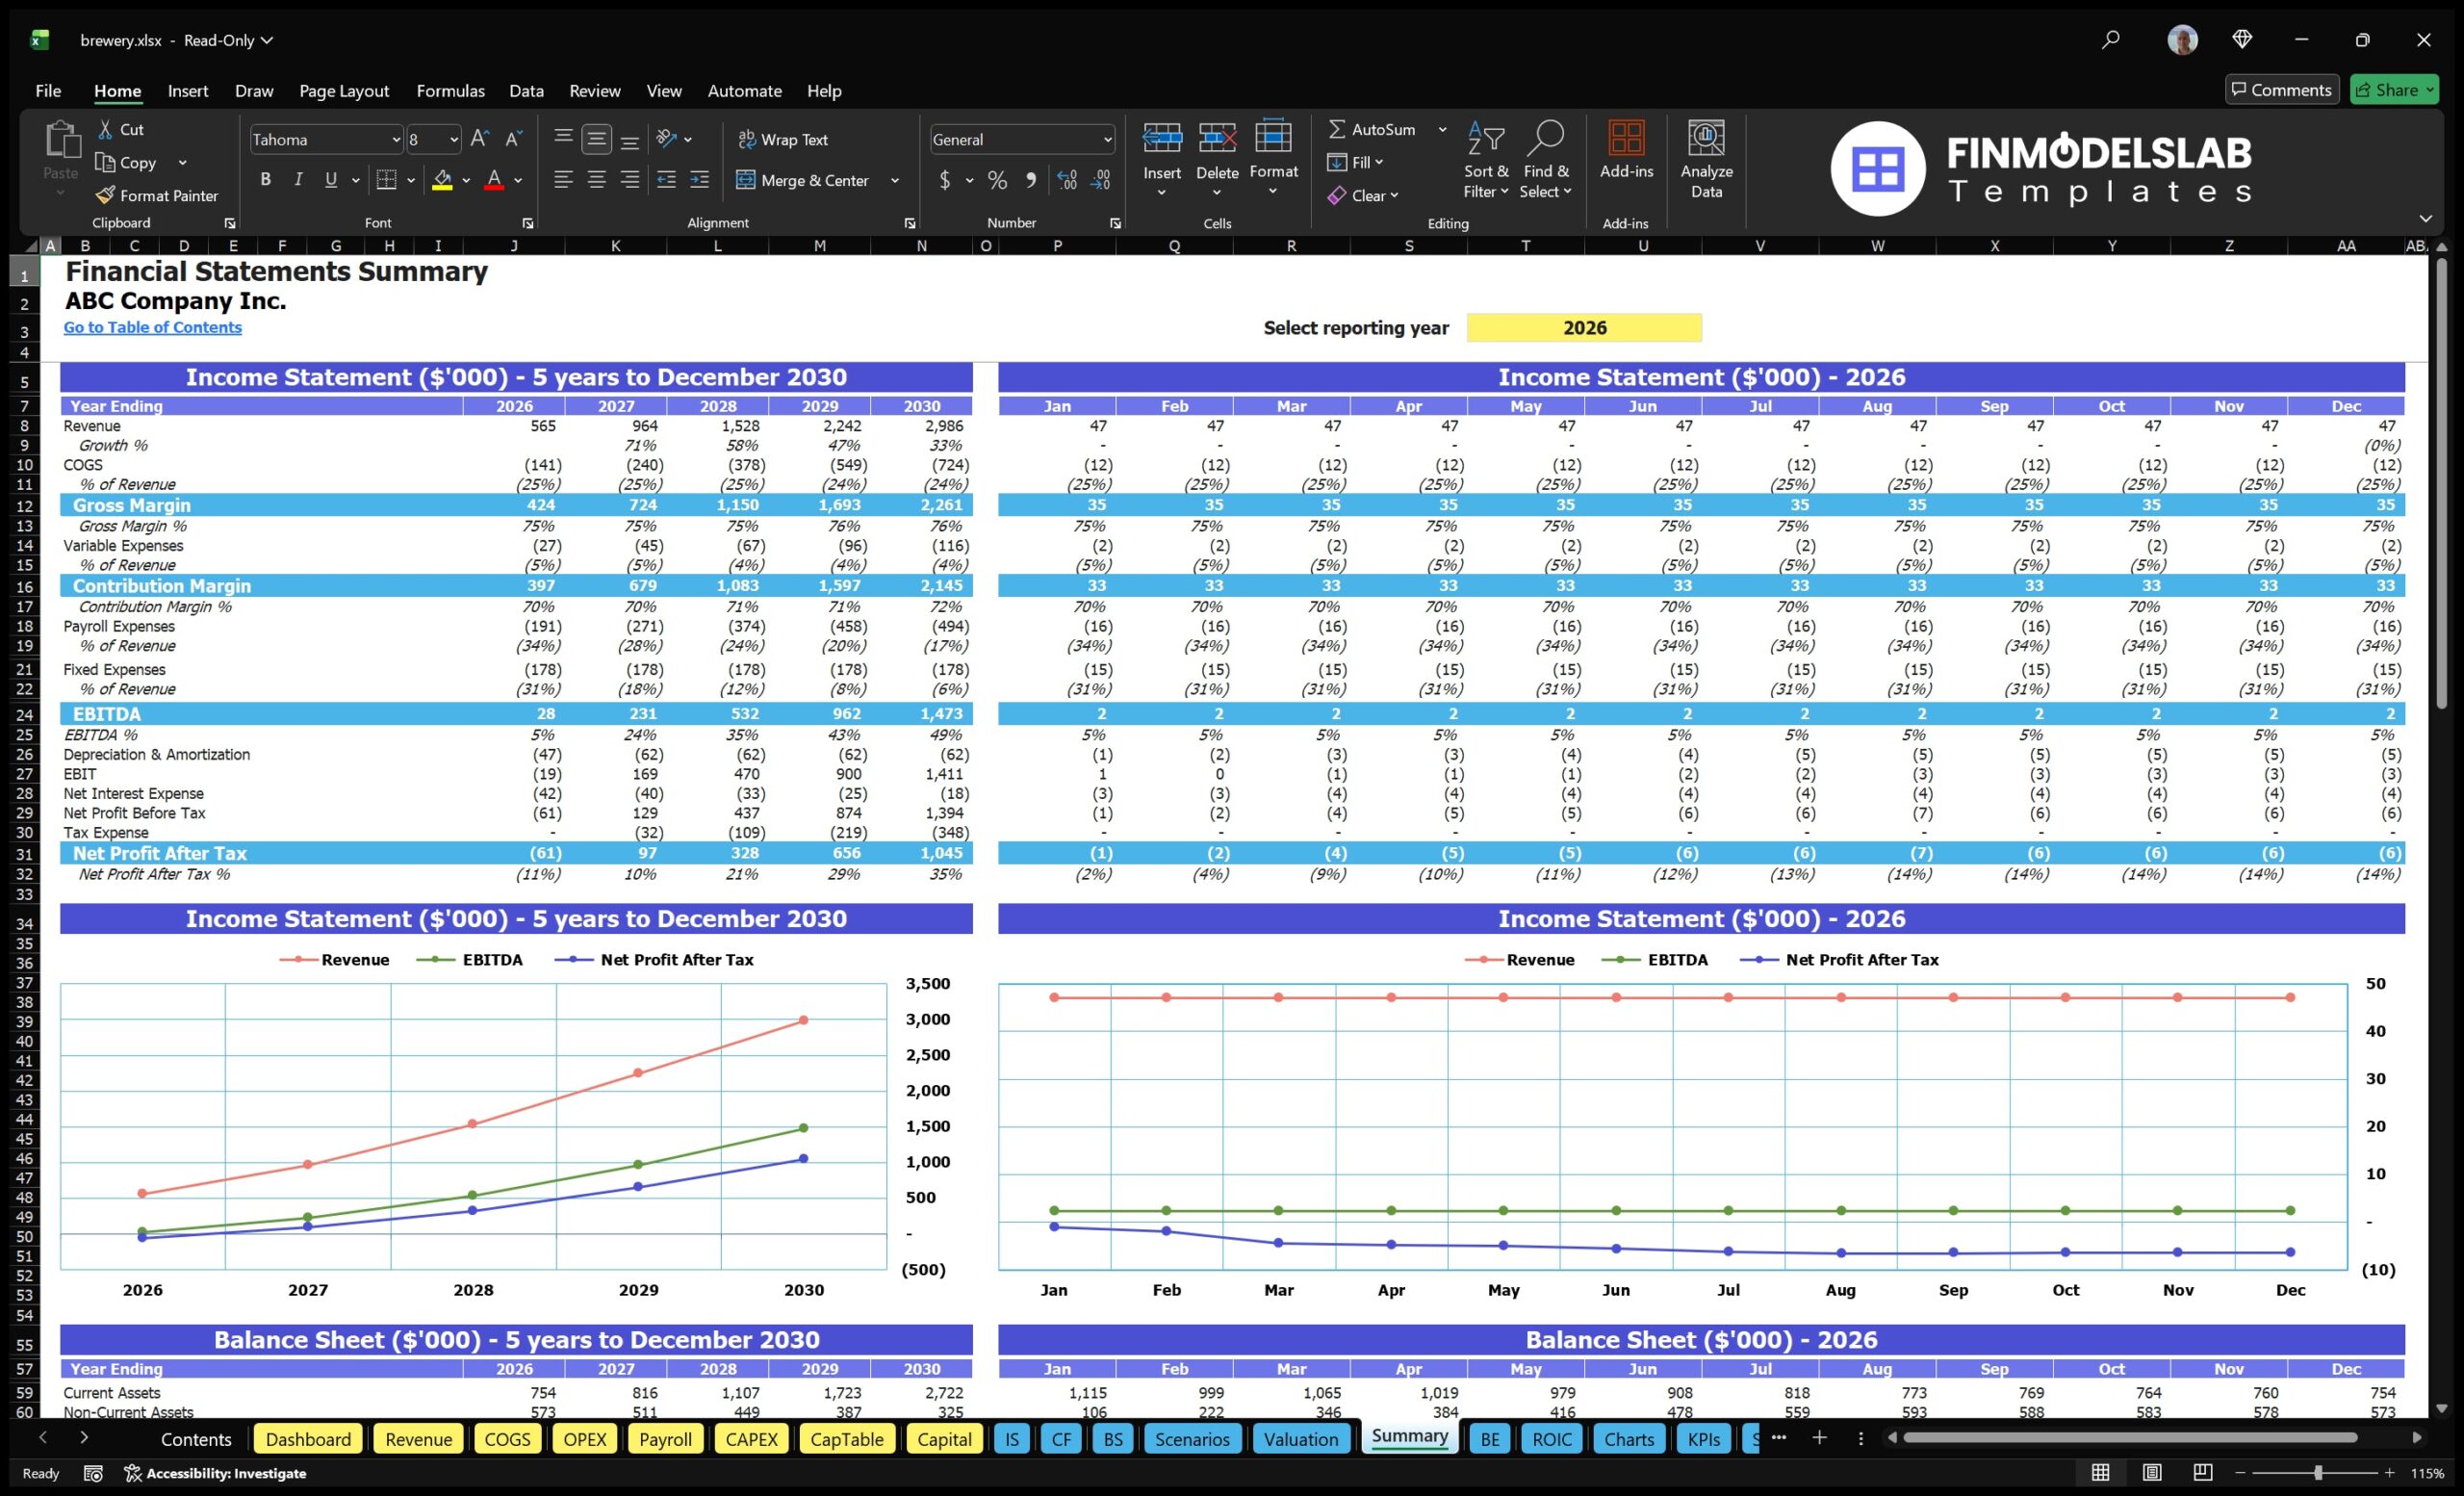
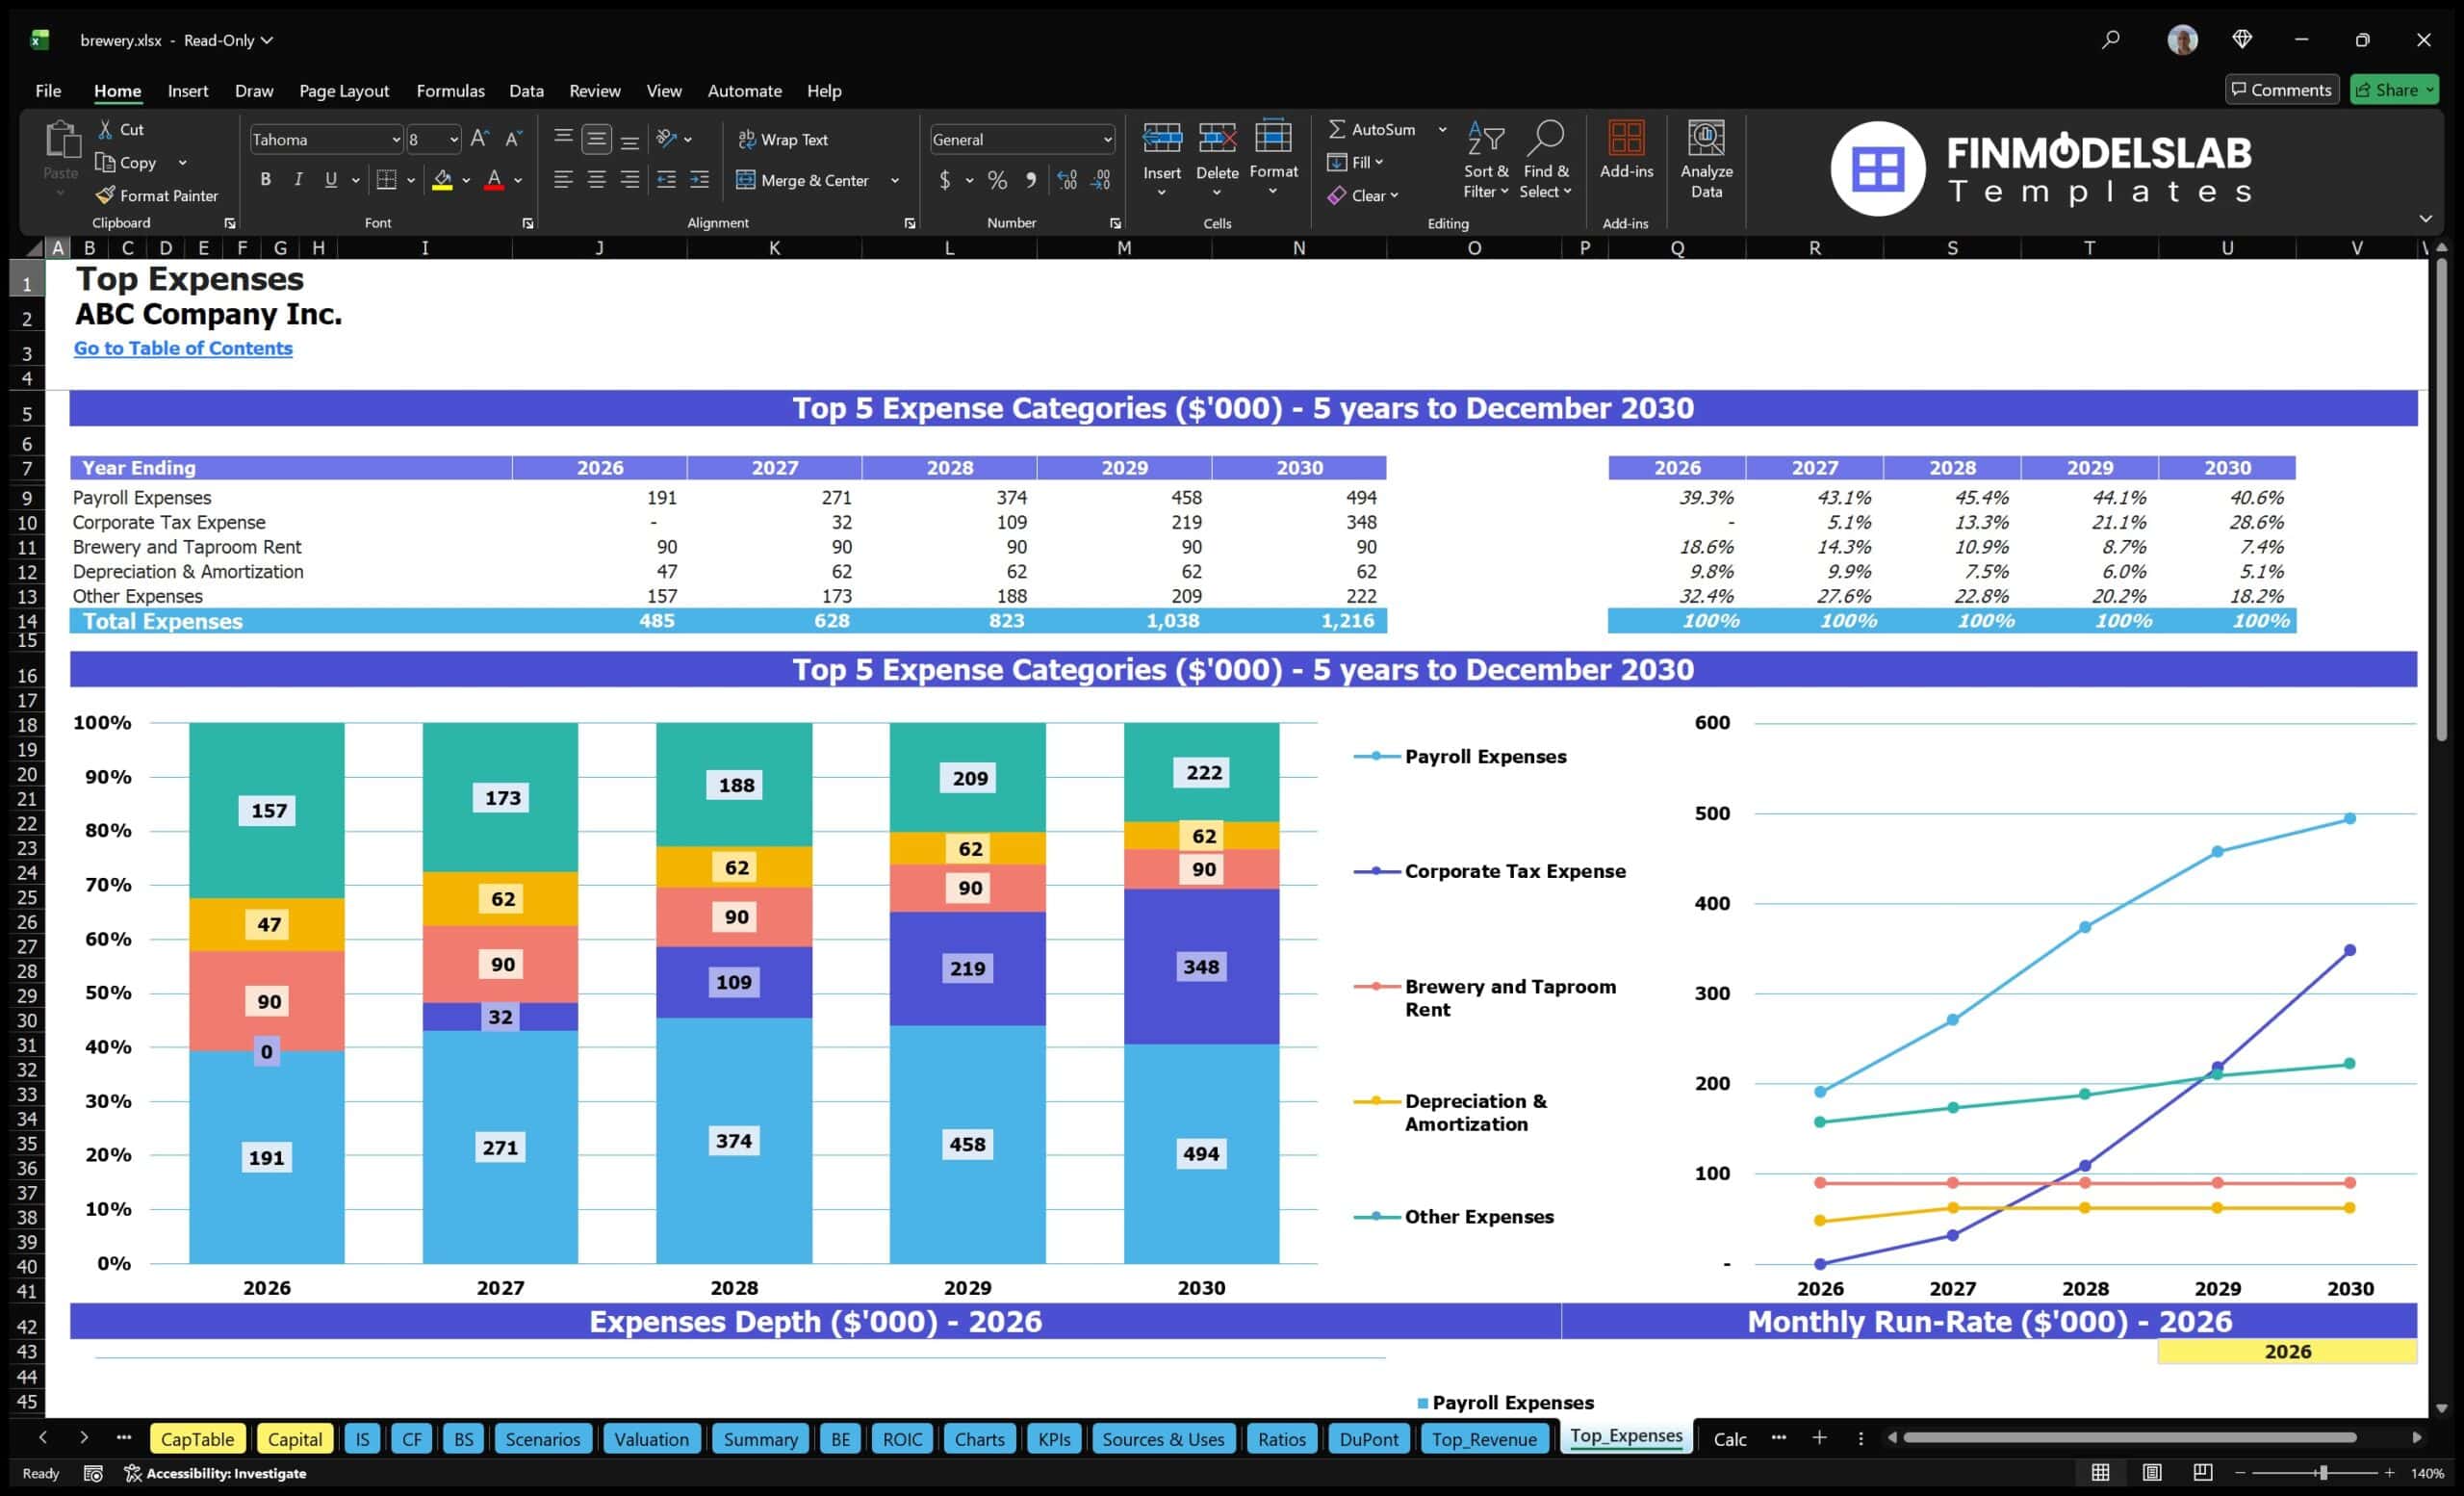
The professional charts and visual reports component turns the Brewery Financial Model into a clearer communication tool for business plans, pitch decks, loan applications, and internal management reviews. Financial forecasts can be difficult to interpret when they are presented only as rows of numbers, so this section uses visual outputs to show trends in revenue, expenses, profit, cash flow, margins, and key operating metrics. Charts may highlight revenue growth over the five-year projection period, changes in expense categories, profitability improvement, cash balance movement, or performance across different scenarios. These visuals help users tell the financial story of the brewery in a way that is easier for stakeholders to understand. For example, a founder can use charts to show how fixed costs become more efficient as production volume increases, or how cash flow improves once startup costs and initial ramp-up expenses are absorbed. This section is useful for presentations because it makes the forecast more accessible, polished, and decision-ready, helping users explain not only what the numbers are, but why they matter.
ROE Components and DuPont Analysis
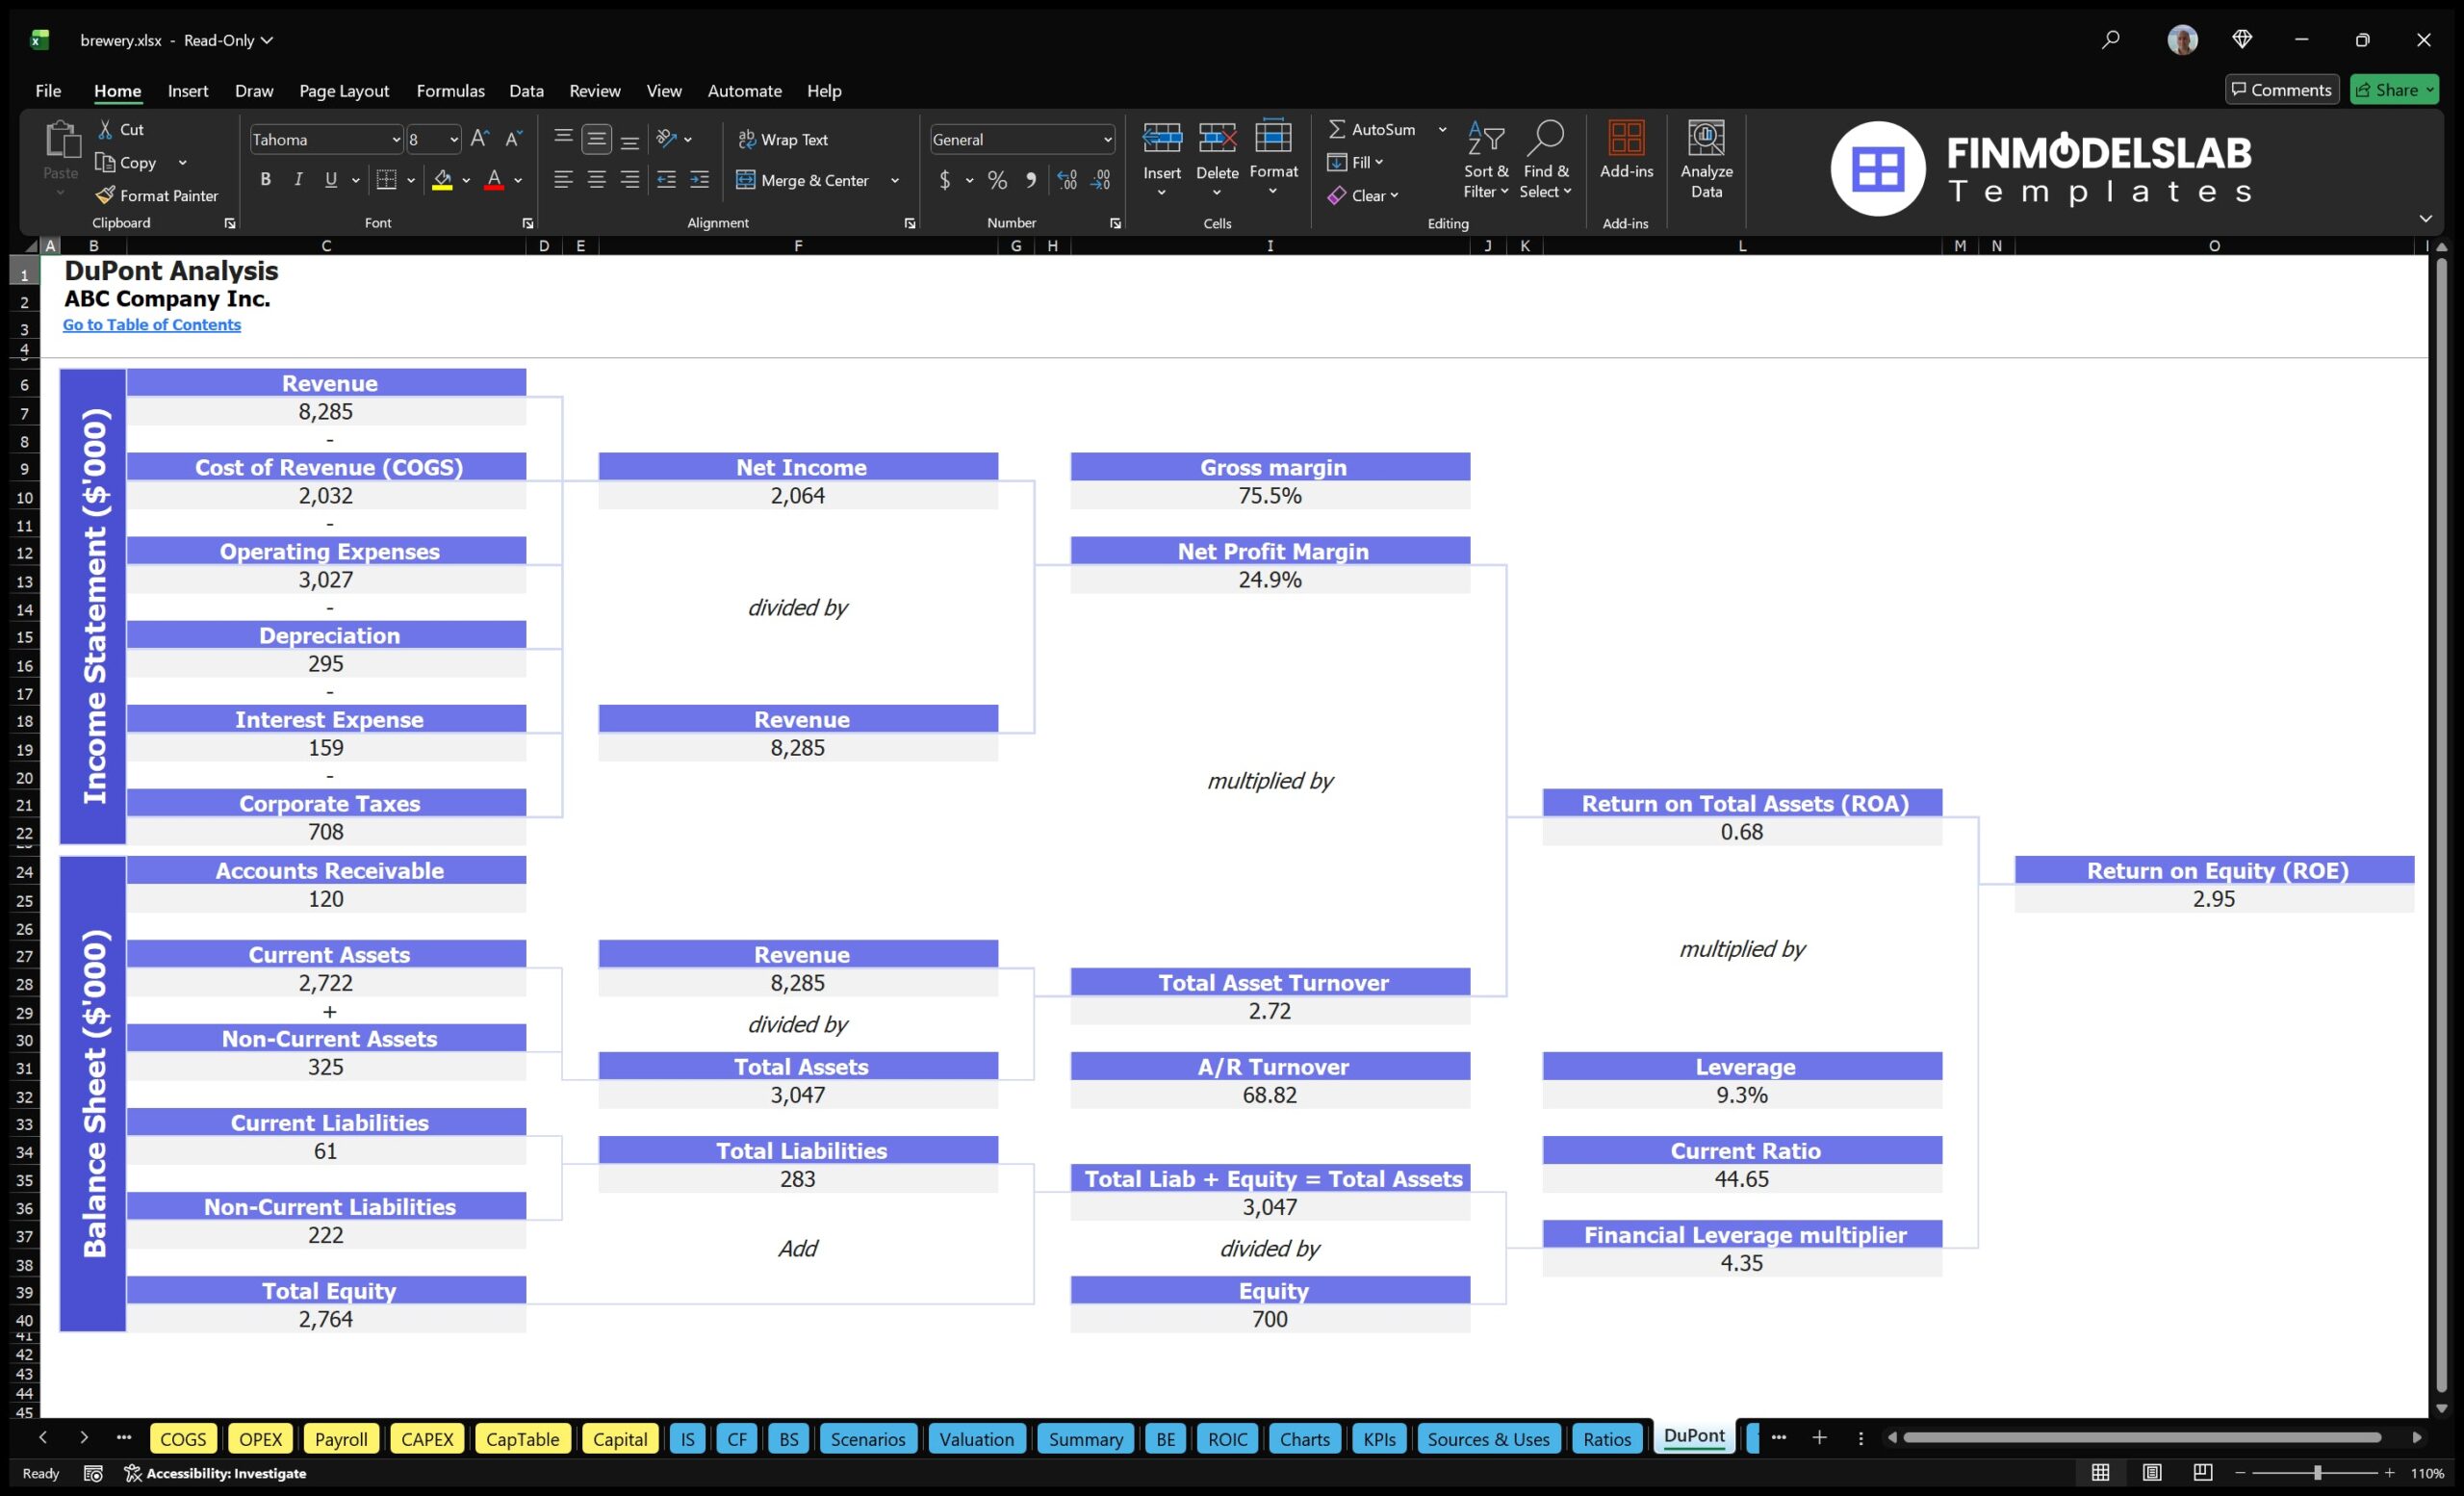
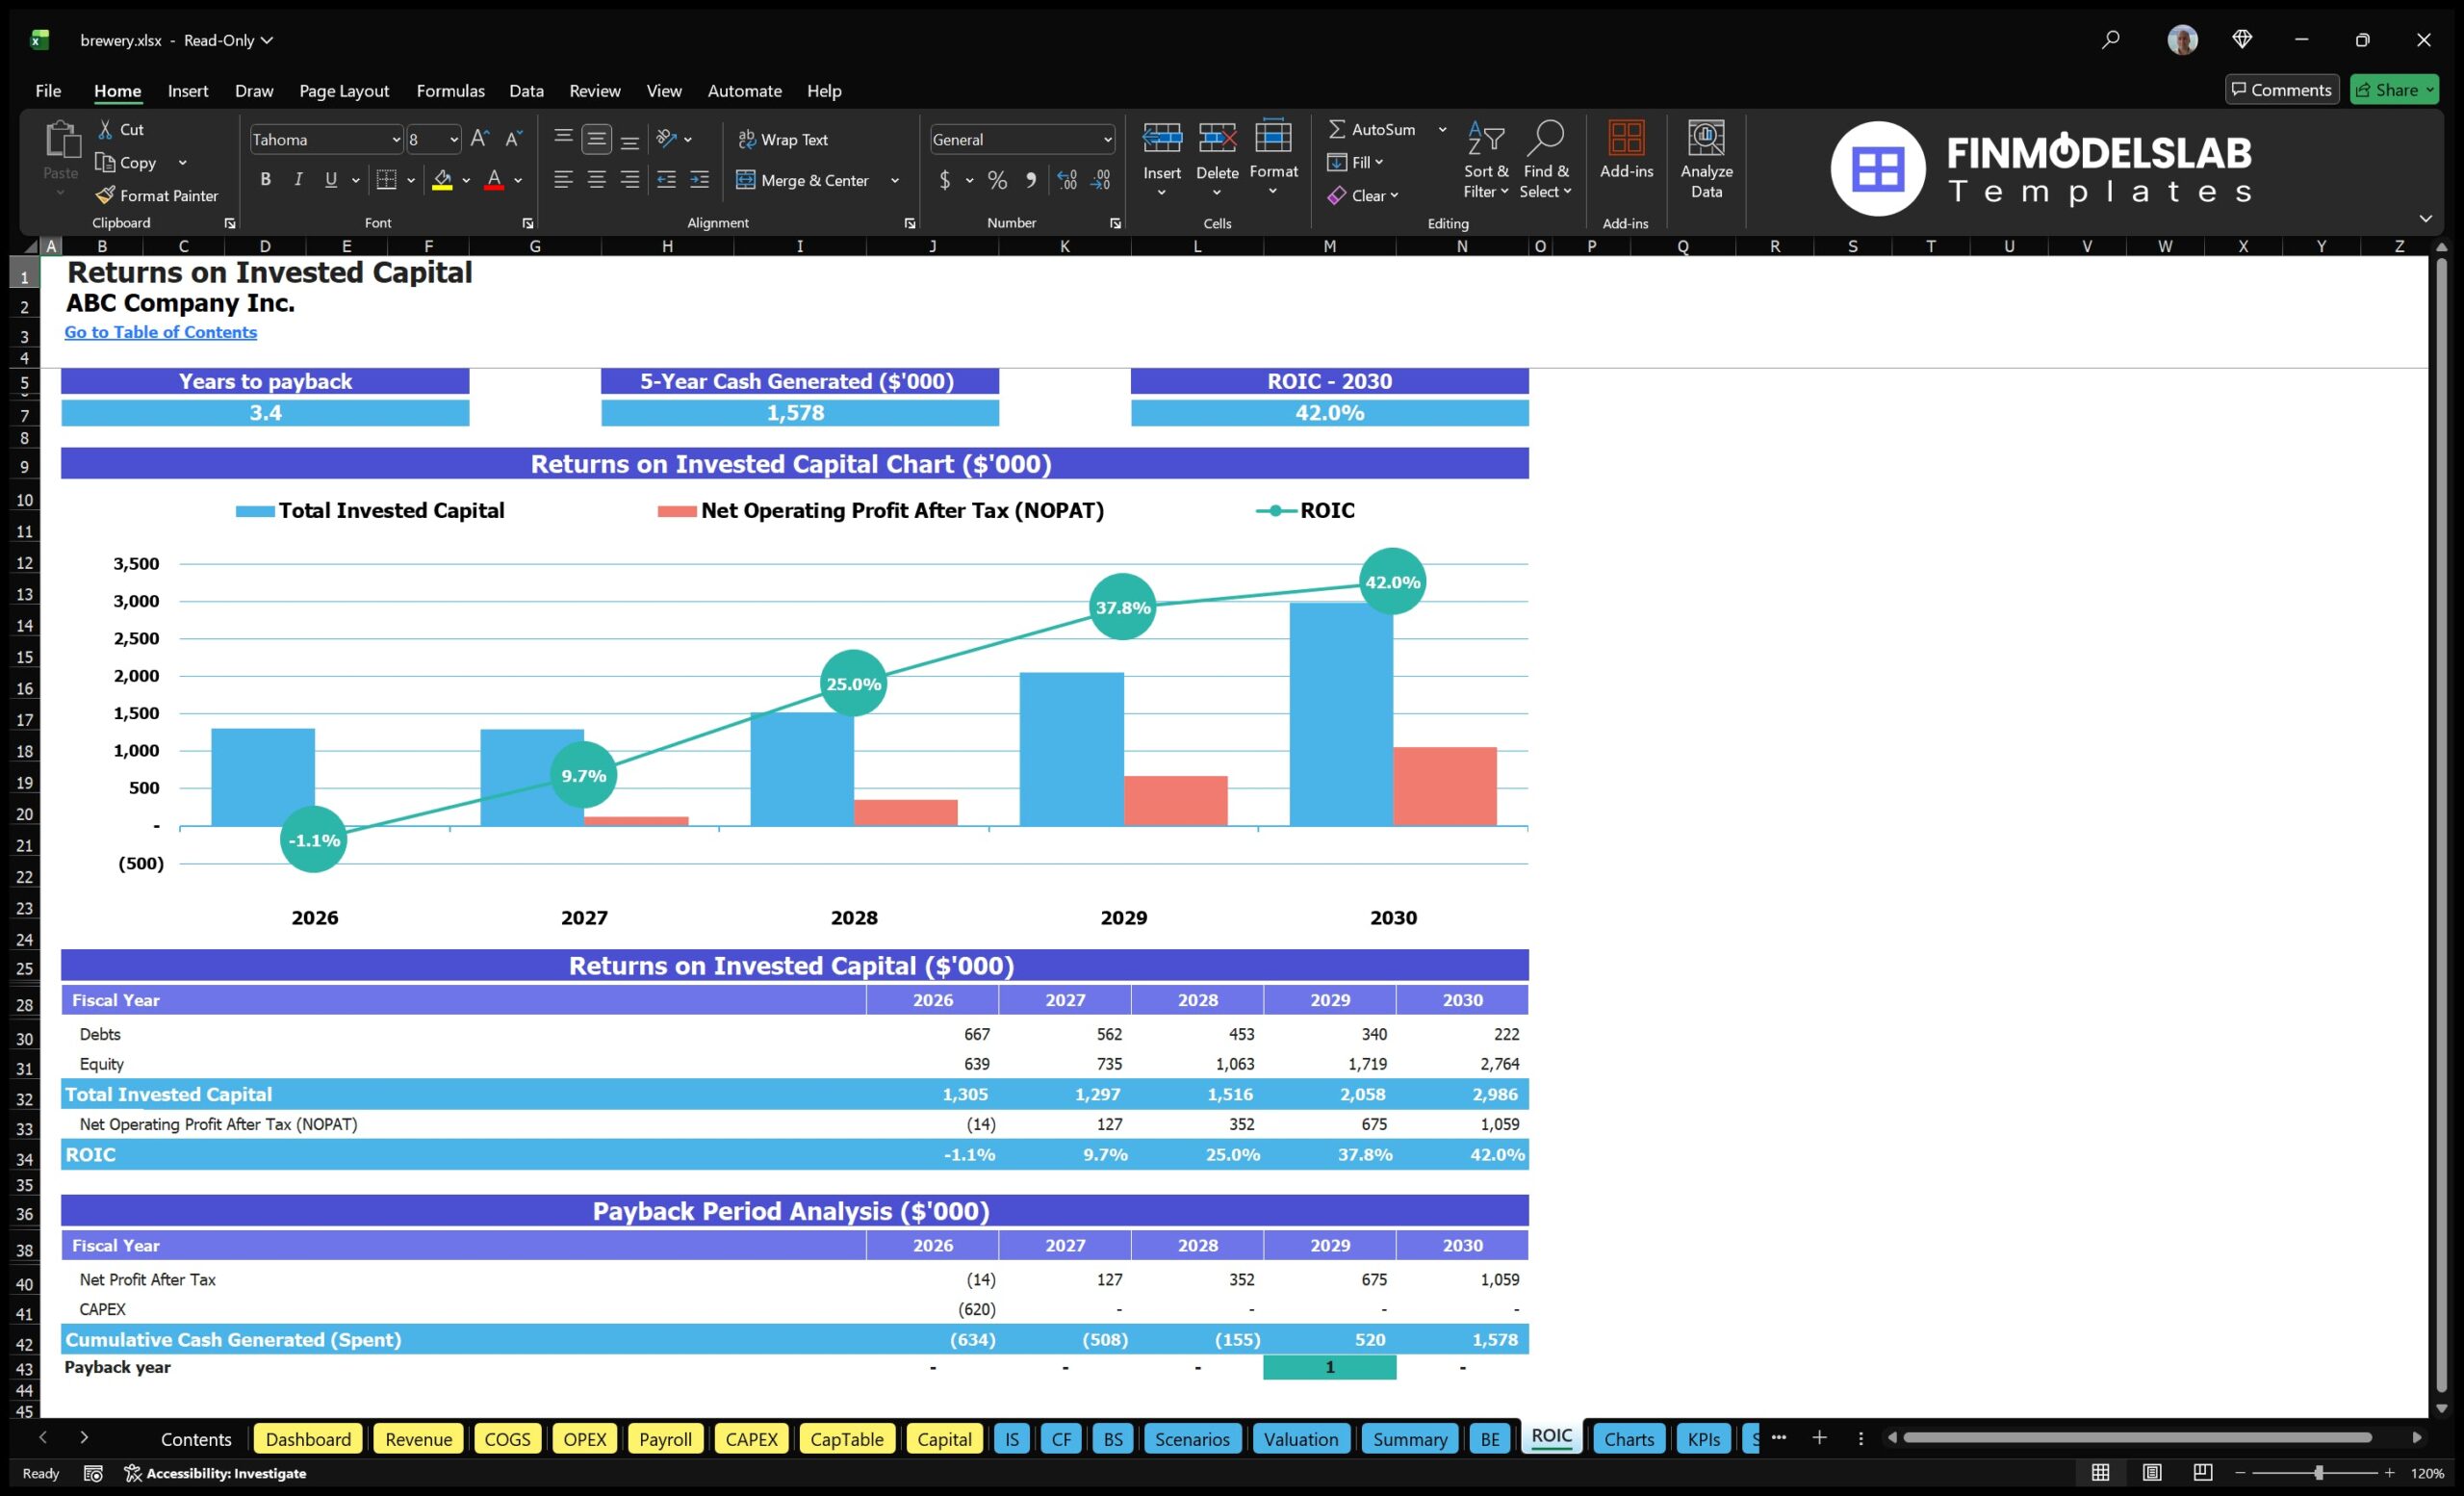
The ROE components and DuPont analysis section helps users understand the drivers behind return on equity rather than looking at a single return figure in isolation. Return on equity is especially important for investors and owners because it shows how effectively the brewery uses owner capital to generate profit. DuPont analysis breaks that return into underlying components, often including profitability, asset efficiency, and financial leverage. In a brewery context, this can help users evaluate whether returns are being influenced by operating margin, equipment and asset utilization, debt structure, or capital intensity. Inputs may include net income, revenue, total assets, equity, debt, and related balance sheet assumptions. Outputs help users identify whether the brewery’s return profile is limited by low margins, underused production assets, heavy startup investment, or financing choices. This is valuable for planning because breweries often require significant spending on brewhouse systems, fermentation tanks, canning lines, taproom build-outs, and working capital before reaching steady profitability. By showing the components of return, this section supports more thoughtful decisions about pricing, production scale, cost management, reinvestment, and funding structure.
Revenue Inputs and Assumptions
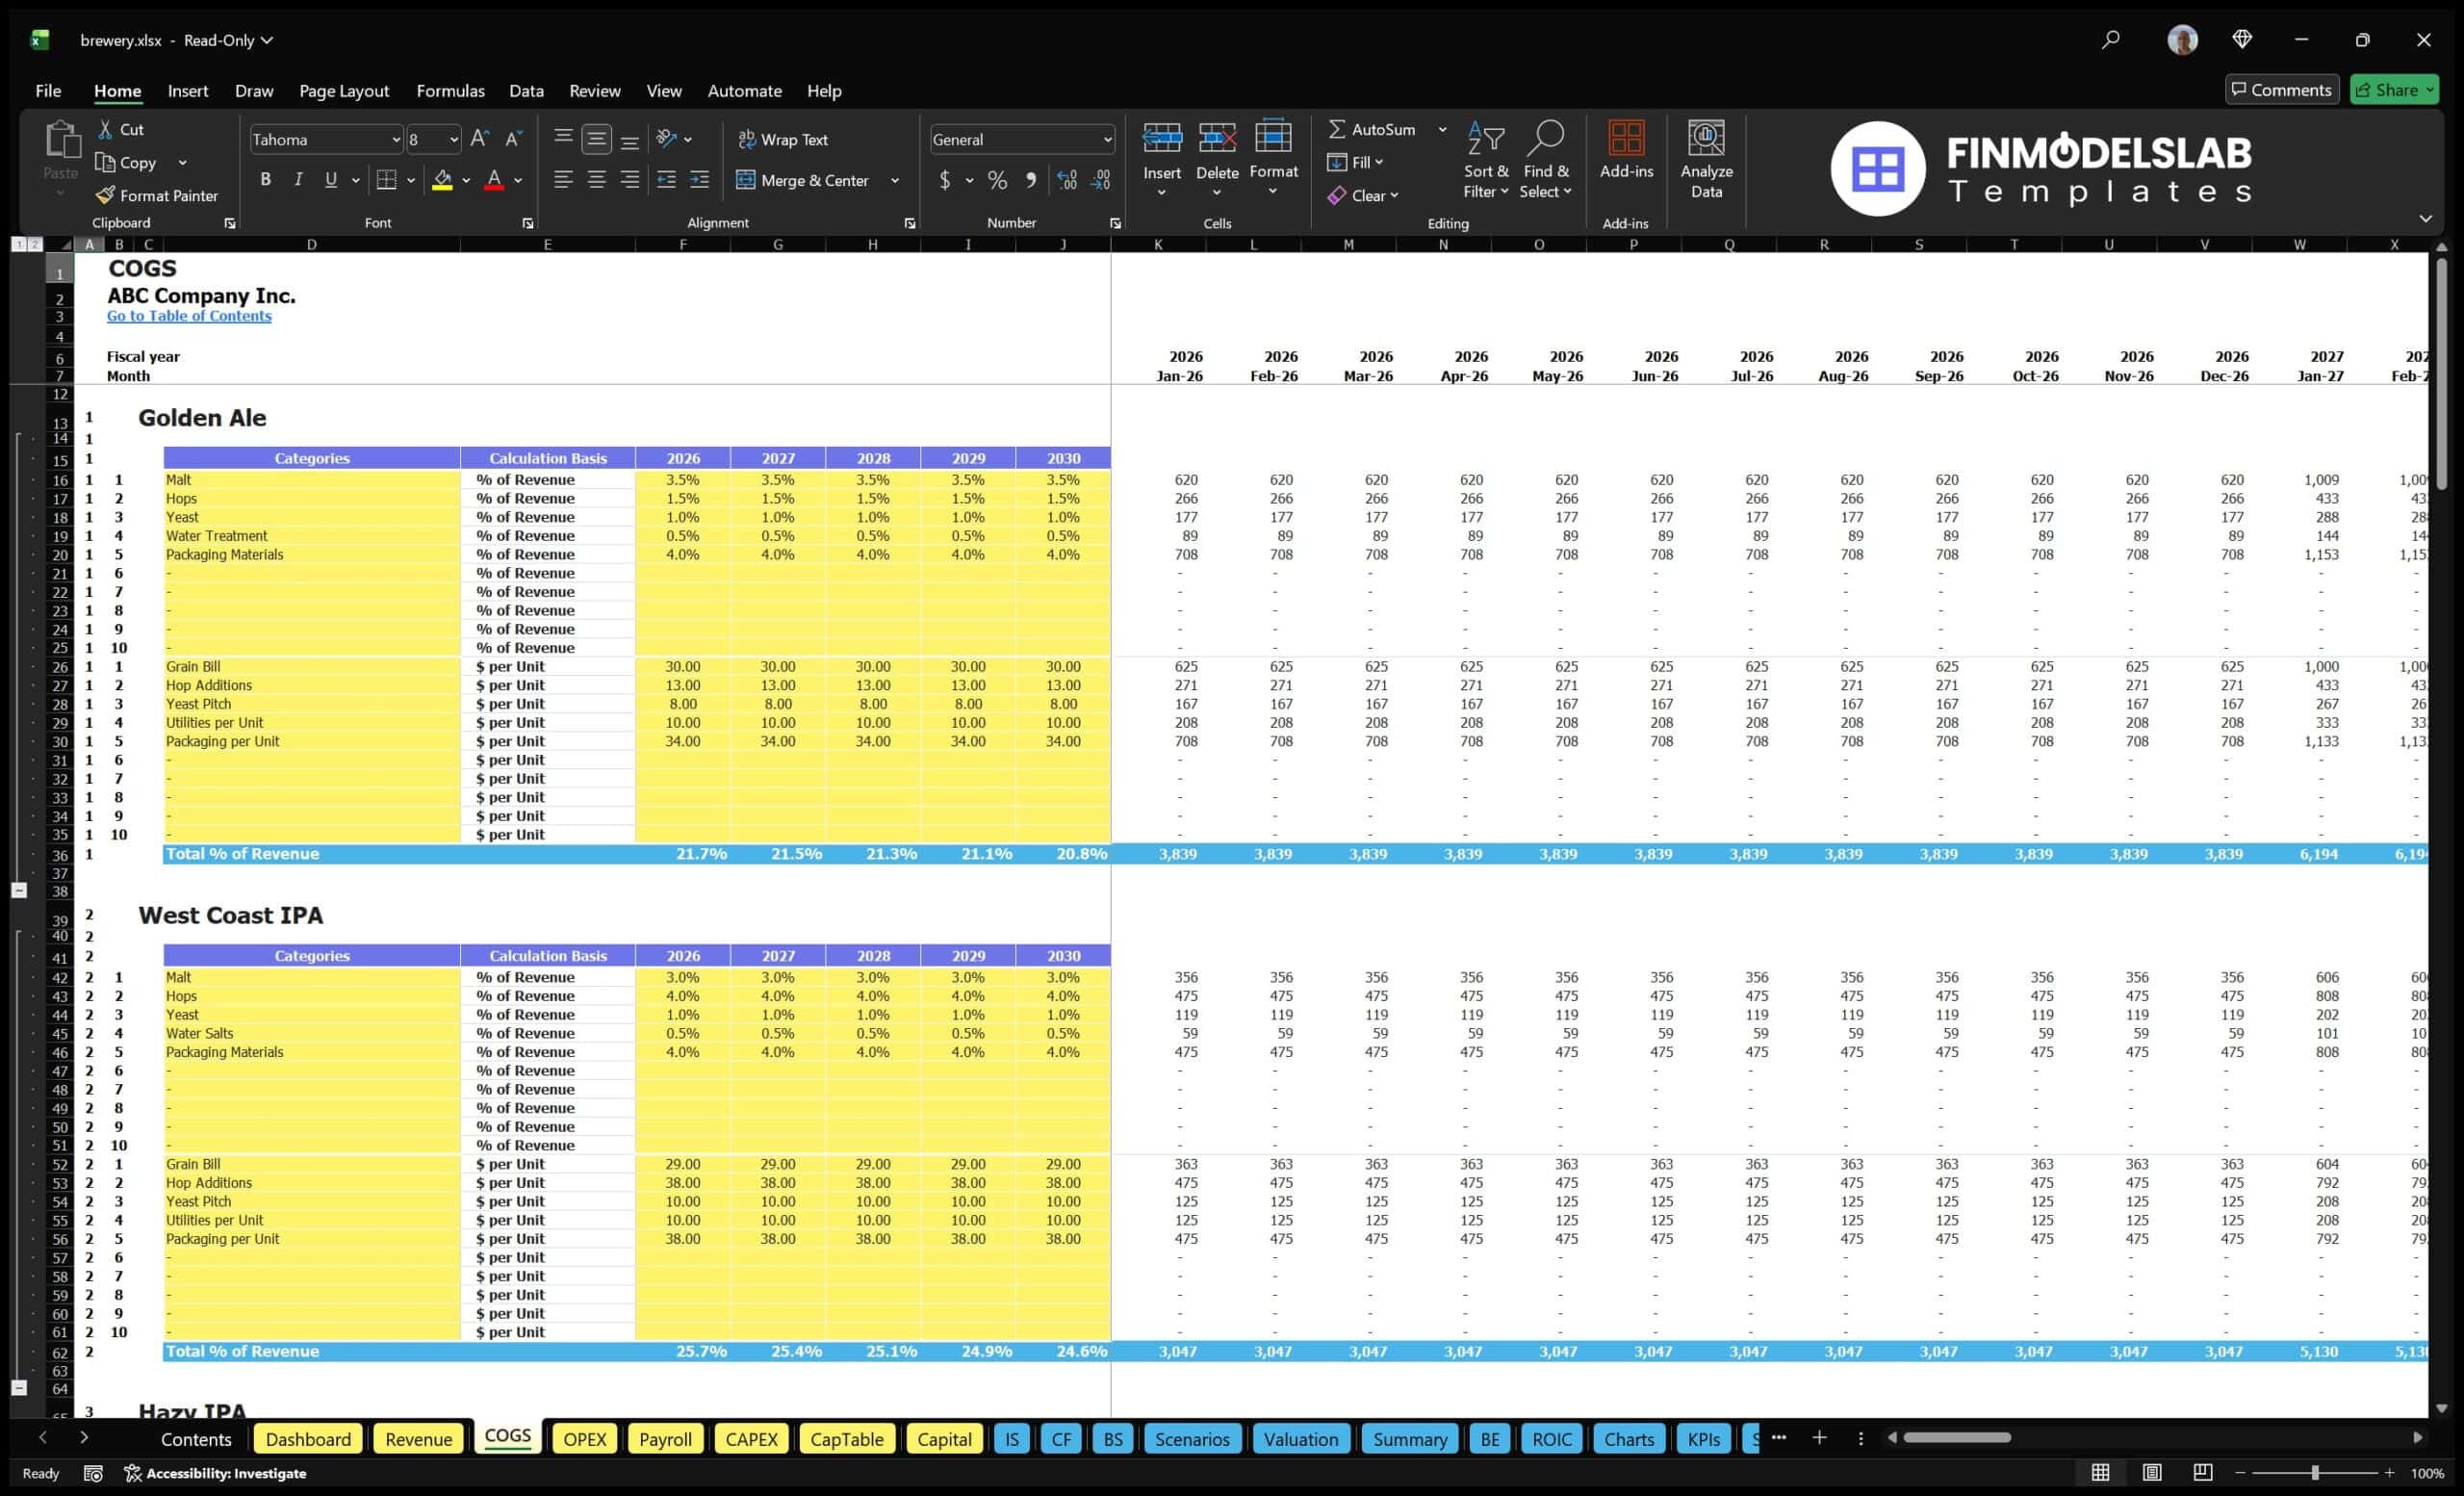
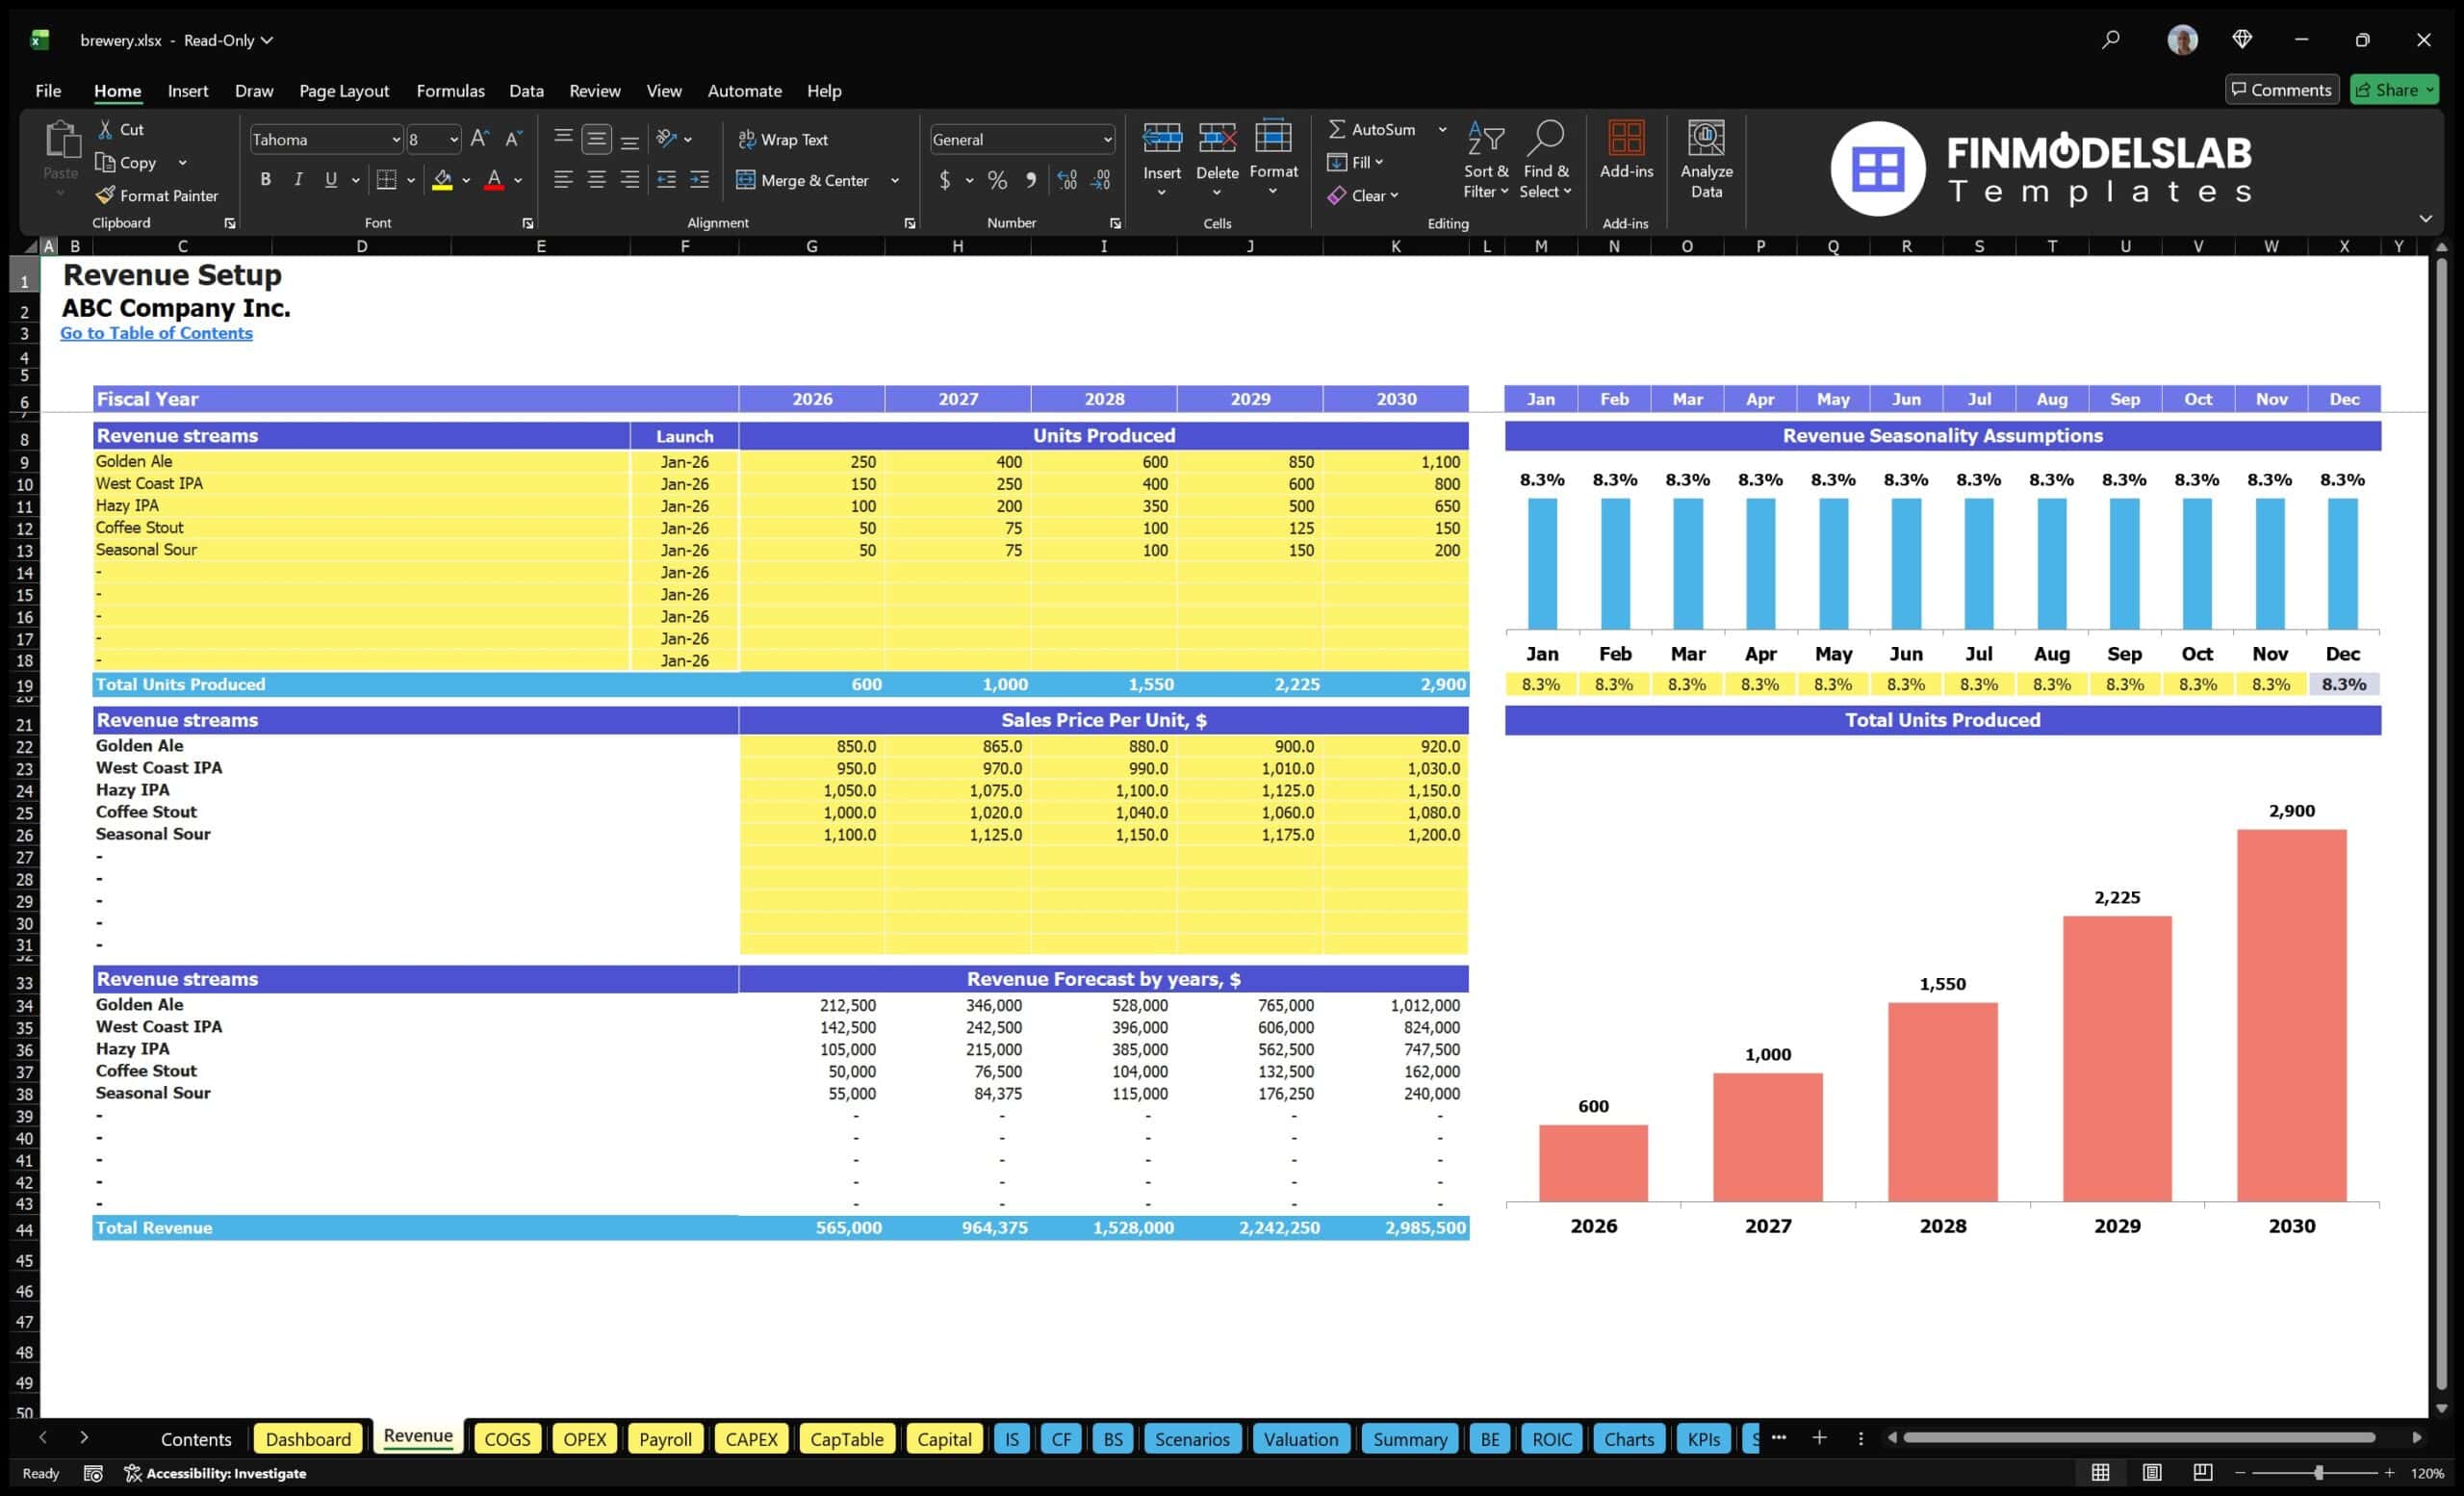
The revenue inputs and assumptions section is one of the most important parts of the Brewery Financial Model because it defines how the business generates sales. Users can enter or adjust assumptions related to beer production volume, sales volume, average price, product line mix, growth rates, and potentially channel-level revenue such as taproom sales, packaged beer, wholesale distribution, seasonal releases, or specialty products. The model is tailored to brewery planning by recognizing that each beer line or product category may have its own pricing, volume, and margin profile. Inputs can be customized for products such as ales, IPAs, stouts, sours, or seasonal offerings, allowing users to reflect their actual brewing strategy instead of relying on generic revenue assumptions. The outputs flow into the revenue forecast, profitability forecast, cash flow forecast, and financial statements. This section is useful because it forces users to connect commercial strategy with financial outcomes. If production grows, pricing changes, or the sales mix shifts toward higher-margin products, the model can show the impact on revenue and profit. For business planning and funding preparation, clear revenue assumptions help demonstrate that the forecast is based on operational logic rather than guesswork.
Bank-Ready Financial Reports
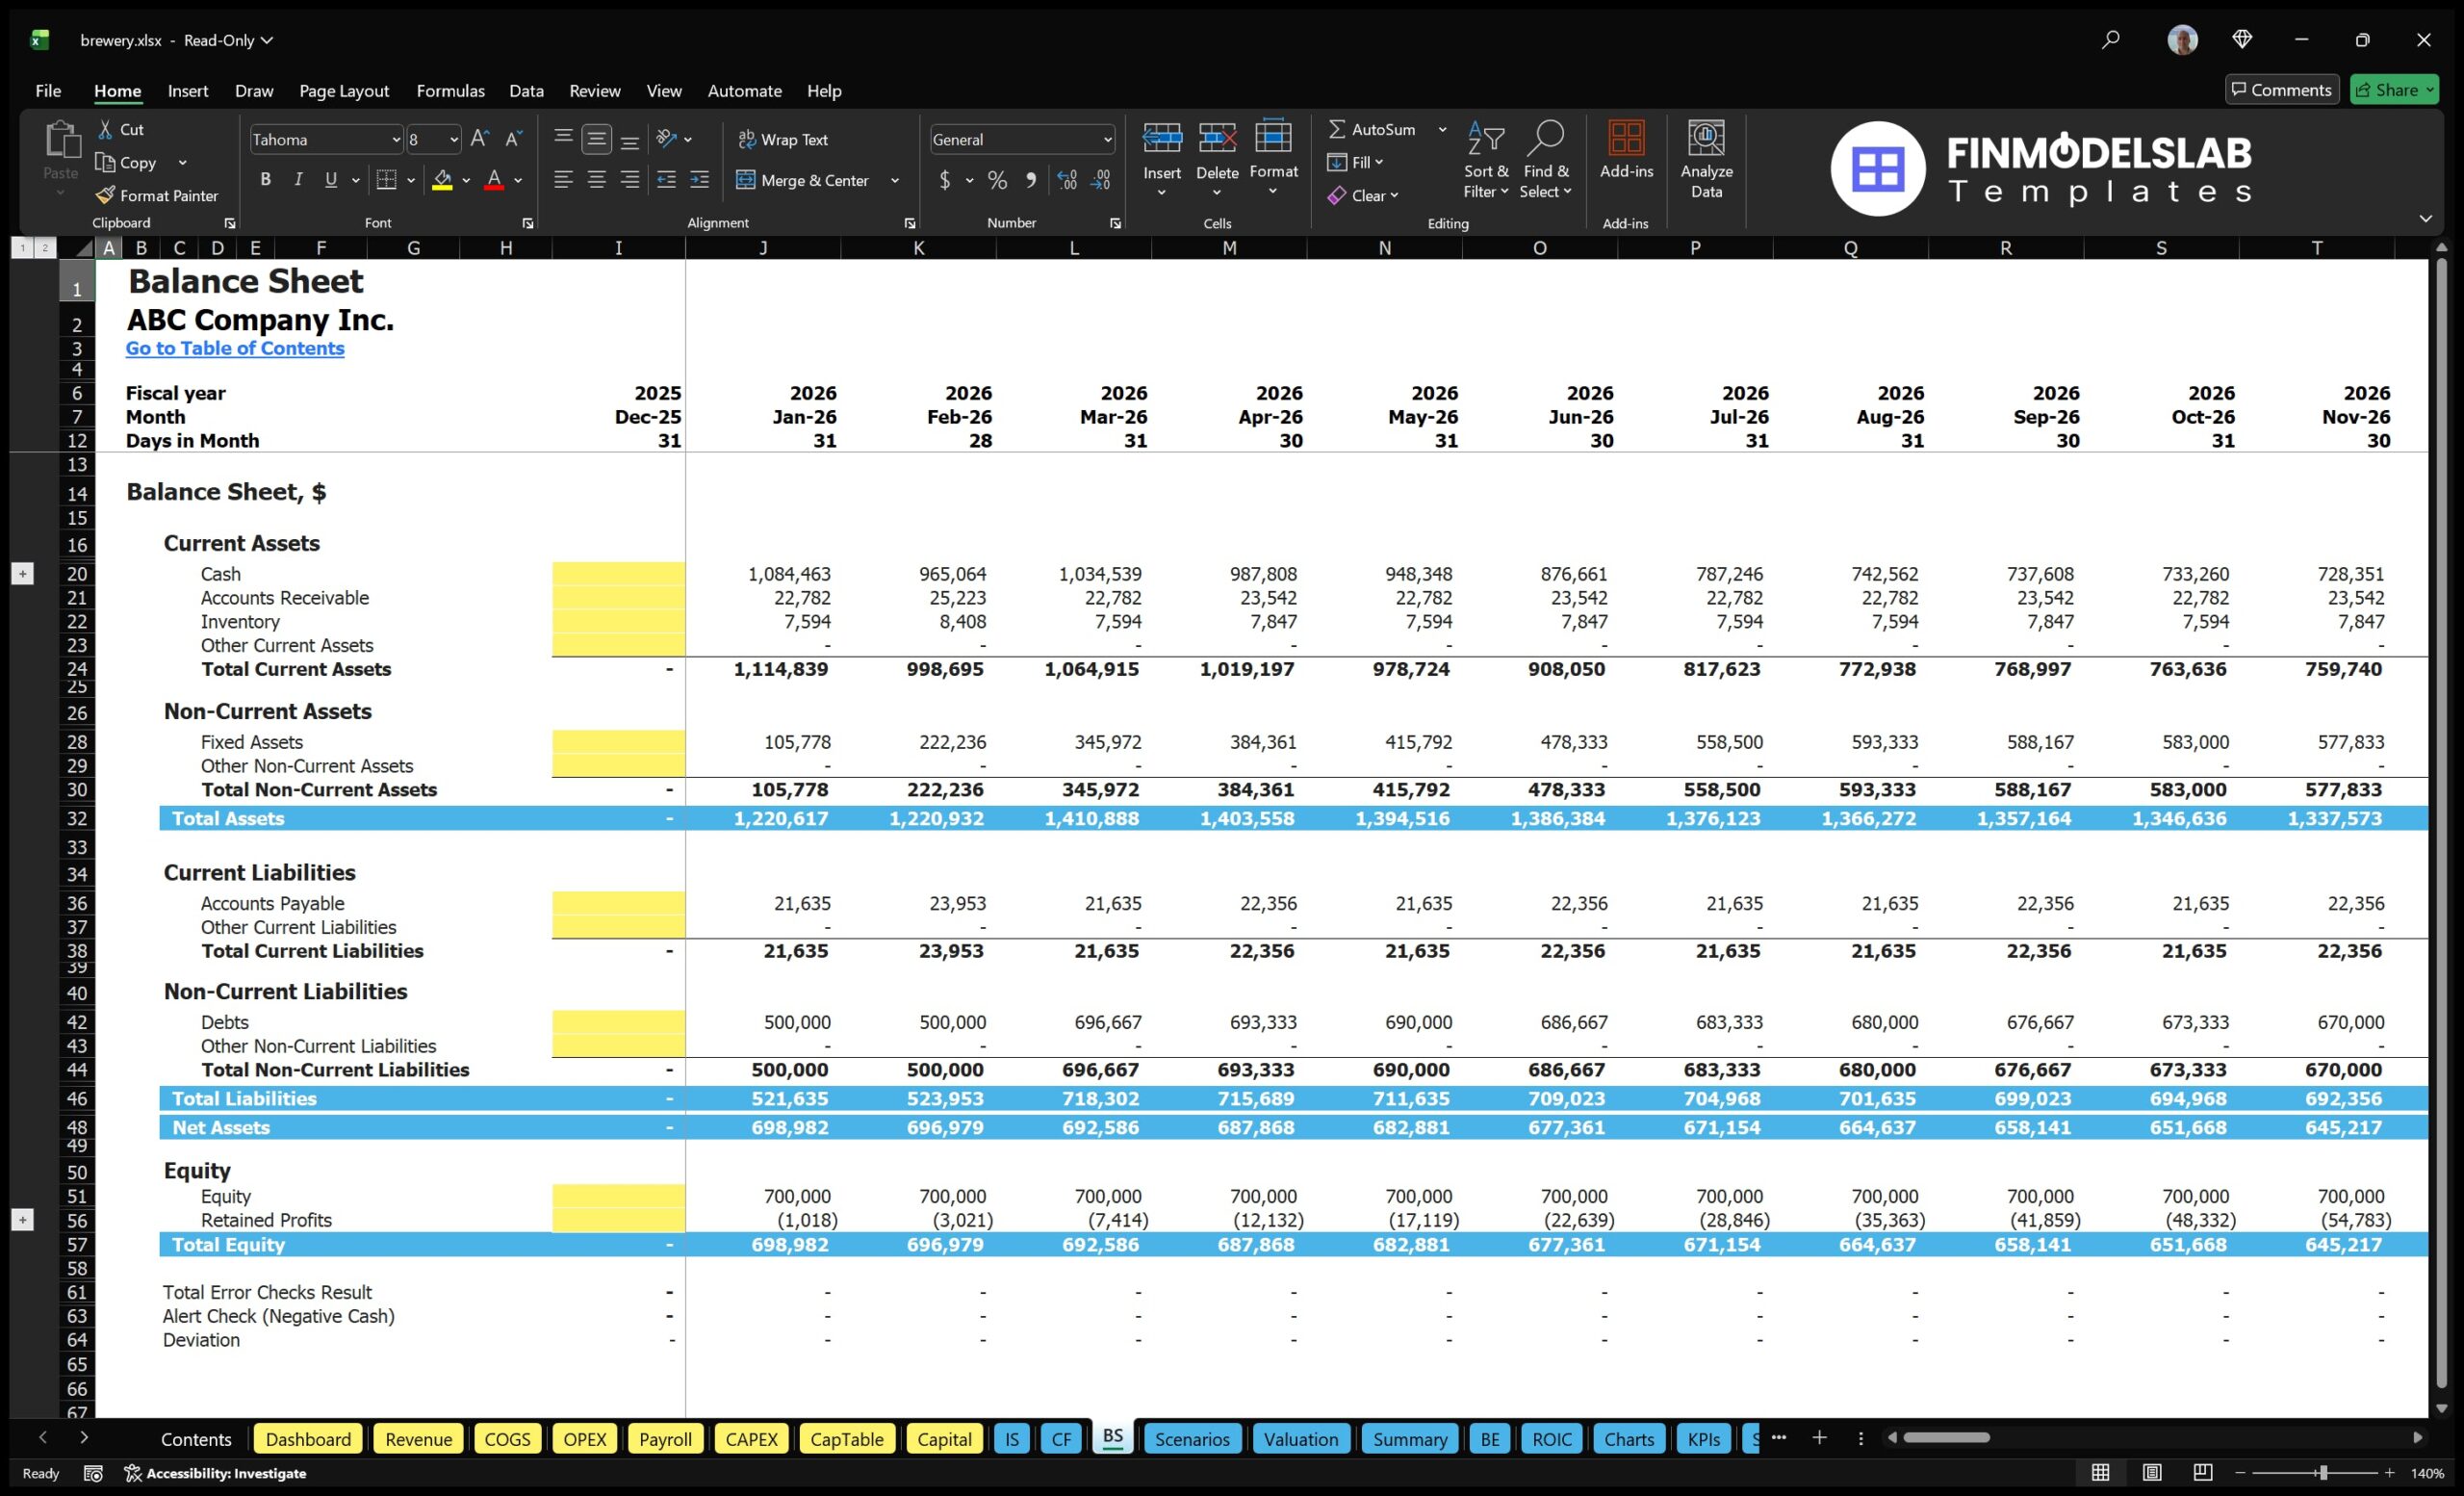
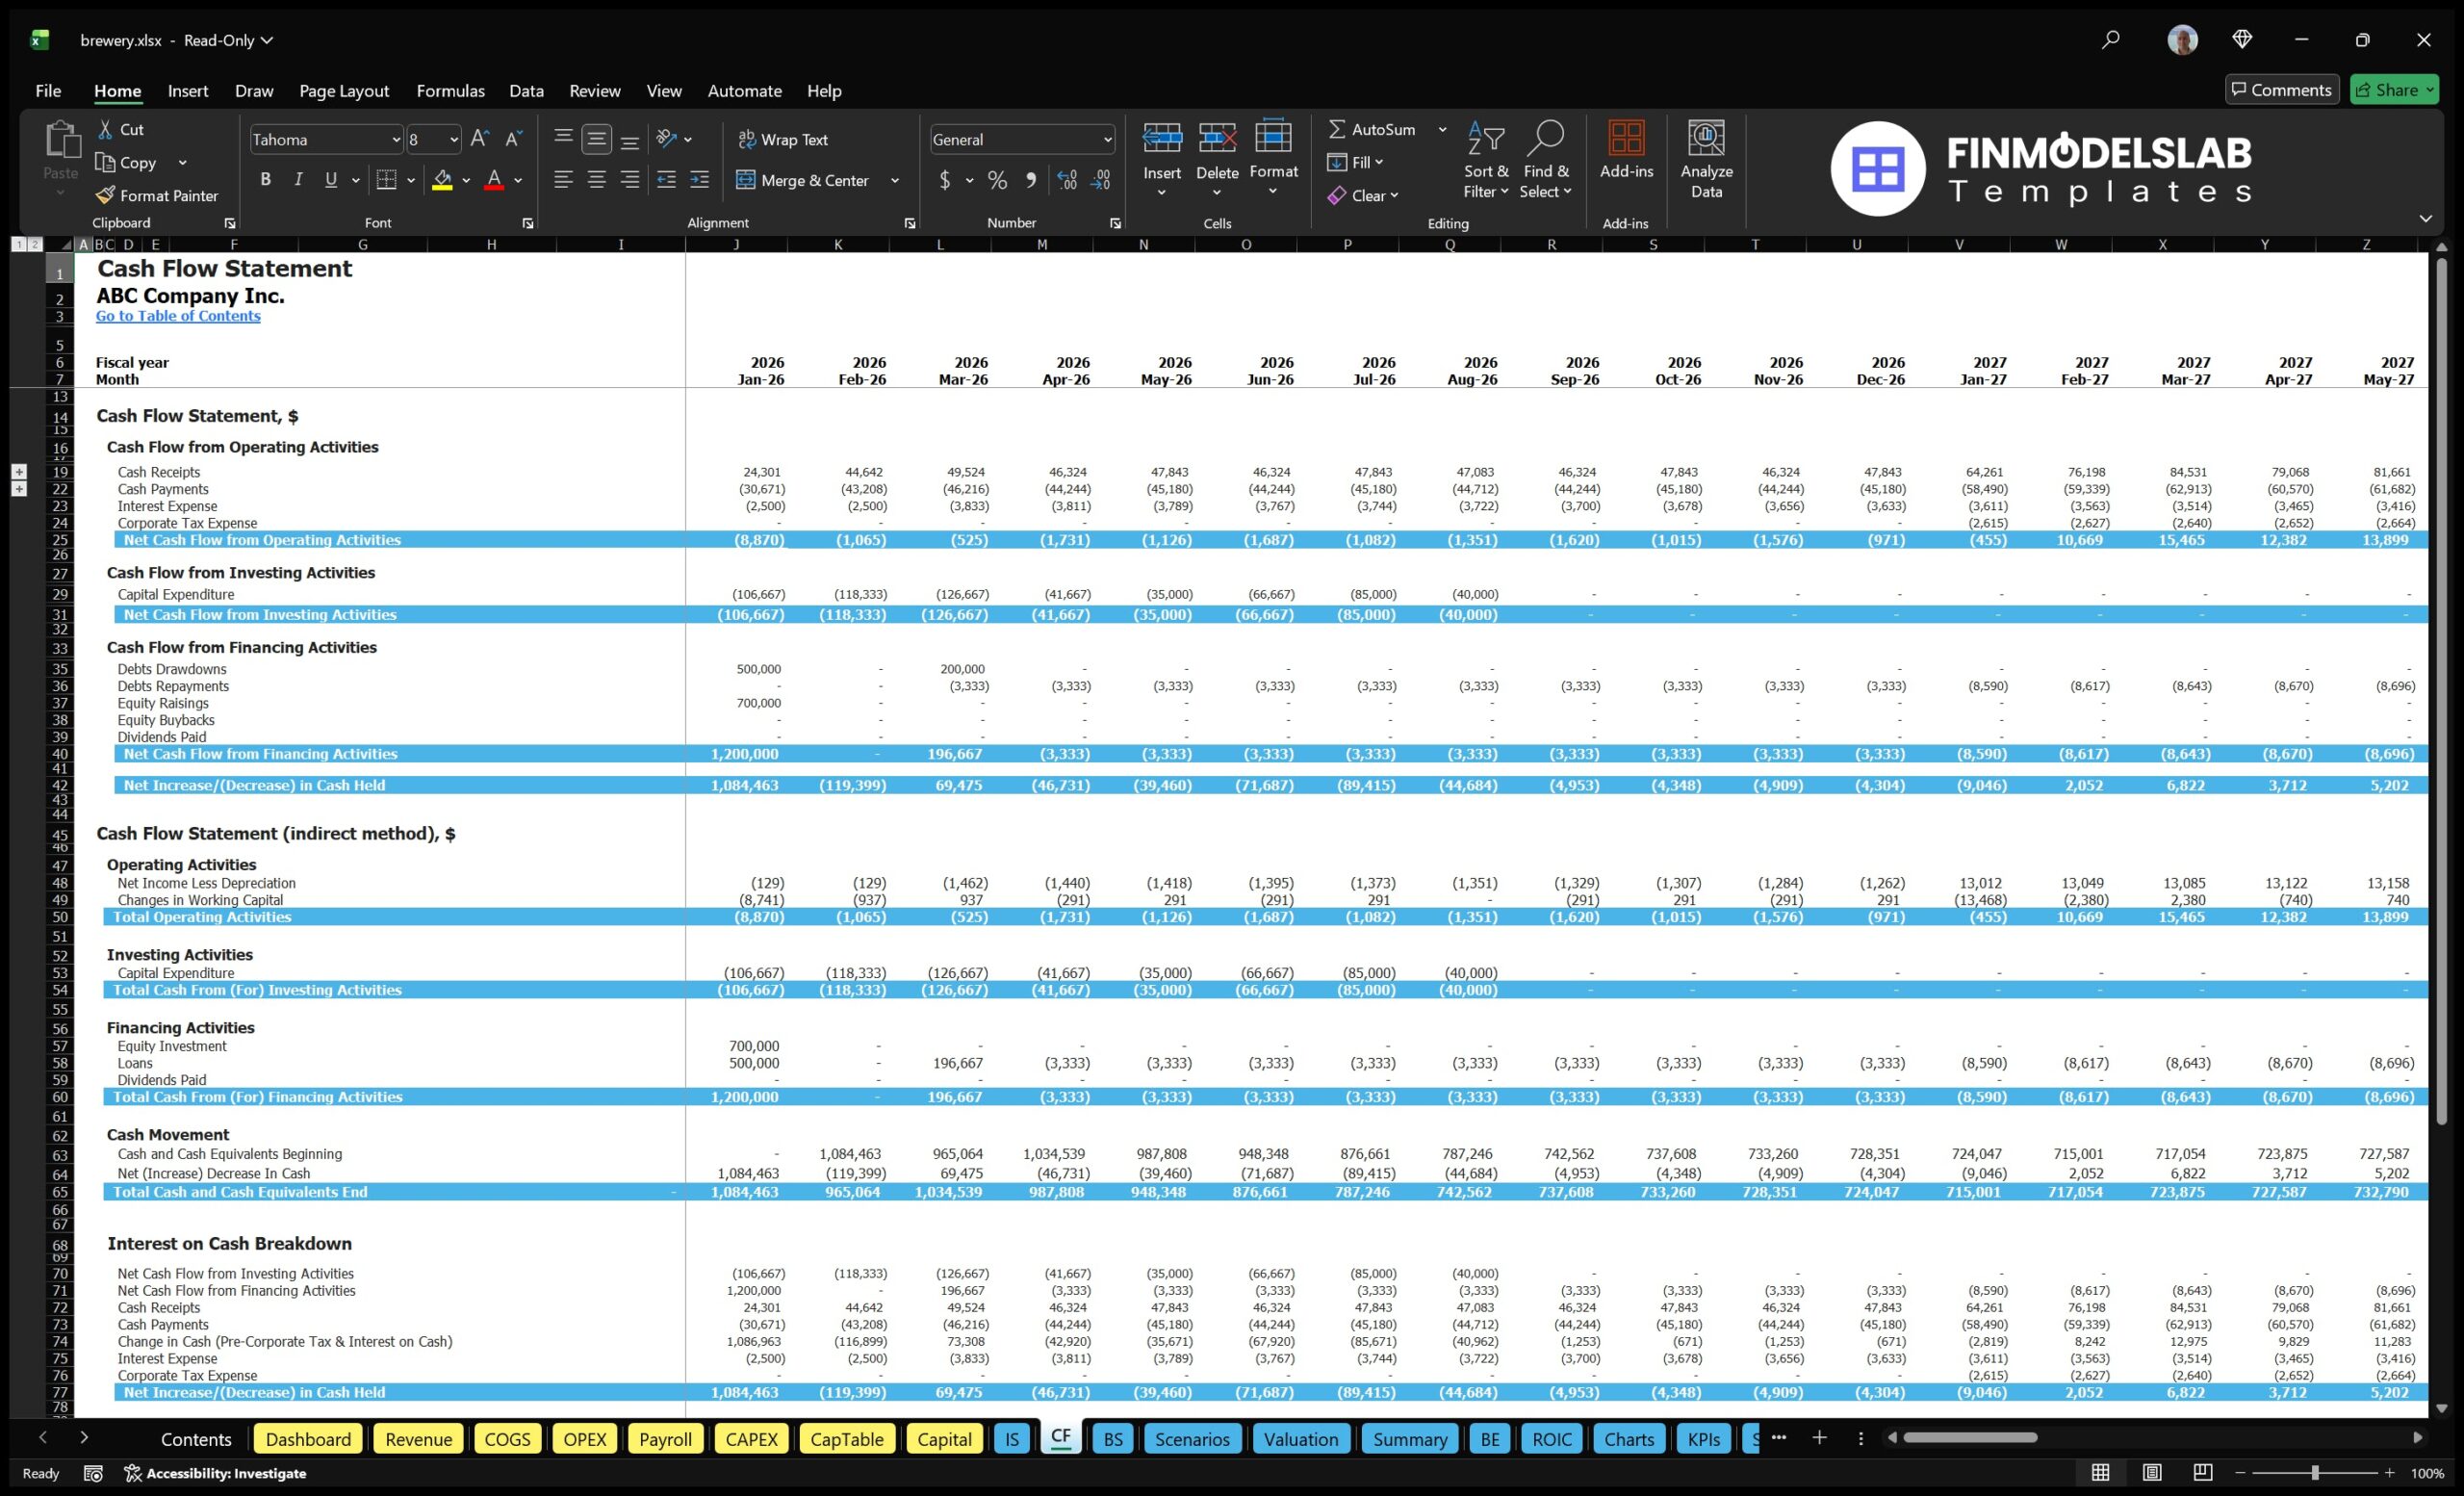
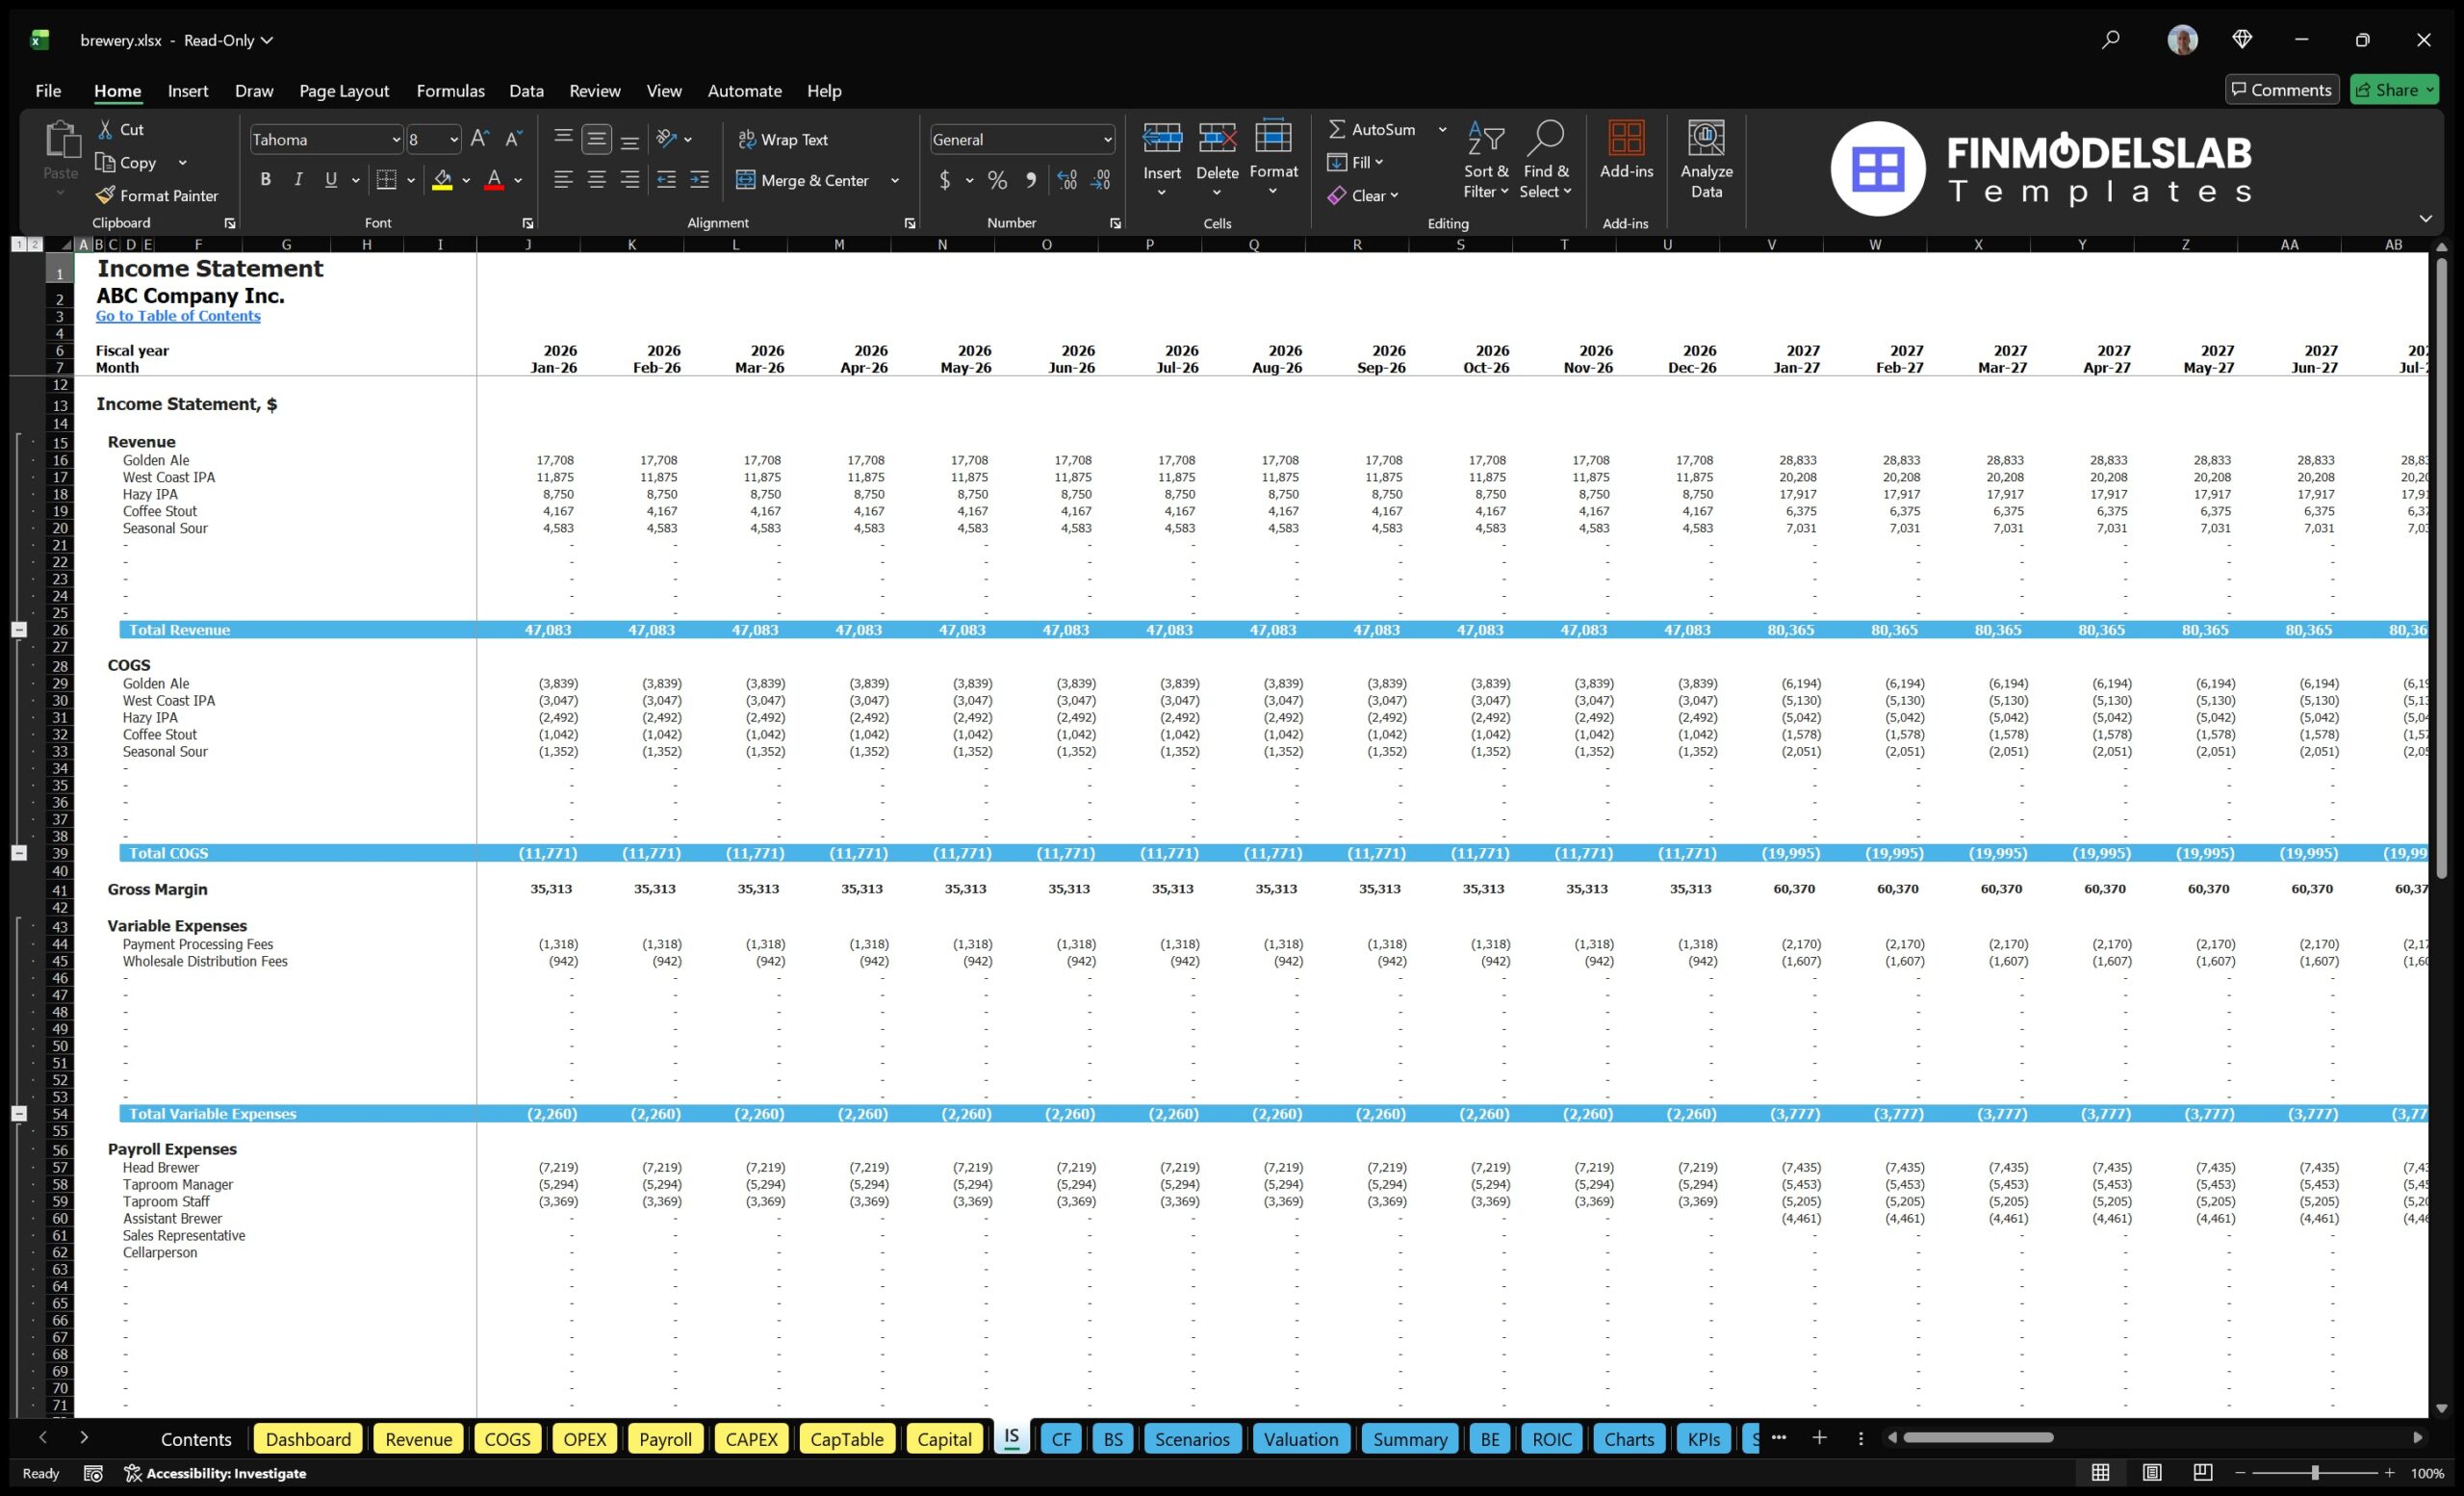
The bank-ready financial reports section provides structured financial outputs that can support lender reviews, investor presentations, and formal business planning documents. This component typically includes the major financial statements and summary reports that stakeholders expect to see, such as a profit and loss statement, cash flow forecast, balance sheet, and related financial summaries. For a brewery, these reports are essential because lenders and investors need to understand the relationship between startup capital, equipment purchases, revenue growth, operating expenses, debt service, working capital, and profitability. Users can rely on the model’s linked assumptions and formulas to generate consistent projections across the statements, reducing the risk that revenue, expenses, cash, and balance sheet items do not align. The reports help answer questions such as whether the brewery can cover its monthly operating costs, whether it has enough cash during the ramp-up period, whether debt payments are affordable, and when the business may become profitable. Clean, professional formatting also makes the outputs easier to share with banks, investors, partners, accountants, and internal decision-makers. This section helps users present the brewery’s financial plan in a credible and organized way.
Revenue Breakdown by Beer Line
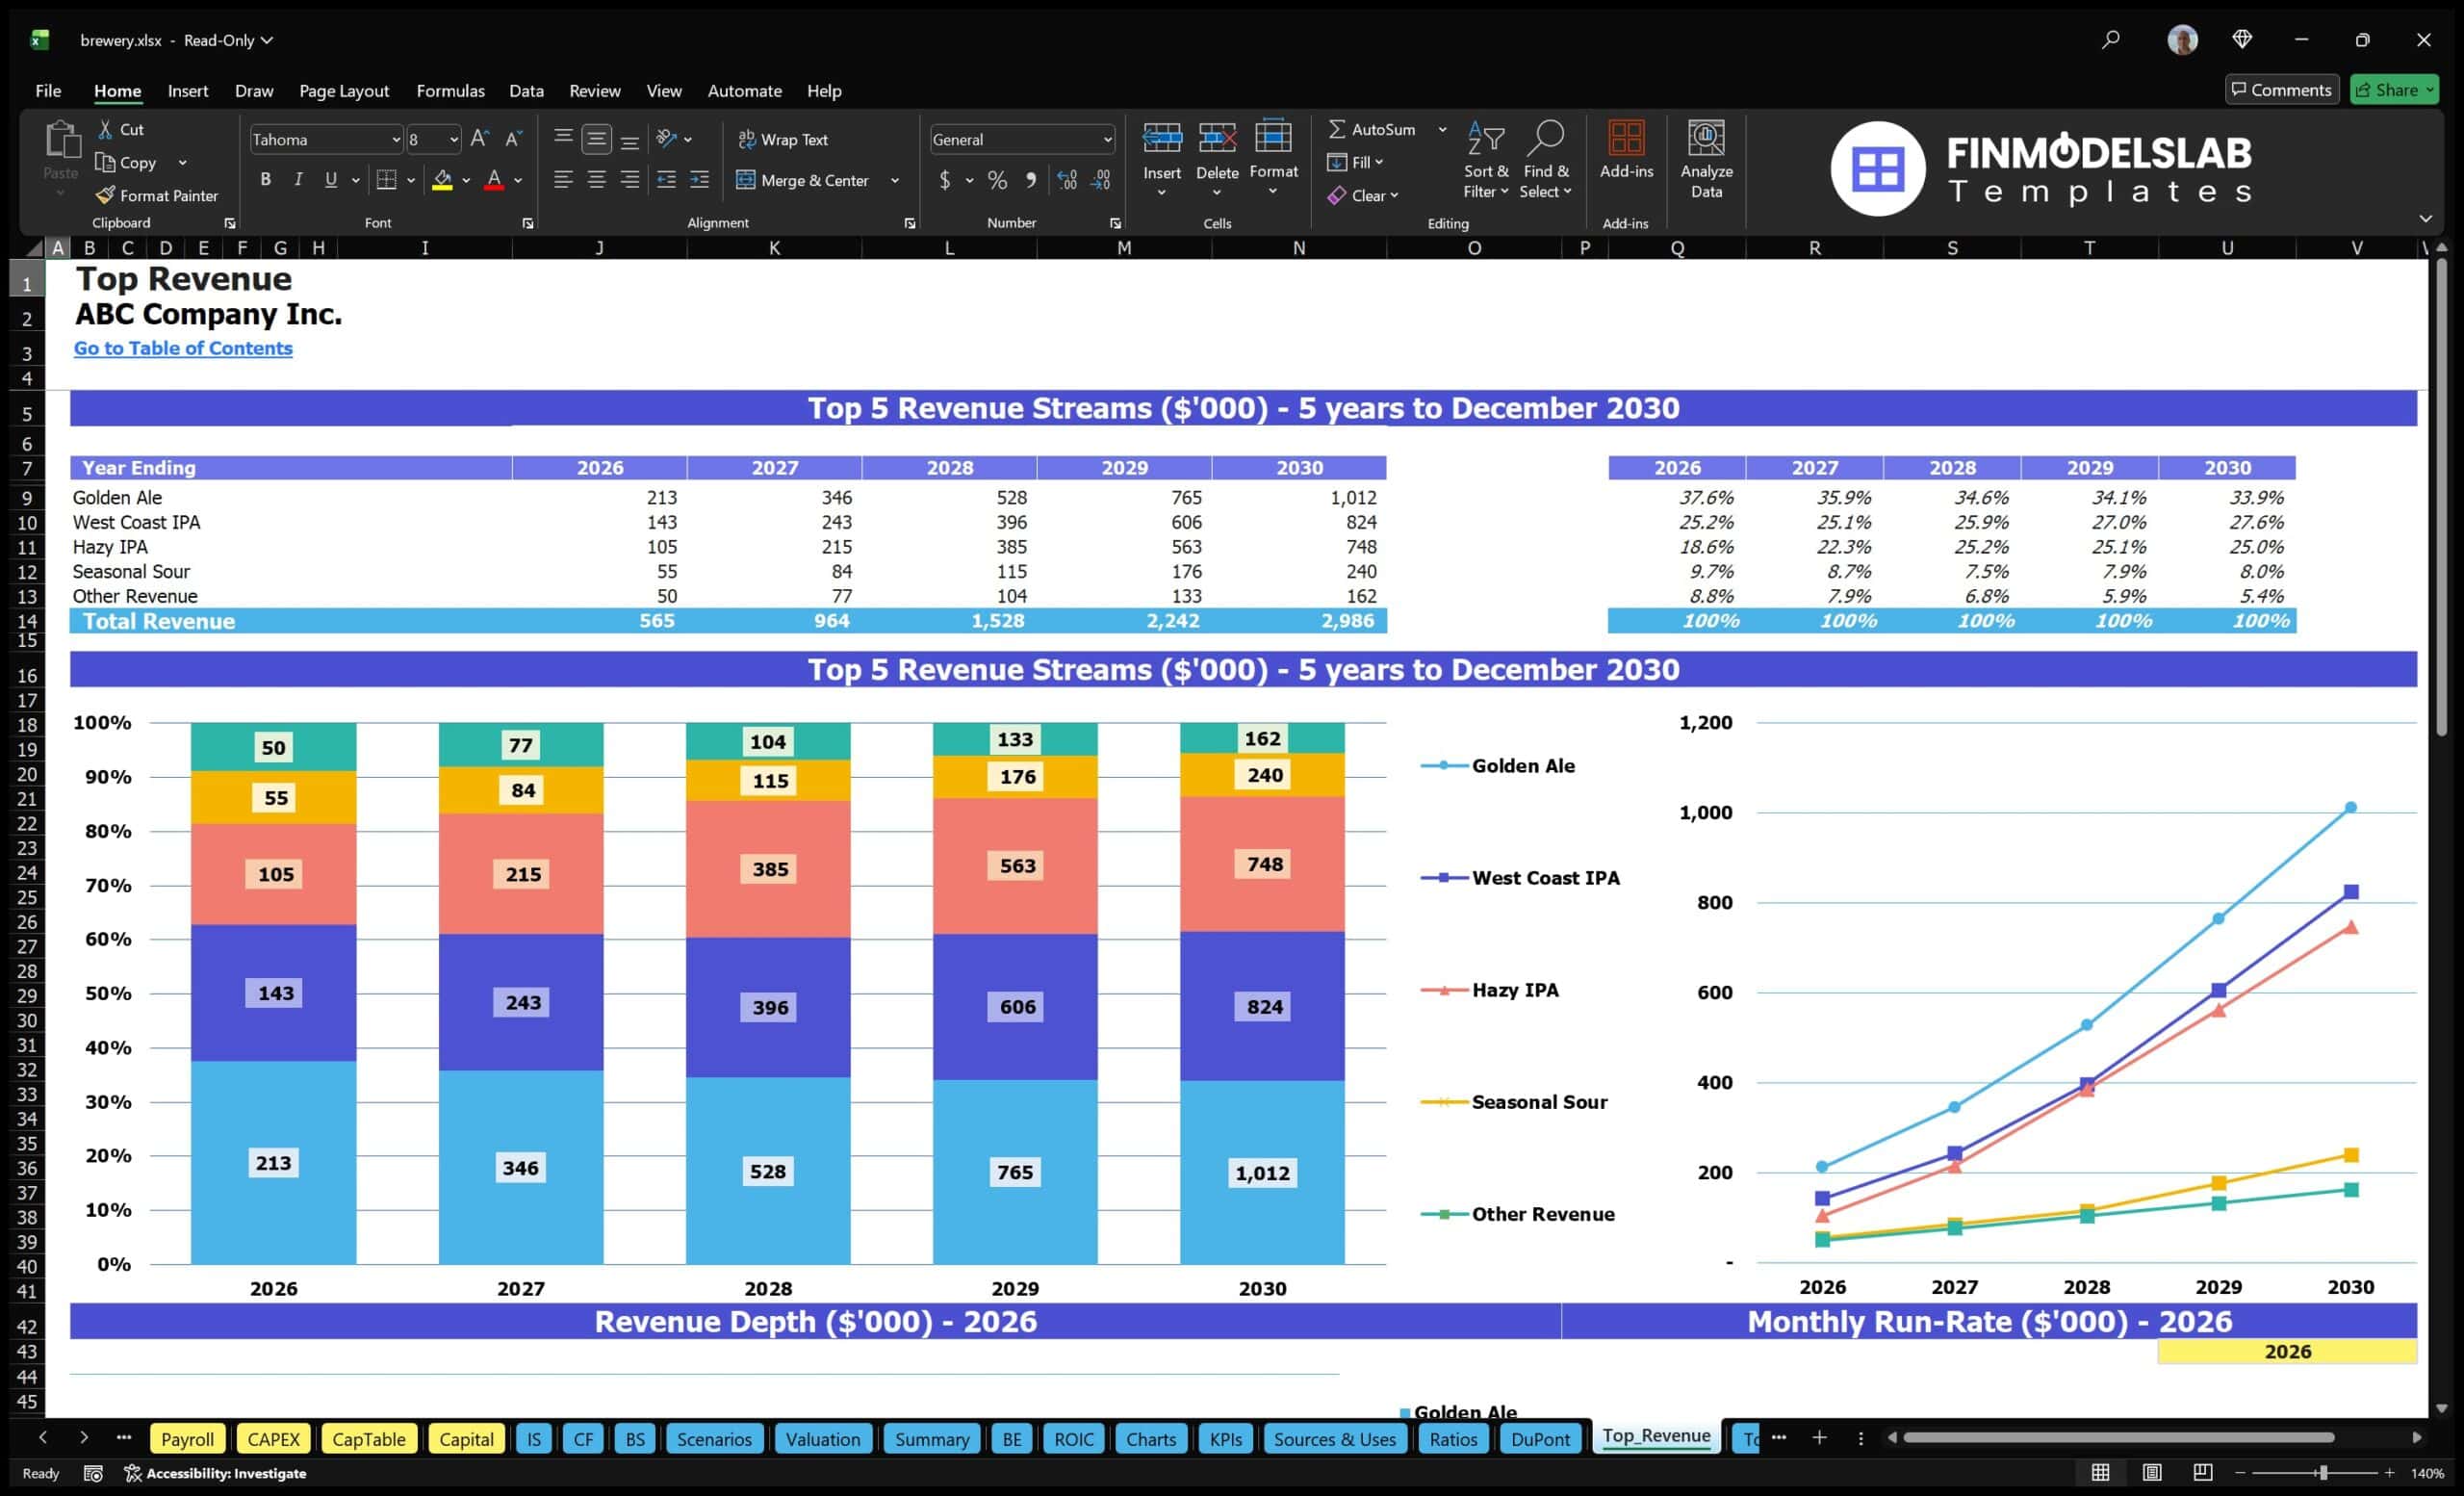
The revenue breakdown section gives users a more detailed view of how different beer lines, product categories, or revenue streams contribute to total sales. Instead of treating brewery revenue as one general number, this component separates the forecast into individual drivers so users can see which products or channels are expected to generate the most income. Inputs may include production units, sales volume, average price per unit, growth rates, and mix assumptions for core beers, premium releases, seasonal products, taproom sales, packaged products, or wholesale distribution. Outputs can show revenue by category, share of total revenue, and changes in product contribution over time. This level of detail is useful because brewery profitability can vary significantly depending on the sales mix. Taproom sales may carry different margins than wholesale distribution, limited releases may support premium pricing, and seasonal products may help drive customer engagement but require careful planning. By reviewing the revenue breakdown, users can test whether their product strategy is balanced, identify the highest-value revenue streams, and make better decisions about production scheduling, pricing, marketing focus, and capacity allocation.
KPI Dashboard and Benchmark Metrics
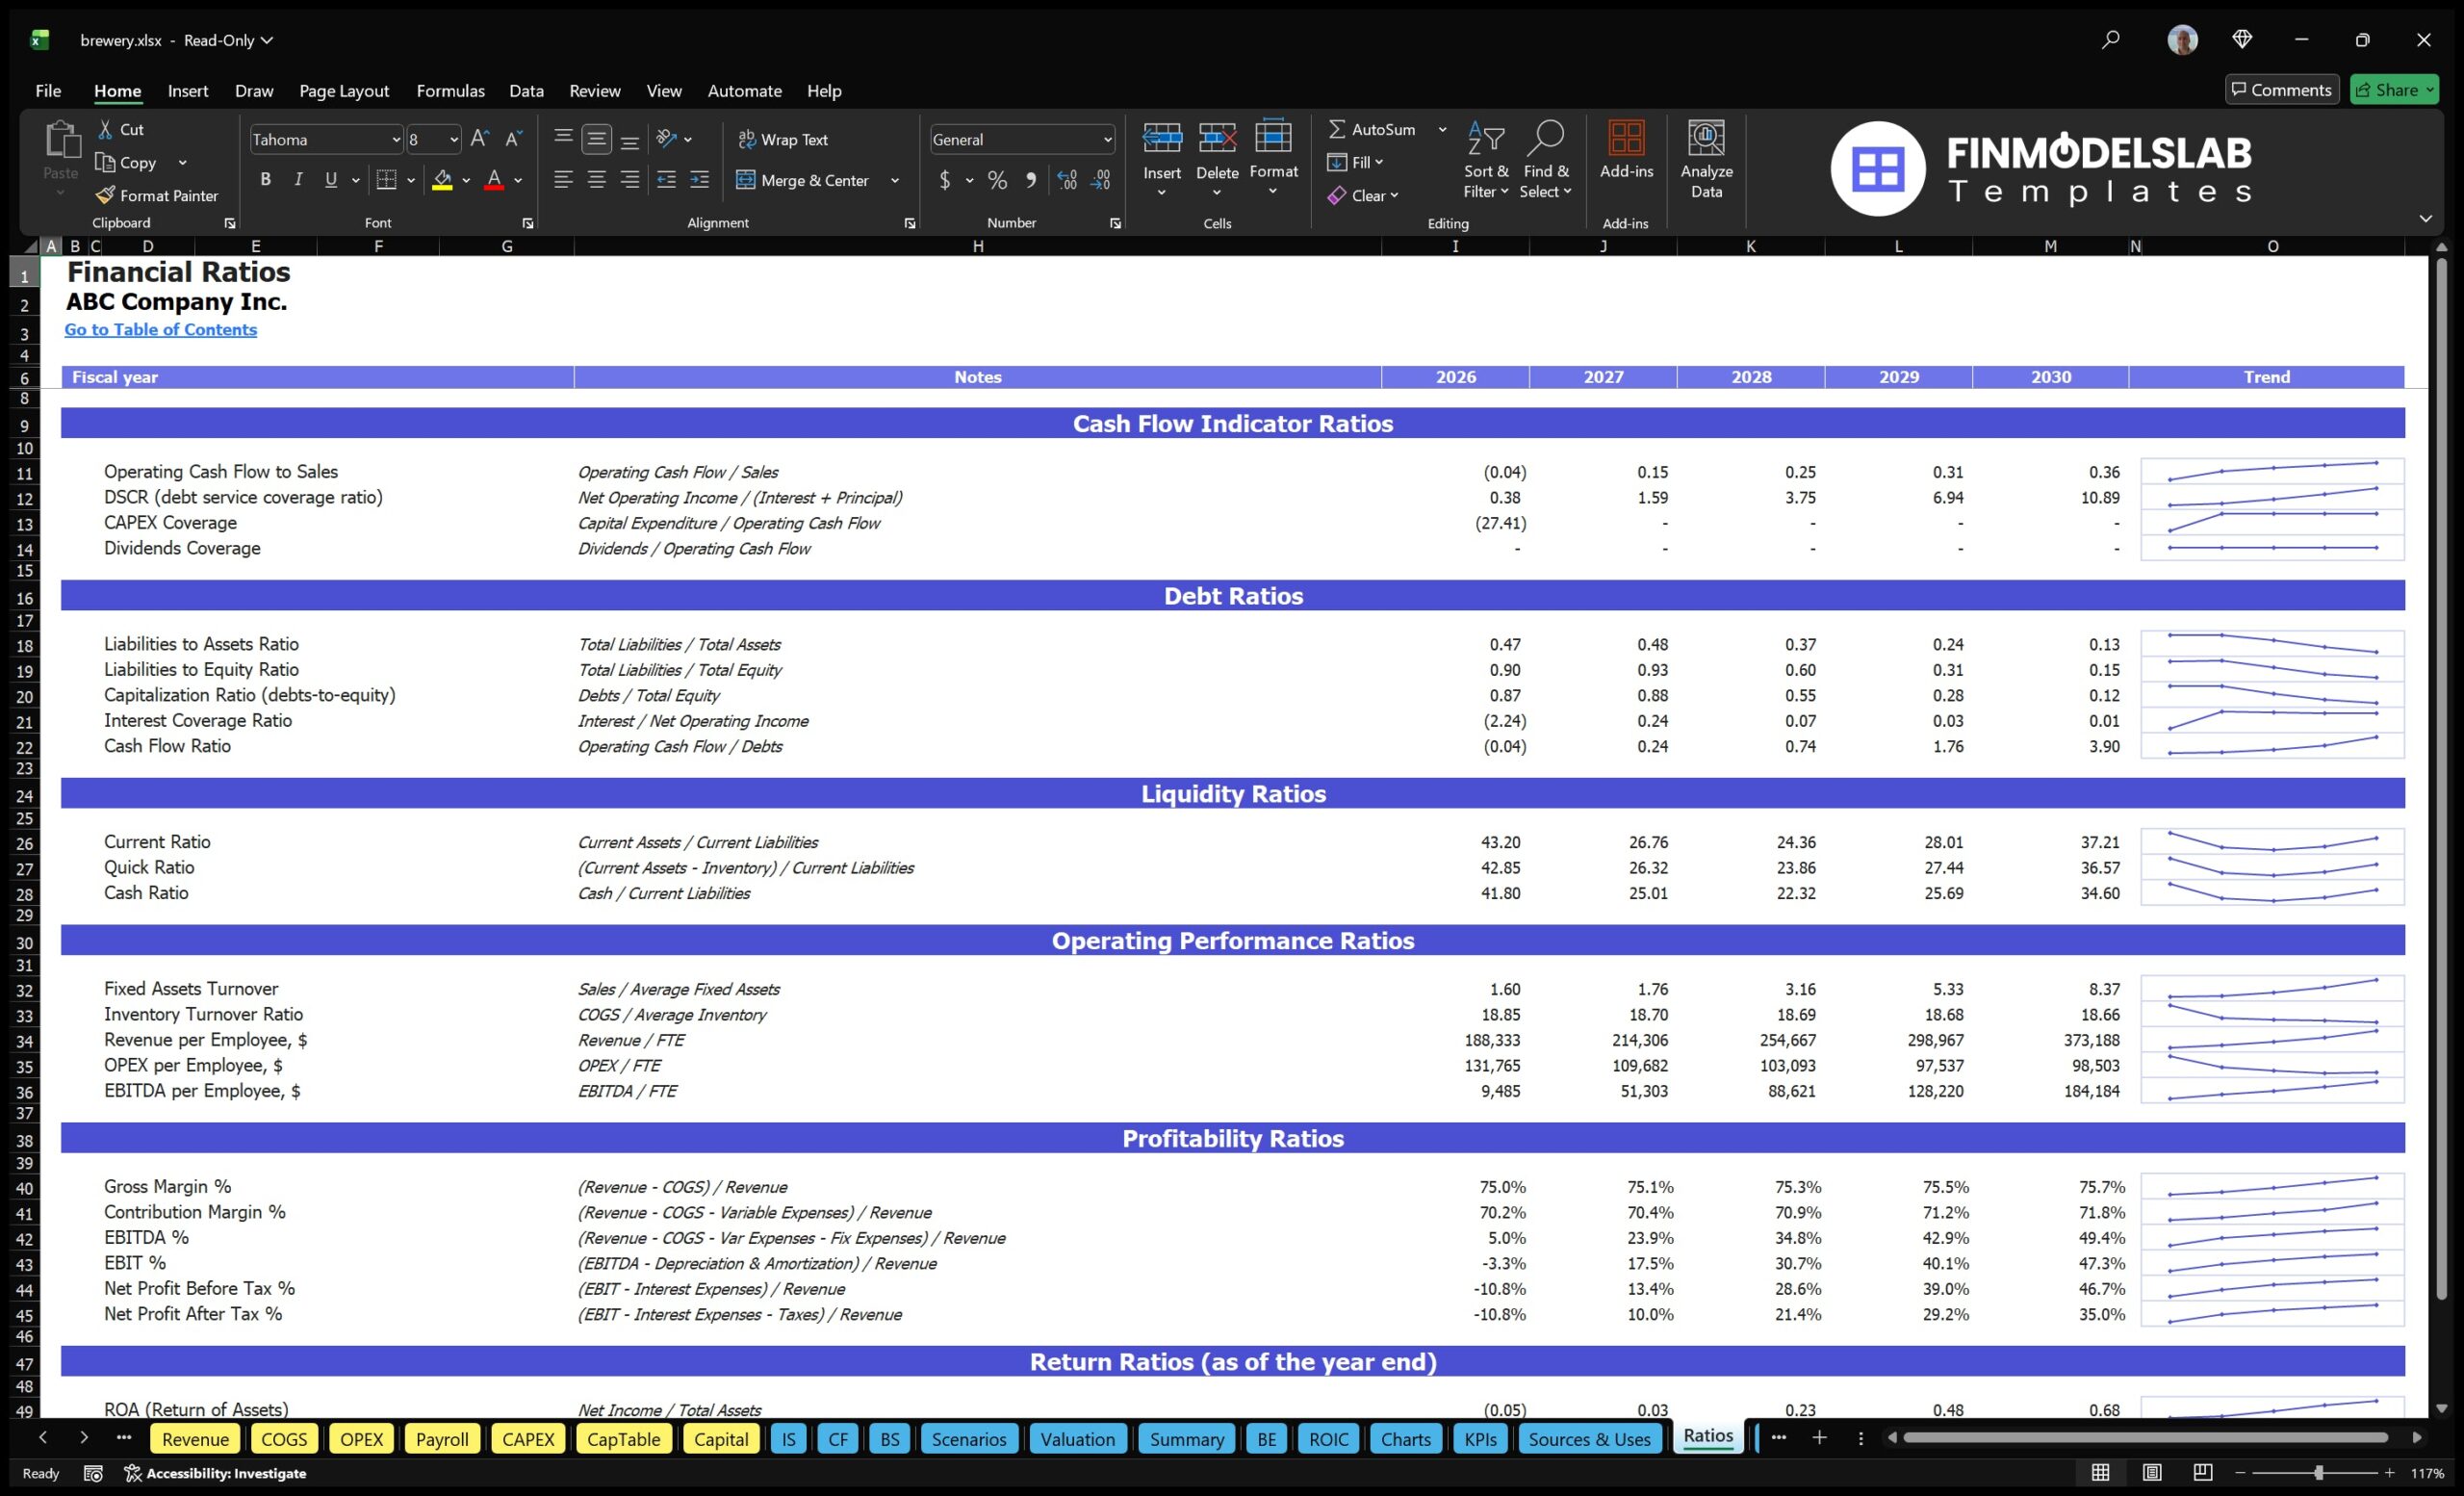
The KPI dashboard and benchmark metrics section helps users monitor brewery performance through key indicators that are easier to interpret than full financial statements alone. This component may include metrics such as revenue growth, gross margin, EBITDA margin, net profit margin, cash balance, break-even timing, return on equity, payback period, cost of goods sold as a percentage of revenue, payroll as a percentage of revenue, and other operating or financial ratios relevant to craft breweries. Benchmarks provide context by allowing users to compare their forecasted performance against industry standards or reasonable planning targets. This is valuable because a forecast may look attractive in absolute dollars but still reveal weak margins, excessive overhead, slow payback, or unrealistic revenue assumptions when viewed through KPIs. Brewery owners can use the KPI dashboard to track whether the business is moving toward sustainable profitability, while consultants and analysts can use it to validate assumptions and identify areas for improvement. For investors and lenders, benchmarked KPIs help make the model more credible because they show that the forecast has been evaluated against performance standards rather than presented in isolation.
Startup Cost and Capital Expenditure Planning
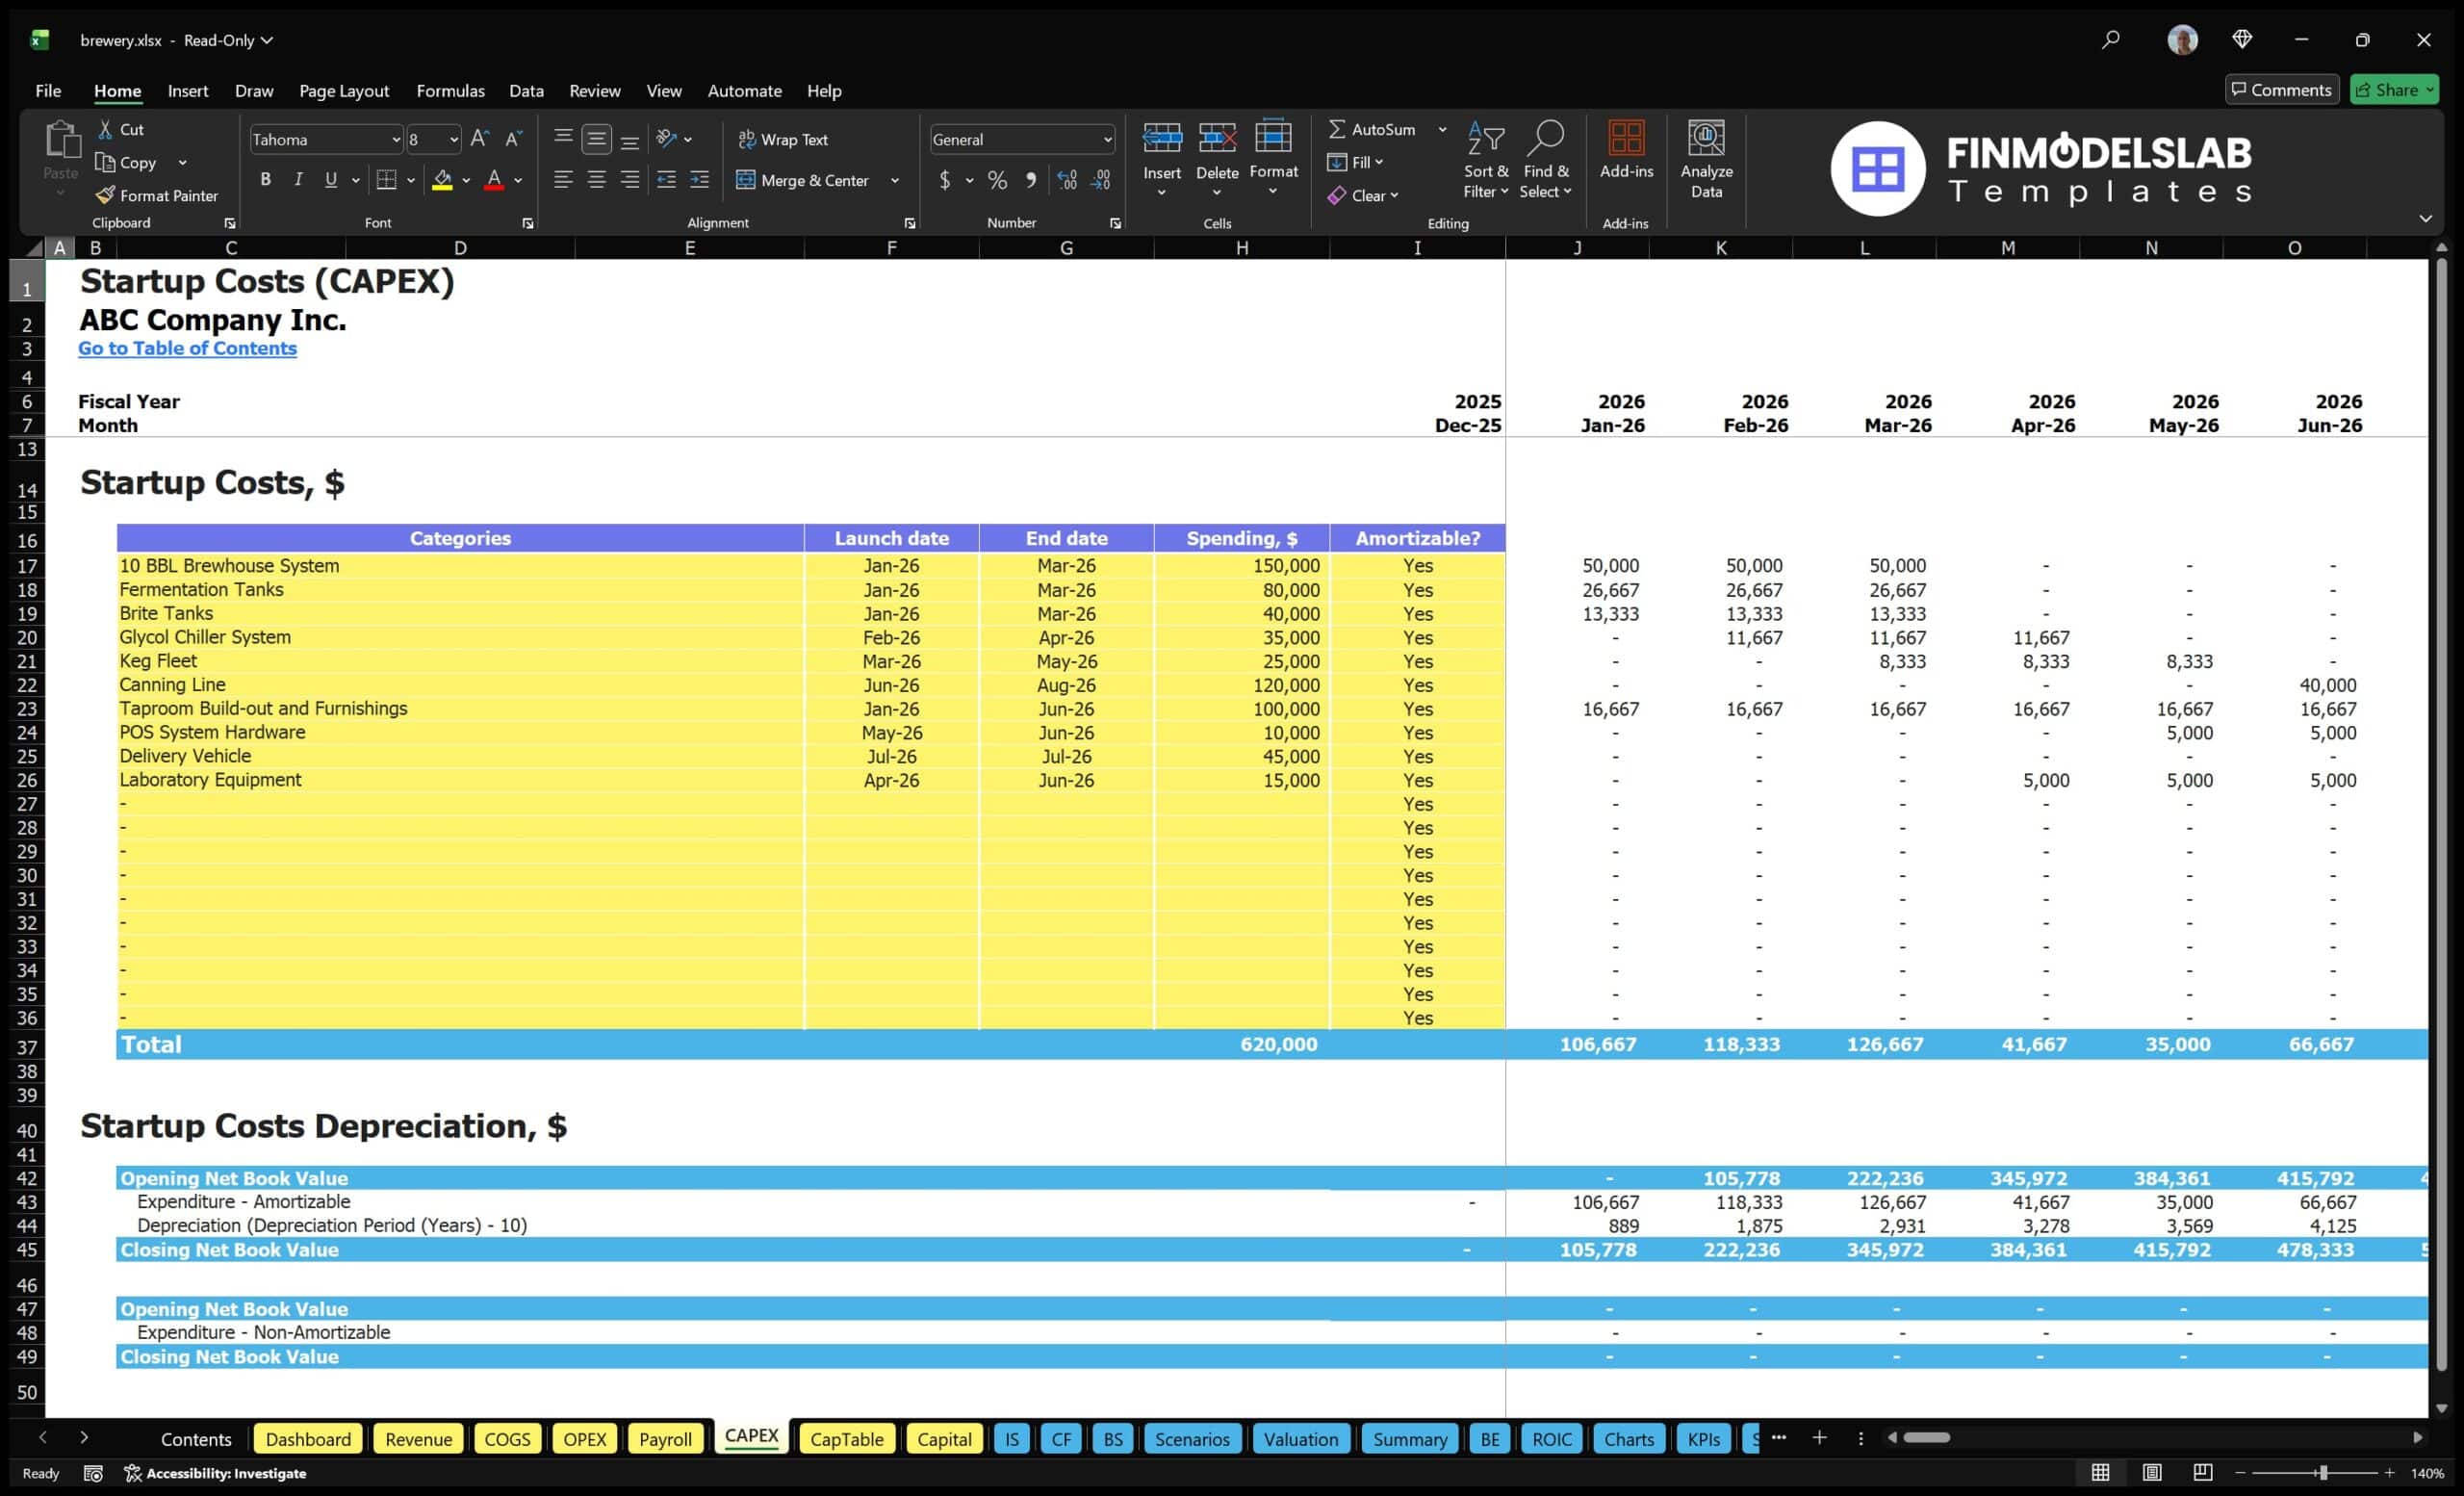
The startup cost and capital expenditure planning section helps users estimate the initial investment required to launch or expand a brewery. This is especially important because brewery businesses often require large upfront spending before meaningful revenue begins. Inputs may include brewhouse systems, fermentation tanks, brite tanks, canning or bottling equipment, refrigeration, kegs, taproom build-out, kitchen or service area improvements, furniture, signage, permits, licensing, professional fees, deposits, technology, initial inventory, pre-opening marketing, and working capital reserves. The section separates one-time startup costs from recurring operating expenses so users can understand how much capital is needed before opening and how much cash should be available during the early months of operation. Outputs may include a total startup budget, capital expenditure schedule, funding gap, and projected impact on depreciation, cash flow, and balance sheet assets. This component is useful for funding discussions because lenders and investors need to know exactly what the requested capital will be used for. It also helps founders avoid undercapitalization, one of the most common risks in equipment-heavy businesses. By organizing startup investment clearly, the model supports more realistic budgeting and better launch planning.
Break-Even Analysis
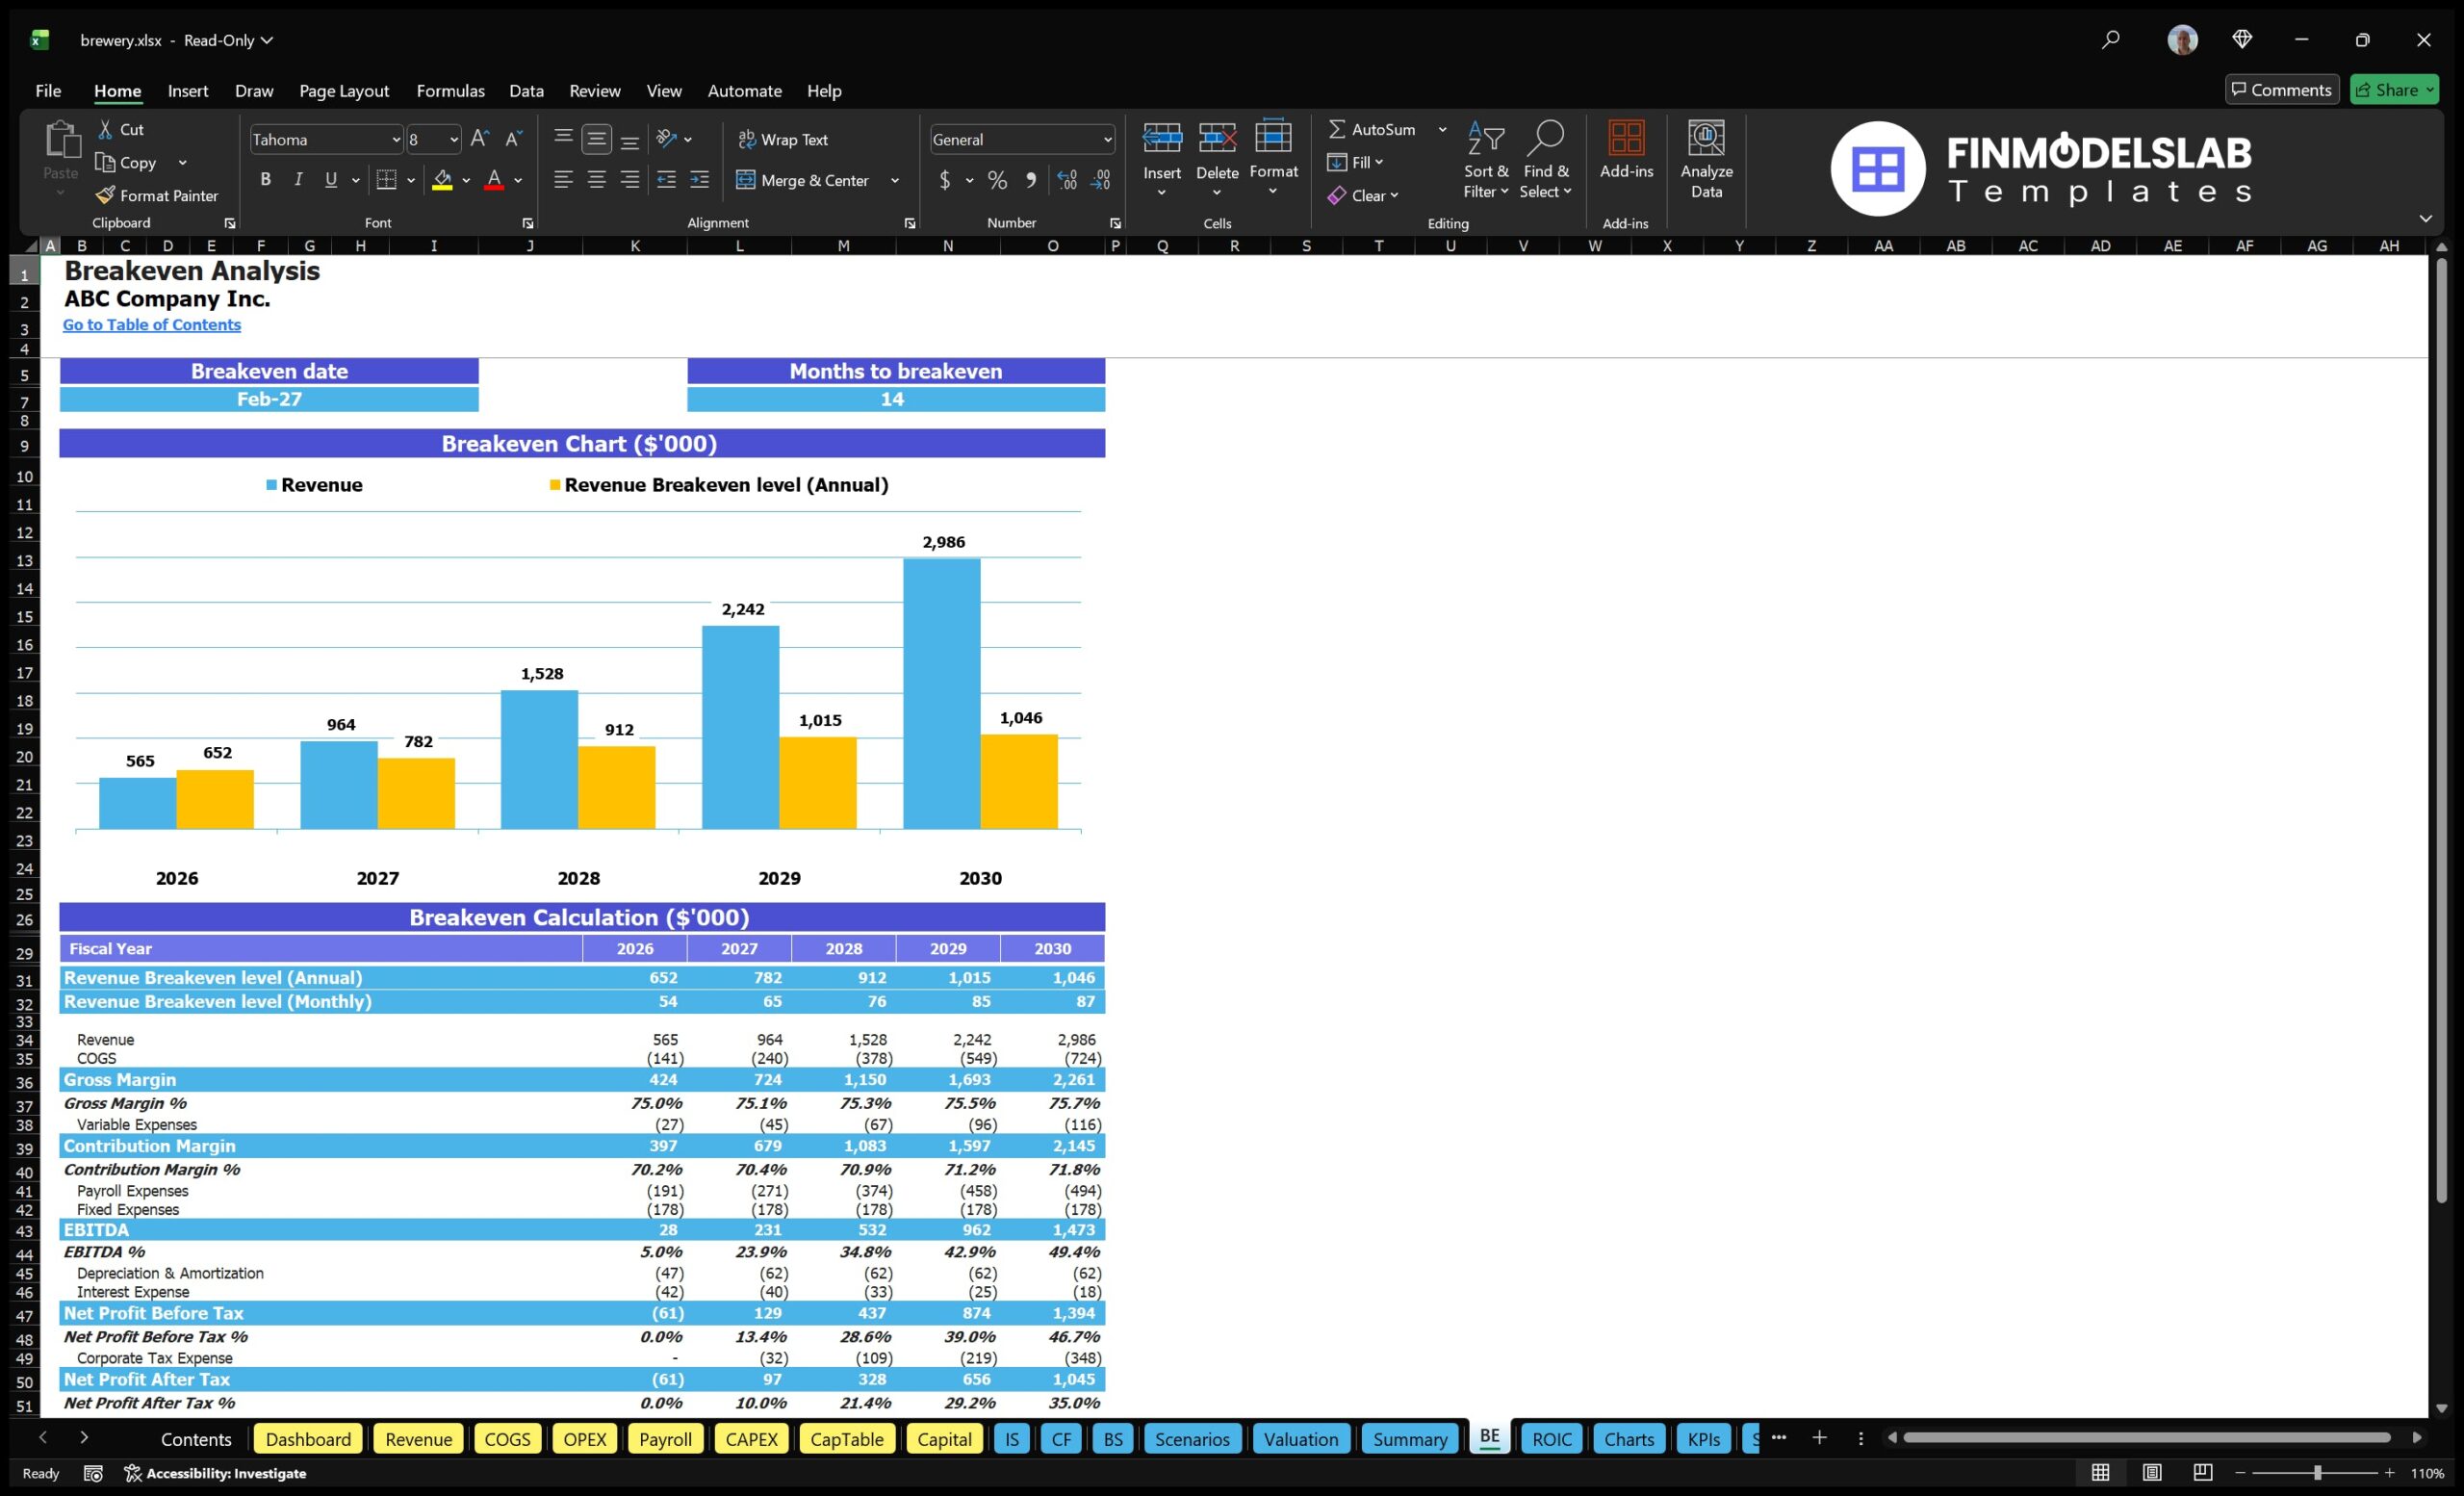
The break-even analysis section helps users identify when the brewery is expected to cover its costs and begin generating sustainable profit. This component connects revenue assumptions, cost of goods sold, fixed operating expenses, payroll, startup costs, and margin structure to estimate the sales level or time period required to reach break-even. Inputs may include average selling prices, gross margins, production volume, rent, utilities, salaries, marketing, administrative expenses, and other fixed and variable costs. Outputs may show the break-even month, break-even revenue, break-even units, cumulative profit or loss, and the relationship between sales growth and profitability. For a brewery, break-even analysis is valuable because fixed costs and upfront investment can be significant, while early production and customer demand may ramp gradually. Knowing the break-even point helps users evaluate whether their pricing, product mix, and growth assumptions are strong enough to support the business. It also helps with decision-making around taproom strategy, wholesale expansion, staffing levels, equipment purchases, and funding needs. For lenders and investors, a clear break-even analysis provides evidence that the business plan has been tested against the level of sales required to become financially viable.
File types:
Excel – Single-User: .xlsx
Excel – Multi-User: .xlsx
Similar ProductsOther customers were also interested in...


 HenrySheykin
Micro Distillery Business Plan Financial Model Exc...
The Micro-Distillery Financial Model helps founders, operators, consultants, analysts, and business ... Read more
Juice Production Business Plan Financial Model Exc...
The Fruit Juice Concentrate Production Financial Model helps users turn a capital-intensive beverage... Read more

 eFinancialModels
Liquor Distillery Financial Plan Template
Distilleries, with their rich history of crafting spirits, have experienced a resurgence in populari... Read more
 David
Manufacturing Startup/Existing Business Financial ...
3 statement 5 year rolling financial projection Excel model for a startup /existing manufacturing bu... Read more

 Giorgos
Microbrewery – 10 Year Financial Model
Financial Model providing a dynamic up to 10-year financial forecast for a startup or existing Micro... Read more
Fruit Processing Facility – 10 Year Financia...
Financial Model providing a dynamic up to 10-year financial forecast for a startup Fruit Processing ... Read more
Manufacturing Financial Model Templates Bundle
This is a collection of financial model templates in Excel for businesses in the Manufacturing indus... Read more
Solar Panel Manufacturing Plant Business Plan Fina...
The Solar Panel Manufacturing Financial Model helps users turn a solar factory concept into a struct... Read more
Clothing Manufacturing Business Plan Financial Mod...
The Clothing Manufacturing Financial Model helps users turn a garment production concept into a stru... Read more
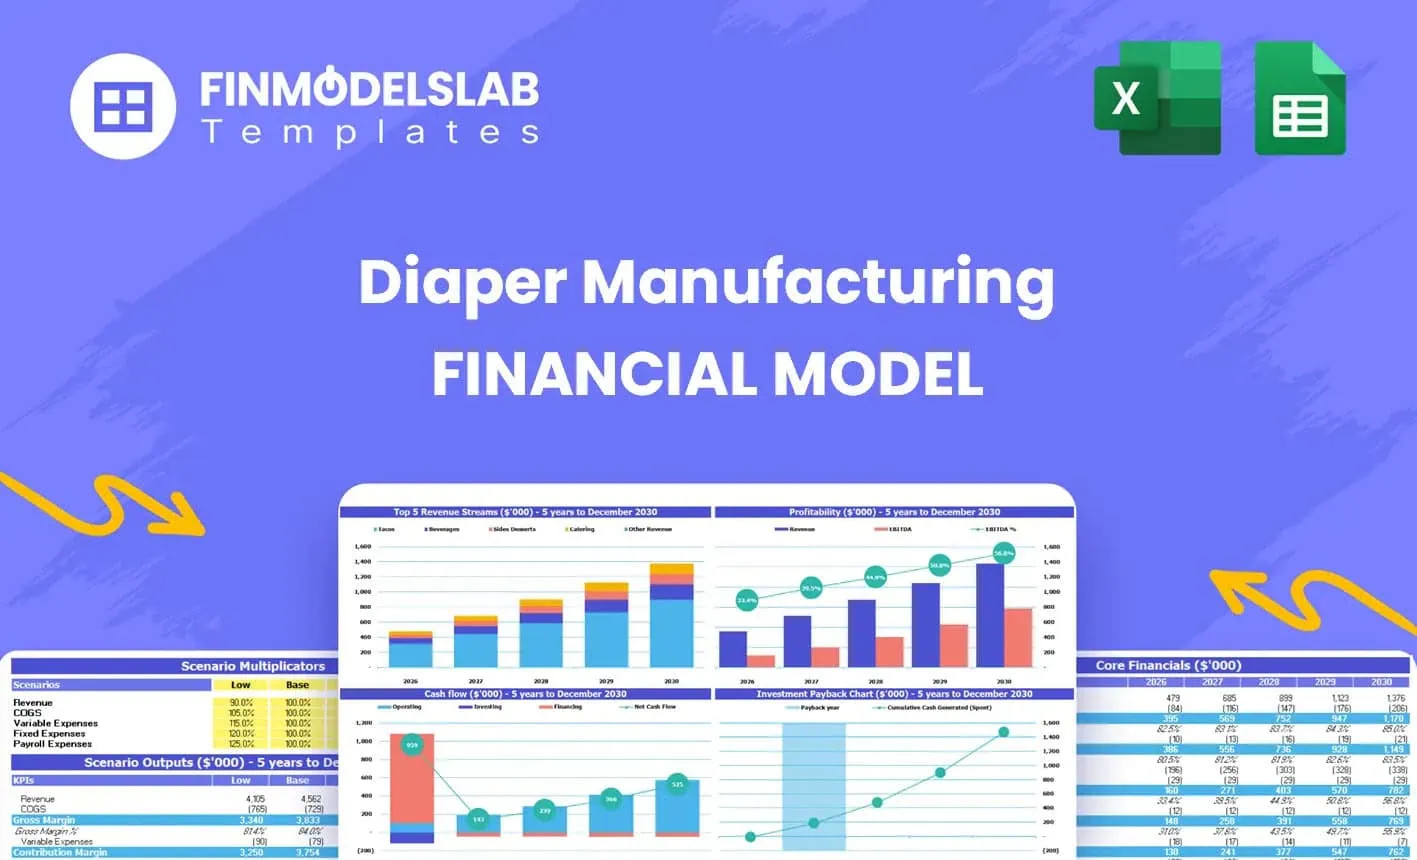
Diaper Manufacturing Business Plan Financial Model...
The Diaper Manufacturing Financial Model helps users turn a disposable diaper factory concept into a... Read more
You must log in to submit a review.