
0 ITEMS

Casino Hotel Financial Model Excel Template
The Casino Hotel Financial Model helps users build a structured five-year forecast for an integrated hospitality and gaming business. Instead of relying on a generic hotel spreadsheet with a few casino lines added, this template is designed around the real drivers of a casino hotel, including room nights, occupancy, average daily rates, casino win, food and beverage activity, guest services, labor, capital expenditures, operating costs, cash flow, and profitability. It gives entrepreneurs and planners a practical way to organize financial assumptions, estimate startup costs, and understand how the business may perform before committing major capital. This financial model template is useful for casino hotel developers, hospitality entrepreneurs, business owners, consultants, analysts, and founders preparing business plans, funding documents, lender packages, or investor presentations. Users can adjust revenue assumptions for room categories, weekday and weekend rates, gaming revenue, events, spa services, parking, retail, and other income streams. The model also supports planning for payroll, department-level expenses, fixed overhead, variable costs, and capital spending, helping users evaluate whether the business can support its operating structure and long-term growth goals. The template connects revenue assumptions with operating expenses, startup costs, cash flow, profitability, and break-even analysis in one editable planning file. This makes it easier to test different business scenarios, compare low, base, and high outcomes, and see how changes in occupancy, pricing, casino performance, or staffing affect financial results. Users can review key outputs such as profit and loss, cash flow, balance sheet movement, EBITDA, return metrics, and funding needs without building complex formulas from scratch. Built for practical decision-making, the Casino Hotel Financial Model helps users identify capital requirements, monitor liquidity, evaluate payback timing, assess investor returns, and prepare more credible financial projections. Whether the goal is launching a new casino hotel, expanding an existing resort, restructuring a business plan, or validating a funding request, the template provides a ready-to-use framework that can be customized in Excel or Google Sheets. It saves time, improves planning discipline, and helps turn a complex casino hotel concept into a clearer financial roadmap.
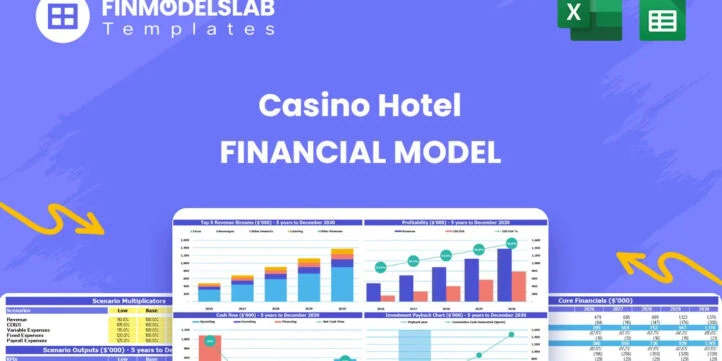


Casino Hotel Financial Model Overview
The Casino Hotel Financial Model is a ready-to-use financial model template built for the unique economics of an integrated hospitality and gaming property. A casino hotel is not driven by a single revenue stream, so the model is structured to bring together room revenue, casino win, food and beverage activity, ancillary guest services, payroll, operating expenses, capital expenditures, cash flow, profitability, and investor return metrics in one connected planning file. It is designed for entrepreneurs, developers, hotel operators, casino owners, consultants, analysts, and business plan writers who need a practical way to forecast performance, prepare funding documents, and make informed decisions before launching, acquiring, or expanding a casino hotel. The model helps users replace fragmented assumptions with a clear financial planning framework, making it easier to understand how occupancy, average daily rates, gaming performance, guest spending, staffing, and capital investment interact over a multi-year forecast period.
All-in-One Dashboard
The all-in-one dashboard brings the core inputs and core outputs of the Casino Hotel Financial Model into a single control center, giving users a fast way to understand the forecast without moving through every supporting sheet. This component typically summarizes the most important assumptions, such as room count, occupancy, average daily rate, casino revenue drivers, ancillary revenue assumptions, cost percentages, payroll structure, capital spending, and financing inputs. It also displays key outputs such as total revenue, EBITDA, net profit, cash balance, payback period, return on equity, and other headline metrics that matter to owners, lenders, and investors. For planning purposes, the dashboard is useful because it connects operating assumptions to financial outcomes in a format that is easy to review, update, and present. Users can quickly see whether the casino hotel is generating enough revenue to support its cost base, whether cash flow remains stable, and whether the project meets internal profitability or funding targets. For decision-making, it acts as a practical summary page that helps compare assumptions, identify weak points, and communicate the financial story of the business more clearly.
Low Base High Scenario Analysis
The low, base, and high scenario analysis section helps users test how the casino hotel could perform under different operating conditions. This is especially important for a capital-intensive business where small changes in occupancy, average daily rate, casino win, gaming volume, labor costs, or marketing effectiveness can have a major effect on profitability and cash flow. The low case may reflect slower ramp-up, weaker demand, lower guest spending, higher operating costs, or delays in reaching target occupancy. The base case can represent the expected plan, using realistic assumptions for room nights, gaming performance, food and beverage sales, and operating expenses. The high case can model stronger market demand, improved room pricing, higher casino participation, better cost control, or faster growth in ancillary revenue. This component helps generate comparative outputs for revenue, EBITDA, cash flow, profitability, funding needs, and return metrics across scenarios. It is useful for investors and lenders because it shows whether the business plan has been stress-tested rather than built around a single optimistic forecast. For management, it supports better budgeting, contingency planning, and performance target setting.
Professional Charts
The professional charts section converts the financial projections into presentation-ready visual reports that make the casino hotel forecast easier to understand. Casino hotel financial models can include a large number of assumptions and outputs, so charts are valuable for summarizing revenue growth, expense trends, EBITDA movement, cash flow, profit margins, debt service capacity, and other key performance indicators. This component may use the model’s monthly and annual projections to create visual comparisons of revenue streams, cost categories, profitability, cash balances, and scenario outcomes. For users preparing investor decks, lender discussions, board presentations, or internal planning meetings, these charts help translate detailed spreadsheet outputs into a clearer financial narrative. Instead of relying only on rows of numbers, users can show how room revenue grows as occupancy improves, how casino and ancillary income contribute to total sales, how capital expenditures affect cash flow, and how margins develop over time. The charts are especially useful for communicating trends, identifying periods of pressure, and supporting strategic decisions with visual evidence that stakeholders can quickly interpret.
ROE Components and DuPont Analysis
The ROE components section uses a DuPont-style analysis to help users understand what is driving return on equity within the Casino Hotel Financial Model. Return on equity can be influenced by several factors, including net profit margin, asset efficiency, and financial leverage, so this component breaks the metric into more useful parts rather than presenting it as a single final number. Inputs may include net income, total revenue, total assets, equity investment, debt financing, interest expense, and balance sheet assumptions. The outputs help show whether projected equity returns are mainly coming from strong operating profitability, efficient use of the property’s asset base, or the effect of leverage. This is important for a casino hotel because the business often requires significant upfront capital for gaming equipment, hotel furnishings, building systems, licenses, technology, and facility improvements. Investors and owners can use this analysis to evaluate whether the projected returns are sustainable, whether debt levels are creating excessive risk, and whether operational improvements could increase equity value. For funding and decision-making, it provides a deeper view of performance quality and helps users explain the financial mechanics behind investor returns.
Revenue Inputs
The revenue inputs section is the foundation of the Casino Hotel Financial Model because it captures the assumptions that drive sales across the property. Unlike a standard hotel model, this template is structured around multiple revenue categories, including room sales, casino win, food and beverage, spa services, event rentals, parking, retail, nightclub activity, and other guest spending. Room revenue can be modeled using assumptions for room types, weekday and weekend pricing, occupancy rates, available rooms, seasonality, and average daily rate growth. Casino revenue can be shaped by assumptions such as player volume, average gaming spend, hold or win rates, and the relationship between hotel traffic and gaming activity. Ancillary income can be estimated using guest volume, utilization rates, average spend per guest, or monthly sales assumptions. This component is useful because it gives users control over the commercial logic of the business, allowing them to tailor the forecast to a specific property concept, market positioning, room mix, service offering, and growth plan. Clear revenue inputs also make it easier to defend the forecast in a business plan or investor discussion, since users can show exactly how projected sales are being calculated.
Bank-Ready Reports
The bank-ready reports section organizes the financial outputs into a format suitable for lenders, investors, partners, and other financial stakeholders. Casino hotel projects often require significant financing, so users need more than a basic revenue forecast. This component typically includes structured financial statements such as the profit and loss statement, cash flow statement, and balance sheet, along with supporting schedules and key metrics that lenders review when evaluating repayment capacity and project risk. Inputs from the revenue forecast, operating expenses, payroll, startup costs, capital expenditures, financing assumptions, depreciation, and working capital flow into these reports automatically. The outputs help users review revenue, gross profit, EBITDA, operating income, net income, cash flow from operations, cash balances, assets, liabilities, and equity over the forecast period. This section is useful for loan applications, investor presentations, internal approvals, and professional business planning because it provides a more complete financial view than a simple sales estimate. It helps demonstrate whether the casino hotel can fund operations, service debt, manage liquidity, and produce returns that justify the initial investment.
Revenue Breakdown
The revenue breakdown section provides a detailed view of how each income stream contributes to the total casino hotel forecast. This is essential because an integrated resort can generate revenue from several different departments, and each department may have different margins, growth rates, seasonality, and operating risks. The section may separate room revenue by room type, such as standard rooms, deluxe rooms, suites, and penthouses, while also distinguishing between weekday and weekend pricing. It can also show casino revenue, food and beverage sales, event rentals, spa services, parking, retail, nightclub activity, and other guest services. The outputs help users see which revenue streams are most important, which are growing fastest, and which may need additional marketing or operational support. This component is useful for budgeting because management can evaluate whether the property is too dependent on one revenue source or whether ancillary departments are contributing enough to overall profitability. For investors, the revenue breakdown provides transparency and makes the forecast more credible by showing the detailed commercial assumptions behind top-line growth. It also supports decision-making around pricing, package design, amenity investment, and department-level performance goals.
KPI Dashboard
The KPI dashboard focuses on the performance metrics that matter most for managing and benchmarking a casino hotel. While the financial statements show the overall results, the KPI dashboard helps users track the operational drivers behind those results. Relevant hotel metrics may include occupancy rate, average daily rate, revenue per available room, room nights sold, total room revenue, guest spending, and ancillary revenue per occupied room. Gaming and resort metrics may include casino revenue, casino contribution to total revenue, departmental margins, EBITDA margin, cash flow trends, payback period, return on equity, and other investor-focused indicators. The dashboard can also help compare actual or projected performance against industry benchmarks and internal targets. This component is useful because it gives owners and managers a practical way to monitor whether the business is performing as expected, identify underperforming departments, and respond before financial issues become serious. For planning and stakeholder reporting, it presents key metrics in a concise format that supports operational review meetings, investor updates, lender reporting, and strategic decision-making.
Break-Even Analysis
The break-even analysis section helps users determine when the casino hotel is expected to cover its operating costs and begin generating profit. This component is particularly important because a casino hotel often has a high fixed cost base, including payroll, utilities, insurance, property maintenance, gaming compliance costs, marketing, security, technology, and administrative overhead. The analysis may use inputs such as average room rates, occupancy levels, casino revenue, guest spending, variable cost percentages, fixed operating expenses, payroll assumptions, and departmental margins. The outputs can show the revenue level, occupancy rate, or time period required to reach operating break-even, as well as the difference between operating break-even and full investment payback. This distinction is valuable because a property may cover monthly expenses early but still require years to recover major upfront capital expenditures. For entrepreneurs and investors, the break-even analysis helps evaluate whether the business model is realistic, how much revenue must be achieved to reduce financial risk, and which levers can accelerate profitability. It also supports pricing decisions, staffing plans, promotional strategy, pre-opening booking goals, and lender discussions about repayment timing.
Startup Costs and CapEx Planning
The startup costs and CapEx planning section organizes the initial investment required to develop, prepare, or upgrade a casino hotel before and during launch. A casino hotel typically requires substantial capital for gaming equipment, hotel room furnishings, building systems, HVAC upgrades, security systems, property renovations, technology, licenses, permits, professional fees, pre-opening payroll, launch marketing, deposits, and initial working capital. This component allows users to input major one-time costs, timing assumptions, and phased spending schedules so the model can calculate total funding needs and show how capital outflows affect cash balances. The outputs help users understand how much money must be raised before opening, when the largest cash requirements occur, and whether operating cash flow can eventually absorb the upfront investment. This section is useful for funding preparation because it provides a structured, itemized view of the launch budget rather than a single unsupported estimate. It also helps management avoid undercapitalization, compare development options, negotiate vendor payment schedules, and plan financing in a way that supports both construction or renovation needs and early operating liquidity.
File types:
Excel – Single-User: .xlsx
Excel – Multi-User: .xlsx
Similar ProductsOther customers were also interested in...





 Giorgos
Sky Diving Center – 5 Year Financial Model
Skydiving is the sport of jumping from an aircraft and performing acrobatic maneuvers in the air dur... Read more
Tour Operator Financial Model – 5 Year Finan...
Financial Model providing an advanced 5-year financial plan for a startup or operating Tour Operator... Read more
Theme Park & Hotel Financial Model (Construct...
Financial model presenting a development scenario for a Theme Park & Hotel project including con... Read more
Short Term Rentals (Airbnb) Financial Model –...
A short-term rental is a furnished living space available for short periods of time, from a few days... Read more
Golf & Entertainment Center – 5 Year Financi...
Financial Model providing an advanced 5-year financial plan for a startup or operating Golf & En... Read more
 HenrySheykin
Waterpark Business Plan Financial Model Excel Temp...
The Water Park Financial Model helps entrepreneurs, founders, consultants, analysts, and business ow... Read more
Floating hotel Financial Model Excel Template
The Hotel Financial Model helps users build a structured financial forecast for a hotel business usi... Read more
Private Island Financial Model Excel Template
The Luxury Private Island Financial Model helps users turn an exclusive resort, island rental, or hi... Read more
Beach Hotel Financial Model Excel Template
The Beach Resort Financial Model template helps entrepreneurs, resort owners, consultants, analysts,... Read more
Bed And Breakfast Financial Model Excel Template
The Bed and Breakfast Financial Model is a ready-to-use financial model template built to help entre... Read more
You must log in to submit a review.