
0 ITEMS

Concierge Service Financial Model Excel Template
The Concierge Service Financial Model helps entrepreneurs, founders, consultants, analysts, and business owners turn a personal assistant or luxury concierge service concept into a structured five-year financial forecast. Instead of building complex spreadsheets from scratch, users can start with a ready-to-use financial model template designed around the key drivers of a concierge service business, including recurring service tiers, customer acquisition, pricing, vendor costs, payroll, operating expenses, cash flow, profitability, and funding needs. This template is built for practical financial planning, business plan development, investor conversations, lender review, and internal decision-making. It allows users to enter their own revenue assumptions, adjust service packages, estimate startup costs, forecast monthly and annual operating expenses, and review how the business may perform as it scales. Whether the plan is focused on daily errand management, travel arrangement, event planning, premium membership bundles, or a broader lifestyle management service, the model gives users a clear framework for testing assumptions before committing capital. The Concierge Service Financial Model also helps users evaluate the financial impact of staffing plans, marketing budgets, customer acquisition costs, service fulfillment expenses, third-party vendor costs, and operational overhead. By connecting these inputs to automated financial statements and performance outputs, the template makes it easier to understand when the business may become profitable, how much cash may be required during early growth, and which assumptions have the greatest effect on margins and long-term results. Designed to be editable, presentation-ready, and compatible with Excel and Google Sheets, this financial model template supports both early-stage planning and expansion analysis. Users can review revenue growth, cash flow dynamics, profitability, break-even analysis, return metrics, and key performance indicators in one organized file. It is especially useful for entrepreneurs preparing funding documents, consultants supporting clients, operators refining budgets, and stakeholders who need a reliable financial planning tool for a concierge service business.
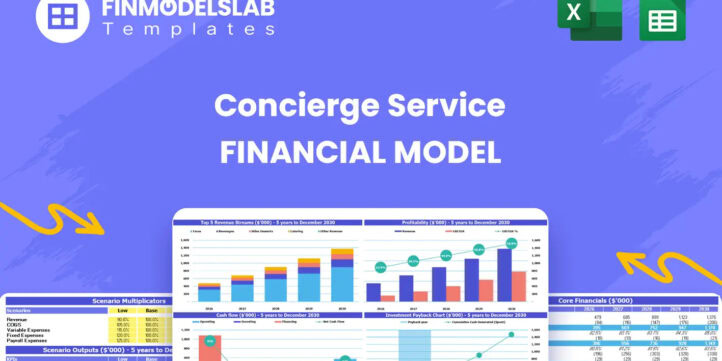


Financial Model Overview
The Concierge Service Financial Model is a ready-to-use financial model template designed to help entrepreneurs, founders, consultants, analysts, and business owners plan, evaluate, and present the financial potential of a concierge service business. A concierge service can include travel arrangement, event planning, daily errand management, premium lifestyle support, personal assistant services, and bundled membership packages, each with different pricing, fulfillment costs, staffing needs, and customer acquisition dynamics. This model brings those moving parts into one structured forecast so users can estimate revenue, startup investment, operating expenses, payroll, cash flow, profitability, investor returns, and funding requirements over a five-year period. By entering assumptions into the input areas, users can review automated outputs such as profit and loss, cash flow, balance sheet, break-even timing, payback period, IRR, ROE, charts, and KPI summaries. The result is a practical planning tool that supports business plans, investor discussions, bank submissions, internal budgeting, and strategic decision-making.
All-in-One Dashboard
The all-in-one dashboard gives users a central view of the most important inputs and outputs in the Concierge Service Financial Model. Instead of moving through disconnected worksheets to understand the business, users can review the core assumptions and financial results in one place, including revenue growth, profitability, cash balance, break-even timing, payback period, IRR, and other headline metrics. The dashboard is useful because a concierge service business depends on several drivers working together, such as service tier pricing, customer acquisition, monthly retention, vendor usage, staffing, marketing spend, and fixed overhead. When these assumptions are updated, the dashboard helps show how the changes affect the overall forecast. This makes the model easier to use for founders who are not financial experts, while still providing a concise summary for investors, lenders, advisors, and internal teams. It is especially valuable for quick reviews before meetings, funding conversations, or strategic planning sessions because it summarizes the financial story without requiring users to interpret every detailed schedule separately.
Low Base High Scenario Analysis
The Low Base High scenario analysis section allows users to test how the concierge service may perform under different business conditions. A base case can represent the most realistic operating plan, while the low case may reflect slower customer acquisition, higher marketing costs, lower retention, or weaker pricing power. The high case can be used to model stronger brand adoption, better conversion rates, premium service upsells, lower customer acquisition cost, or faster expansion. This component is useful because the performance of a concierge service business can change significantly based on client volume, subscription uptake, service mix, and fulfillment efficiency. By comparing scenarios, users can understand whether the business remains viable if growth is slower than expected or whether additional funding may be required during a more conservative path. The scenario framework also helps users prepare contingency plans, communicate risk clearly, and make better decisions about hiring, marketing budgets, pricing tiers, and launch timing. For investors and lenders, scenario analysis demonstrates that the plan has been tested beyond a single optimistic forecast.
Professional Charts
The professional charts component turns the financial forecast into clear visual outputs that are easier to review, explain, and present. The Concierge Service Financial Model can translate revenue, profit, cash flow, margin trends, cost categories, and growth indicators into presentation-ready charts that help users communicate the direction of the business. This is particularly helpful for a concierge service plan because stakeholders often need to see how early losses transition into scale, how revenue streams develop over time, and how cash burn changes as the customer base expands. Charts can make complex financial statements more understandable by showing trends across months and years rather than requiring readers to interpret rows of numbers. They are useful for pitch decks, lender meetings, partner discussions, board updates, and internal management reviews. A founder can use the charts to explain why upfront marketing investment is required, when operating leverage begins to improve margins, and how customer growth affects cash flow. The visual format also supports faster decision-making because users can identify issues or opportunities at a glance.
ROE Components and DuPont Analysis
The ROE components and DuPont analysis section helps users understand what is driving return on equity in the concierge service business. Rather than looking only at a final ROE percentage, this component breaks performance into the underlying factors that influence investor return, such as profitability, asset efficiency, and leverage. This is useful because a concierge service may require upfront investment in technology, office setup, staffing infrastructure, marketing, and working capital before it produces meaningful profits. DuPont-style analysis helps users see whether returns are being driven by stronger margins, improved operating efficiency, better use of invested capital, or changes in financing structure. Inputs may include net income, revenue, asset levels, equity funding, debt assumptions, and balance sheet projections. Outputs can support investor presentations, valuation discussions, and strategic reviews by showing whether the business is improving because of real operating performance or simply because of changes in capital structure. For founders, this section provides a more sophisticated view of financial performance and helps explain how long-term value may be created as the concierge service scales.
Revenue Inputs
The revenue inputs section is where users define the core assumptions that drive sales in the Concierge Service Financial Model. For a concierge service, revenue may come from multiple service tiers and recurring packages, such as travel arrangement, event planning, daily errand management, and premium bundled support. Users can adjust pricing, customer acquisition assumptions, marketing spend, customer acquisition cost, retention behavior, service mix, and growth rates to reflect their specific market and positioning. This component is important because revenue forecasts are only useful when they are connected to practical business drivers. For example, a luxury concierge service with higher monthly fees may require a larger marketing budget and longer sales cycle, while an errand management model may rely on higher volume and lower pricing. By documenting assumptions clearly, the model helps users understand how many clients must be acquired, how pricing affects total revenue, and how changes in demand influence the overall financial plan. It also helps investors and lenders evaluate whether the revenue plan is realistic, measurable, and tied to a defined go-to-market strategy.
Bank-Ready Reports
The bank-ready reports component organizes the financial outputs into a format suitable for lenders, credit reviewers, and other financing stakeholders. A concierge service may need external funding to cover technology development, mobile app development, office setup, launch marketing, payroll, vendor deposits, and working capital during the early months of operation. Lenders typically want to see structured financial statements, cash flow projections, profitability trends, debt service capacity, and assumptions that explain how the business will generate enough cash to repay financing. This section helps users present those outputs in a clean, professional way without building reporting schedules from scratch. It may include profit and loss summaries, balance sheet projections, cash flow forecasts, debt assumptions, and key repayment indicators. The benefit is that users can move from planning to presentation more efficiently, with reports that are easier for banks and advisors to review. For founders seeking loans, lines of credit, or other financing, the bank-ready reports help demonstrate preparation, financial discipline, and a clear understanding of the company’s expected cash requirements.
Revenue Breakdown
The revenue breakdown section gives users a more detailed view of how total income is generated across the concierge service’s different revenue streams. Instead of relying on one blended sales figure, the model can separate revenue by service category, tier, package, or membership type. This is especially useful for a concierge business because each revenue stream may have different pricing, demand patterns, margins, and operational requirements. Travel arrangement may involve different fulfillment costs than event planning, while daily errand management may require more staff time and premium bundles may create stronger recurring revenue. By reviewing revenue at a more detailed level, users can identify which services contribute the most to sales, which packages should receive more marketing support, and which offerings may need pricing adjustments. The outputs can help shape strategy around upselling, bundling, client segmentation, and resource allocation. This component is also useful for investor conversations because it shows that the forecast is not based on a generic sales estimate, but on a structured view of the actual services the business plans to sell.
KPI Dashboard
The KPI dashboard helps users monitor the operating and financial performance metrics that matter most for a concierge service business. Key performance indicators may include customer acquisition cost, customer growth, retention, revenue per client, gross margin, EBITDA, cash balance, burn rate, payback period, ROE, IRR, and other measures that connect day-to-day execution with financial outcomes. This component is valuable because a concierge service can appear to be growing while still facing pressure from high marketing spend, labor costs, vendor expenses, or inefficient service fulfillment. The KPI dashboard allows users to track whether the business is becoming more efficient as it scales and whether performance is aligned with the plan. It also supports benchmark comparisons by giving users a way to evaluate margins, growth rates, and acquisition economics against reasonable industry expectations. For management teams, the dashboard can guide decisions about pricing, hiring, marketing optimization, and service prioritization. For investors and stakeholders, it provides a concise way to understand the health of the business and the quality of the forecast.
Startup Cost Breakdown
The startup cost breakdown section helps users estimate the initial investment required to launch or prepare the concierge service for operations. A concierge business may require spending before revenue begins, including technology platform development, mobile app development, office setup and furnishings, licenses, branding, website development, initial marketing campaigns, software subscriptions, recruitment, training, legal setup, insurance, and working capital reserves. This component allows users to organize one-time launch costs separately from recurring operating expenses, which is important for understanding true funding needs. It helps prevent the common mistake of underestimating the capital required to open the business, acquire the first clients, and operate through the early cash burn period. Outputs from this section can feed into the cash flow forecast, balance sheet, funding plan, and payback analysis. For entrepreneurs preparing a business plan or funding request, the startup cost breakdown provides a clear explanation of how much money is needed, what it will be used for, and why the investment is necessary before the business can reach stable operations.
Break-Even and Payback Analysis
The break-even and payback analysis section helps users understand when the concierge service is expected to cover its costs and when invested capital may be recovered. Break-even analysis compares revenue against fixed and variable costs to estimate the point where the business stops operating at a loss and begins generating profit. For a concierge service, this depends on client volume, pricing tiers, vendor costs, service fulfillment expenses, payroll, marketing spend, and overhead. Payback analysis extends this view by estimating how long it may take to recover the initial investment or funding contributed to the business. These outputs are important for founders, investors, and lenders because they show the timeline to financial sustainability. Users can test how pricing changes, higher premium bundle adoption, improved retention, lower customer acquisition cost, or reduced overhead may accelerate break-even. This section is also useful for risk management because it highlights how much runway may be required before the business becomes self-supporting. By making break-even timing and payback period visible, the model supports better funding planning and more realistic expectations.
File types:
Excel – Single-User: .xlsx
Excel – Multi-User: .xlsx
Similar ProductsOther customers were also interested in...


 HenrySheykin
Car Rental Financial Model Excel Template
The Car Rental Financial Model helps entrepreneurs, founders, business owners, consultants, and anal... Read more
Limousine Taxi Financial Model Excel Template
The Limousine Service Financial Model helps entrepreneurs, operators, consultants, analysts, and fou... Read more

 eFinancialModels
Car Rental Business Financial Model
This Car Rental Business Financial Model Template in Excel offers an ideal basis for developing a bu... Read more

 Pushkar
Online Car Rental – 3 Statement Financial Mo...
Online Car Rental Platform Business Plan Model is a perfect tool for a feasibility study on launchin... Read more
Freight Brokerage Financial Model Excel Template
The Freight Brokerage Financial Model Financial Model Template helps entrepreneurs, founders, busine... Read more

Ambulance Service Financial Model Excel Template
The Ambulance Service Financial Model is a ready-to-use financial model template designed to help en... Read more
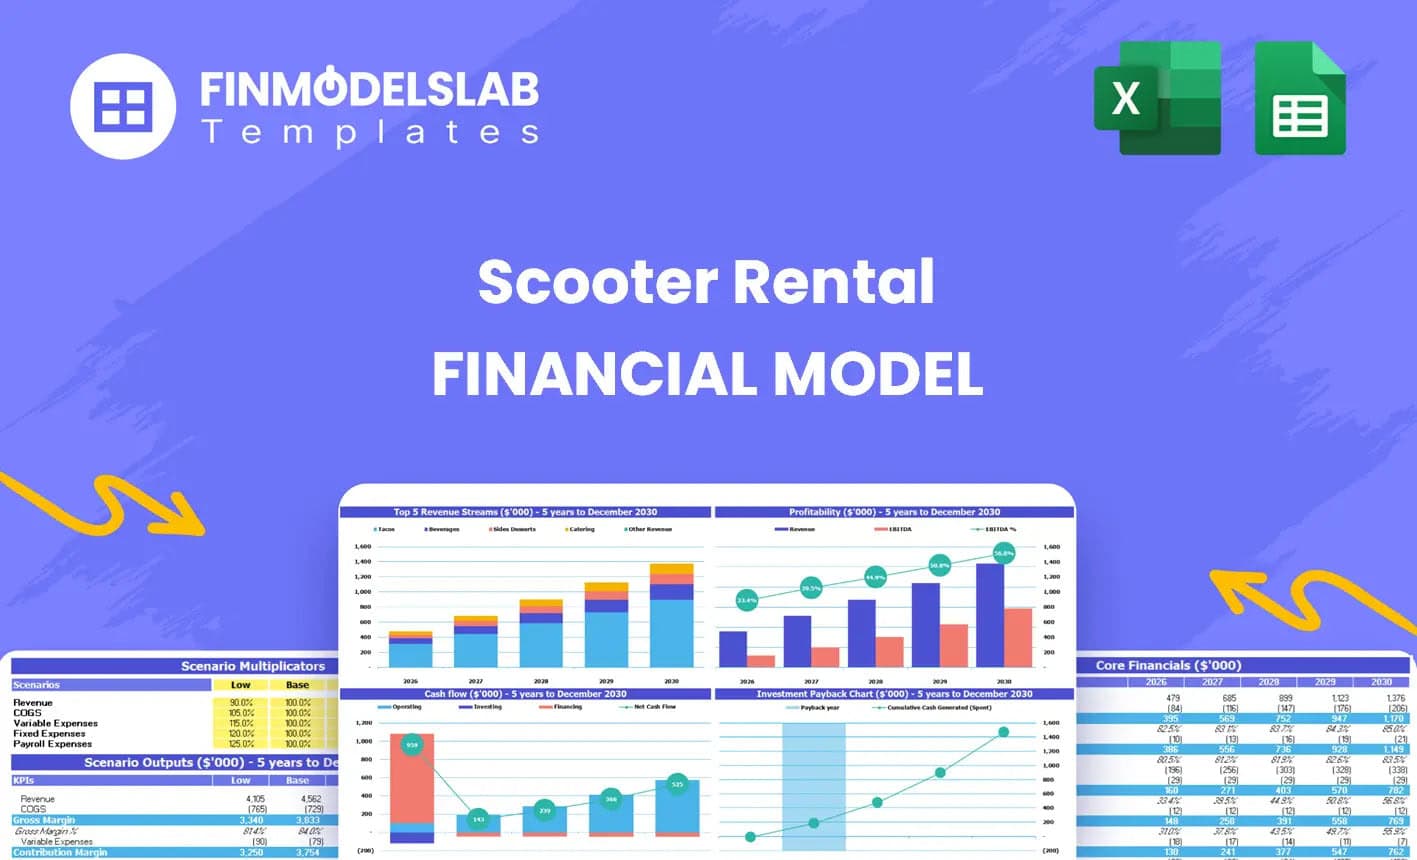
Mopeds Rental Financial Model Excel Template
The Scooter Rental Financial Model helps users turn a shared mobility or electric scooter rental con... Read more

Helicopter Taxi Financial Model Excel Template
The Helicopter Transportation Financial Model helps entrepreneurs, founders, operators, consultants,... Read more

 Giorgos
Driving School – 5 Year Financial Model
Financial Model providing an advanced 5-year financial plan for a startup or operating Driving Schoo... Read more

Crane Rental Company Financial Model
Dive into the financial planning of your Crane Rental Company with our comprehensive 10-year monthly... Read more
You must log in to submit a review.