
0 ITEMS

Cotton Growing Financial Model Excel Template
The Cotton Farming Financial Model Financial Model Template helps entrepreneurs, farm owners, consultants, analysts, and business planners turn a cotton farming concept into a structured financial forecast. Instead of relying on rough estimates, users can build a practical projection that connects cultivated hectares, cotton varieties, yield assumptions, pricing, harvest timing, startup costs, operating expenses, payroll, and cash flow. The template is designed to support both early-stage feasibility planning and more developed funding conversations, giving users a clearer view of what it may take to launch, operate, and grow a cotton farming operation. This template is especially useful for people preparing business plans, loan applications, investor presentations, internal budgets, or expansion proposals. Cotton farming can require significant upfront investment in land, equipment, irrigation, infrastructure, labor, and working capital before revenue is realized from harvest cycles. The model helps users organize these moving parts into a forecast that shows how revenue assumptions flow through to gross profit, EBITDA, net income, cash balance, and long-term profitability. It also supports better decision-making by helping users test whether expected yields, selling prices, acreage allocation, and cost controls are strong enough to support the farm’s financial goals. The Cotton Farming Financial Model is built for practical financial planning and is fully editable for different farm sizes, crop mixes, land ownership structures, leasing strategies, and operating assumptions. Users can adapt the model for a startup cotton farm, an existing farm preparing for expansion, or a feasibility study comparing different operating scenarios. It brings together revenue modeling, payroll planning, operating expenses, cash flow forecasting, profitability analysis, break-even analysis, and investor-ready outputs in one organized file, reducing the time needed to build a model from scratch. By using a ready-made financial model template, buyers can focus more on strategy and less on spreadsheet setup. The model helps clarify startup funding needs, monthly cash requirements, seasonal revenue timing, and the path to profitability. It is suitable for business owners who need a working forecast, consultants building client deliverables, founders seeking funding, or analysts evaluating the financial viability of a cotton farming project. With structured assumptions, automated calculations, and presentation-friendly outputs, it provides a useful foundation for planning, budgeting, funding discussions, and confident decision-making.
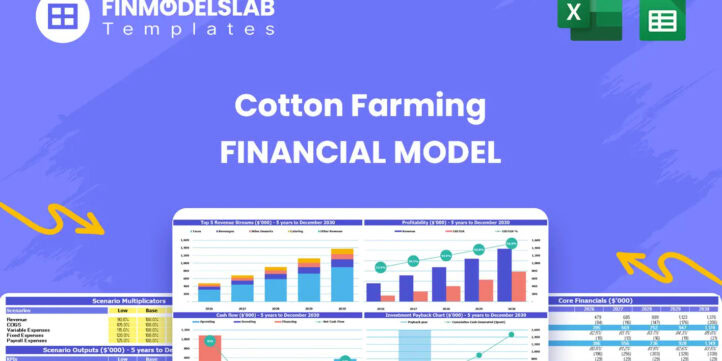


Financial Model Overview
The Cotton Farming Financial Model Financial Model Template is a ready-to-use planning tool built for evaluating the financial potential of a cotton farming operation. It helps users translate farm-level assumptions into a structured forecast covering cultivated area, crop mix, yields, selling prices, startup investment, operating expenses, payroll, cash flow, profitability, and long-term returns. Cotton farming often involves large upfront capital requirements, seasonal revenue timing, weather and yield risk, equipment needs, irrigation planning, and working capital pressure before harvest income arrives. This template gives entrepreneurs, farm owners, consultants, analysts, and funding applicants a practical framework for organizing those assumptions and understanding how the business may perform over time. Instead of starting from a blank spreadsheet, users can work from an editable model designed around the economics of a cotton farm, making it easier to prepare business plans, lender materials, investor presentations, feasibility studies, and internal budgets.
All-in-One Dashboard
The all-in-one dashboard brings the most important model inputs and outputs into a centralized view so users can quickly understand the overall financial position of the cotton farming project. This section may summarize assumptions such as cultivated hectares, land ownership and leasing mix, cotton variety allocation, yield expectations, selling prices, operating cost ratios, payroll, capital expenditure, and financing needs. It then connects these assumptions to key outputs such as revenue, gross profit, EBITDA, net income, cash balance, return metrics, and funding requirements. For a cotton farm, this is especially useful because major decisions often depend on several linked variables at once, including acreage, yield loss, harvest timing, and cost per hectare. The dashboard helps users avoid getting lost in individual worksheets by providing a top-level view of the forecast, making it easier to review the model before a meeting, compare plan versions, and communicate the farm’s financial outlook to investors, lenders, partners, or internal stakeholders.
Low, Base, and High Scenario Analysis
The low, base, and high scenario analysis section helps users evaluate how the cotton farming business could perform under different operating and market conditions. A base case may reflect the most realistic plan, while a low case can show the impact of lower yields, weaker selling prices, delayed harvest income, higher input costs, or slower acreage expansion. A high case may test stronger yields, better cotton prices, improved land utilization, greater efficiency, or faster revenue growth. This type of scenario setup is valuable for agricultural planning because cotton farming is exposed to variables that are not fully within the owner’s control, including weather, pests, water availability, commodity pricing, logistics costs, and seasonal timing. By comparing multiple outcomes, users can understand the range of potential cash flow, profitability, and funding needs before committing capital. It also strengthens business planning and funding discussions because lenders and investors often want to see how resilient the farm remains if assumptions change.
Professional Charts
The professional charts section converts the model’s financial outputs into presentation-ready visuals that make complex cotton farming projections easier to understand. These charts may display revenue growth, cost structure, EBITDA trends, cash balance movement, capital expenditure timing, profitability margins, return metrics, and other key financial outputs over the forecast period. For a capital-intensive agricultural business, visual reporting is helpful because stakeholders often need to see the timing of investment, the cash trough before harvest revenue, the ramp-up in cultivated acreage, and the progression toward profitability. Charts can also make it easier to compare scenarios, identify seasonal pressure points, and explain how operational changes affect the farm’s financial performance. This section is useful for business plan presentations, loan packages, investor meetings, board updates, and internal reviews because it turns spreadsheet results into clear financial visuals. Users can rely on the charts to communicate the story behind the numbers without rebuilding presentation materials manually.
ROE Components and DuPont Analysis
The ROE components and DuPont analysis section helps users understand what is driving return on equity in the cotton farming business. Rather than viewing return on equity as a single final percentage, this component breaks performance into underlying drivers such as profitability, asset efficiency, and leverage. For a cotton farm, this matters because returns can be influenced by net margins, equipment productivity, land investment, working capital requirements, debt levels, and how effectively assets are converted into revenue. The section may use inputs from the income statement, balance sheet, and financing assumptions to show how operating performance and capital structure combine to create shareholder returns. This is useful for founders, farm owners, and investors who want to understand whether returns are coming from strong farm economics, efficient asset use, or increased leverage. It also helps with strategic decision-making, such as whether to buy more land, lease acreage instead, invest in equipment, improve yield efficiency, or adjust financing assumptions.
Revenue Inputs
The revenue inputs section is where users define the core commercial assumptions that drive the cotton farming forecast. This component may include cultivated hectares, crop allocation by cotton type, expected yield per hectare, yield loss percentage, selling price per kilogram, harvest calendar, sales timing, and revenue contribution from different varieties or byproducts. In a cotton farming model, revenue cannot be treated as a simple monthly sales estimate because production depends on acreage, agronomic performance, seasonal cycles, and commodity pricing. By structuring the revenue inputs around real operational drivers, the model allows users to create a more defensible top-line forecast. For example, changing the hectares allocated to standard upland cotton, adjusting the expected yield, or modifying selling prices can automatically flow through to revenue and profitability. This section is essential for feasibility planning, funding documents, and internal decision-making because it shows exactly how field-level assumptions become financial outcomes.
Bank-Ready Reports
The bank-ready reports section organizes financial outputs in a format that can support lender reviews, loan applications, and formal business planning. This component may include projected profit and loss statements, cash flow statements, balance sheets, summaries of funding requirements, debt assumptions, repayment capacity, margins, and key financial ratios. For a cotton farming operation, lenders typically want to understand the timing of capital expenditure, the amount of working capital required before harvest income, the farm’s ability to service debt, and whether projected cash flow is strong enough to withstand seasonal fluctuations. Bank-ready reporting helps users present these details in a structured and professional way. It also improves transparency because assumptions are documented and linked to forecasted statements rather than presented as unsupported estimates. This makes the template useful for entrepreneurs seeking agricultural loans, existing farms planning expansion financing, consultants preparing client submissions, or analysts reviewing the credit profile of a cotton farming project.
Revenue Breakdown
The revenue breakdown section gives users a more detailed view of where sales are expected to come from across the cotton farming operation. Instead of showing only total revenue, this component can separate income by crop variety, acreage allocation, yield profile, selling price, harvest cycle, or revenue stream. A farm that produces multiple cotton categories, such as premium long-staple cotton and standard upland cotton, may have different yield assumptions, price points, and revenue timing for each category. This section helps users identify which parts of the operation contribute most to total sales and which assumptions have the greatest impact on results. It is useful for planning crop mix, evaluating land allocation, negotiating sales contracts, assessing price sensitivity, and explaining revenue logic to investors or lenders. A detailed revenue breakdown also supports better operational decisions because it highlights how changes in hectares, yield losses, pricing, or harvest schedules can affect annual revenue and cash flow.
KPI Dashboard
The KPI dashboard focuses on performance metrics that help users monitor the financial and operational health of the cotton farming business. Key performance indicators may include revenue per hectare, yield per hectare, gross margin, EBITDA margin, operating expense ratio, cash balance, payback period, return on equity, internal rate of return, and cost efficiency measures. For a cotton farm, KPIs are important because management decisions depend on more than total revenue or net profit alone. A farm may generate strong sales but still face pressure from high input costs, inefficient equipment utilization, excessive overhead, or cash flow gaps between planting and harvest. The KPI dashboard helps users track whether the business is moving toward sustainable profitability and whether assumptions remain realistic as the farm grows. It is also useful for benchmarking performance, reviewing scenarios, preparing stakeholder updates, and identifying areas that may need operational improvement, such as yield management, cost control, pricing strategy, or working capital planning.
Startup Costs and Capital Expenditure Planning
The startup costs and capital expenditure planning section helps users estimate the initial investment required to prepare the cotton farm for operations. This component may include land purchases, lease deposits, tractors, harvesting equipment, irrigation systems, storage facilities, farm infrastructure, vehicles, technology, licenses, professional fees, initial marketing, and pre-operating working capital. Cotton farming is typically capital-intensive, so understanding startup costs is critical before approaching lenders, investors, or partners. The section helps users separate one-time launch expenses from ongoing operating costs, making it easier to calculate the total funding needed before the farm begins generating revenue. It also supports decisions about whether to buy or lease land and equipment, phase investments over time, or adjust the launch scale to reduce cash pressure. By linking capital expenditure assumptions to depreciation, cash flow, and balance sheet outputs, the model provides a clearer view of how upfront investment affects long-term profitability and funding requirements.
Break-Even Analysis
The break-even analysis section helps users determine when the cotton farming business may begin covering its costs and generating profit. This component uses revenue assumptions, cost of goods sold, variable costs, fixed overhead, payroll, and other operating expenses to estimate the revenue level, production volume, or time period required to break even. For a cotton farm, break-even analysis is especially valuable because cash outflows often occur months before major harvest income is received. Users can evaluate how changes in yield per hectare, selling price, cost of inputs, land leasing expenses, or payroll affect the break-even point. This helps set realistic production targets, assess funding needs, and understand how much working capital may be required during the early months of operation. It also supports decision-making by showing whether the farm’s planned cost structure is sustainable under expected sales conditions. For funding discussions, break-even analysis gives stakeholders a clear view of the path to profitability and the key assumptions that must be achieved.
File types:
Excel – Single-User: .xlsx
Excel – Multi-User: .xlsx
Similar ProductsOther customers were also interested in...


 HenrySheykin
Fruits Farming Financial Model Excel Template
The Fruit Farming Financial Model helps users turn a fruit farm concept, orchard expansion, or agric... Read more
Vegetable Farming Financial Model Excel Template
The Vegetable Farming Financial Model helps users turn a farming concept, expansion plan, or funding... Read more

Organic Gardening Financial Model Excel Template
The Gardening Service Financial Model helps users turn a lawn care, garden maintenance, or horticult... Read more
Mushrooms Farming Financial Model Excel Template
The Mushroom Farming Financial Model helps entrepreneurs, growers, business owners, consultants, and... Read more
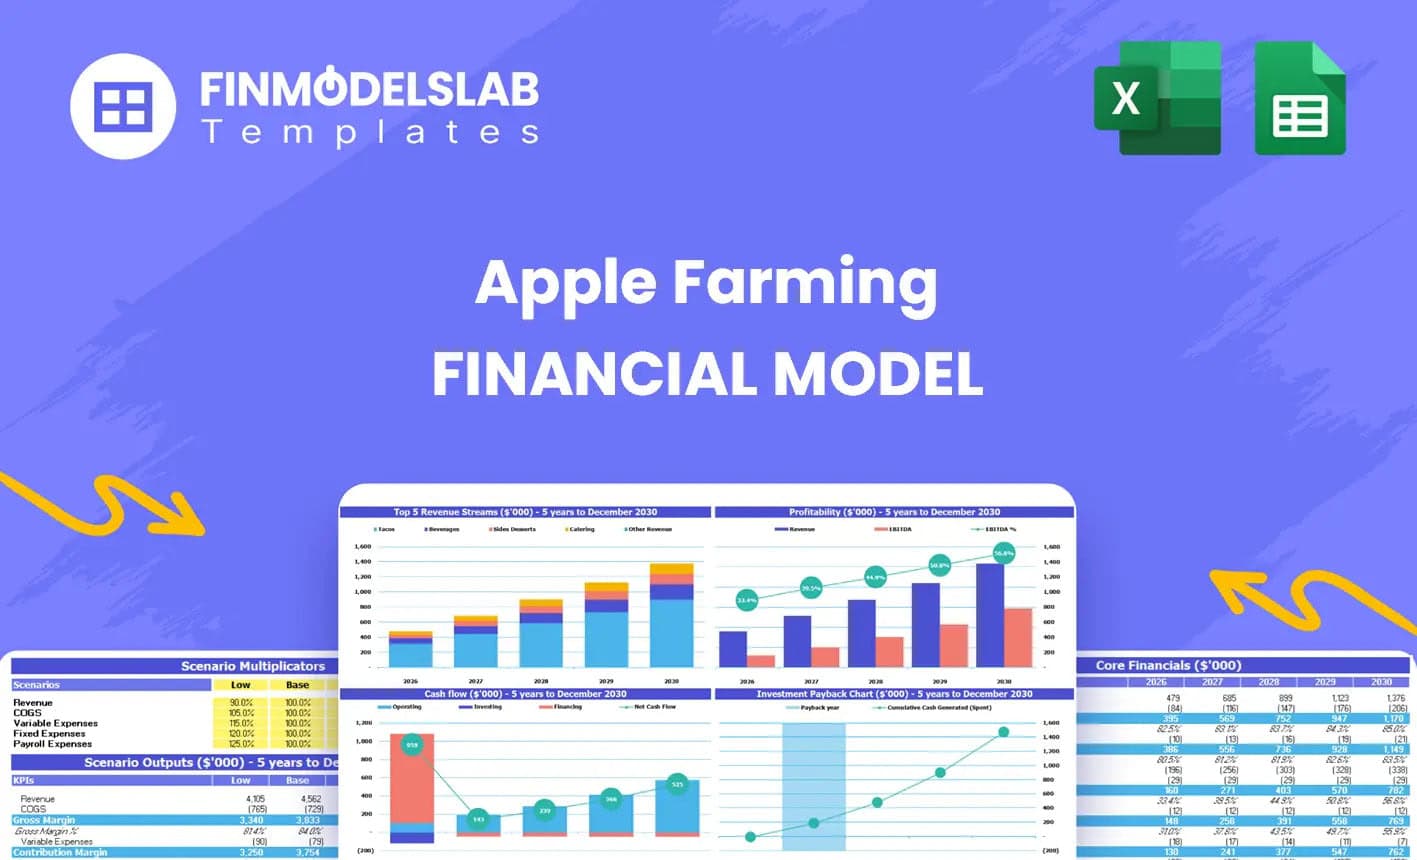
Apple Farming Financial Model Excel Template
The Apple Farming Financial Model helps users turn an orchard business plan into a structured, edita... Read more
 Andreas
Olive Orchard Business – DCF 10-Year Financi...
The Olive Orchard Financial Model is a comprehensive tool tailored to analyze the financial aspects ... Read more
 Giorgos
Greenhouse Financial Model – Dynamic 10 Year For...
If you want to start a Greenhouse from scratch or you need a sample Greenhouse business plan templat... Read more
 eFinancialModels
Pecan Tree Growing Financial Model
“Is Pecan Farming Profitable?” In our Pecan Tree Growing Financial model, we aim to answer that ... Read more
Avocado Farm Financial Model
Our Excel financial model template for avocado farming is the perfect tool for investors and entrepr... Read more
Fruit Processing Facility – 10 Year Financia...
Financial Model providing a dynamic up to 10-year financial forecast for a startup Fruit Processing ... Read more
You must log in to submit a review.