
0 ITEMS

Ophthalmology Financial Model Excel Template
The Ophthalmology Clinic Financial Model is a ready-to-use financial model template designed to help founders, clinic owners, consultants, analysts, and business planning teams build a structured forecast for an eye care practice. Instead of relying on a generic clinic spreadsheet, this model is built around the real operating drivers of an ophthalmology clinic, including patient visits, practitioner capacity, consultation revenue, surgical procedures, optometrist services, retina and glaucoma treatments, medical supplies, pharmaceuticals, staffing, rent, equipment, and working capital needs. This template supports financial planning from launch through growth by helping users organize revenue assumptions, startup costs, operating expenses, payroll, cash flow, profitability, and break-even analysis in one connected model. It can be used for a new ophthalmology clinic, an expanding eye care practice, a medical office business plan, a lender package, an investor presentation, or an internal budgeting process. Users can adjust patient volumes, utilization rates, pricing, procedure mix, staffing levels, salaries, equipment purchases, fixed overhead, direct costs, and funding assumptions to reflect their own location, market, and service strategy. The model is designed to make decision-making easier by translating clinic operations into projected financial results. It helps users understand how many patients and procedures may be required to cover costs, how quickly the clinic may reach profitability, how much startup capital may be needed, and where cash flow pressure may appear during the first months of operation. With built-in forecasts and investor-ready outputs, it helps users compare scenarios, evaluate risks, and communicate the financial story of the clinic more clearly to partners, lenders, investors, or internal stakeholders. Because the Ophthalmology Clinic Financial Model is editable and compatible with Excel and Google Sheets, users can tailor the assumptions without building a forecast from scratch. The template brings together dashboards, scenario planning, revenue modeling, reports, charts, KPI tracking, startup cost planning, and break-even analysis so users can move from concept to a more complete financial plan faster. It is especially useful for anyone who needs a practical, organized, and professional tool to assess whether an ophthalmology clinic can become financially sustainable under realistic assumptions.
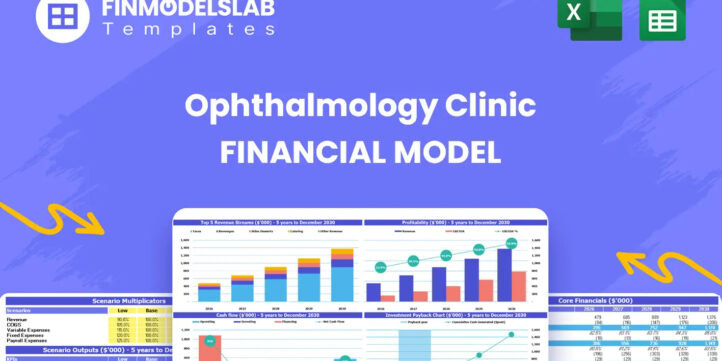


Financial Model Overview
The Ophthalmology Clinic Financial Model is a practical financial model template built for planning, launching, funding, and managing an eye care clinic. It gives entrepreneurs, clinic operators, consultants, analysts, and business planning teams a structured way to convert operational assumptions into financial projections. Ophthalmology clinics have unique economics because revenue is often driven by a mix of consultations, optometrist visits, diagnostic services, specialist treatments, and high-value procedures, while costs may include advanced medical equipment, facility build-out, clinical staff, medical supplies, pharmaceuticals, insurance, rent, and administrative overhead. This template helps users bring those drivers together in one editable model so they can forecast revenue, expenses, cash flow, profitability, startup investment, and funding needs. It is designed for business plans, investor discussions, bank financing, internal budgeting, expansion planning, and management decision-making. Instead of starting with a blank spreadsheet, users can work from an organized framework with customizable assumptions, automated calculations, visual outputs, and five-year projections that can be adapted to a specific clinic concept, market, staffing plan, and service mix.
All-in-one Dashboard
The all-in-one dashboard gives users a centralized view of the most important inputs and outputs in the Ophthalmology Clinic Financial Model. It is designed to help users move quickly from assumptions to results by displaying the core financial drivers and key forecast outputs in one place. Typical inputs may include patient volume, practitioner capacity, utilization rates, service pricing, procedure mix, cost assumptions, payroll, startup investment, and operating overhead. The dashboard then helps summarize outputs such as total revenue, gross profit, EBITDA, net income, cash position, payback timing, funding gaps, and return metrics. This is useful because ophthalmology clinic planning involves many moving parts, and decision-makers need a fast way to see how changes in assumptions affect the overall business case. A founder can test a revised service price, a consultant can review whether patient volume supports the payroll plan, and an analyst can evaluate whether cash reserves remain adequate during the launch period. The dashboard also supports presentations because it reduces the need to search through multiple sheets when discussing the clinic’s financial outlook with investors, lenders, partners, or internal stakeholders. By combining core inputs and core outputs, this section helps users understand the financial model as a complete operating system rather than a collection of disconnected calculations.
Low/Base/High Scenario Analysis
The Low/Base/High scenario analysis section helps users evaluate how the ophthalmology clinic may perform under different operating conditions. A financial plan should not depend on a single fixed forecast, especially for a medical practice where patient acquisition, referral relationships, reimbursement timing, procedure demand, staffing efficiency, and utilization rates can vary. This component allows users to compare a conservative case, a realistic base case, and an upside case by adjusting key assumptions such as monthly patient visits, practitioner productivity, treatment capacity, pricing, direct costs, payroll, rent, and capital spending. The outputs help show how each scenario affects revenue, gross margin, EBITDA, net income, cash flow, and funding needs. This is particularly useful for risk management because it helps users identify whether the clinic remains viable if patient demand ramps up more slowly than expected or if reimbursement rates and procedure mix are less favorable. It also supports strategic decision-making by showing what must happen to reach stretch targets in a high case. For funding preparation, scenario analysis demonstrates that the plan has been stress-tested and that management understands the range of possible financial outcomes. A lender or investor can see whether the clinic has enough working capital to handle a low case, while founders can use the base case as the main operating plan and the high case as a growth roadmap.
Professional Charts
The professional charts section turns the financial projections into clear visual reports that are easier to interpret and present. Ophthalmology clinic forecasts can contain detailed monthly and annual data, but stakeholders often need charts to quickly understand the trajectory of the business. This component may visualize revenue growth, service mix, gross profit, operating expenses, EBITDA, net income, cash balance, cumulative cash flow, funding requirement, payback timing, and other key metrics. The charts are useful for presenting the clinic’s financial story in meetings, business plans, pitch decks, bank packages, and management reviews. Instead of forcing users to manually create visuals from spreadsheet data, the model provides presentation-ready outputs connected to the underlying assumptions. When users update patient volume, pricing, costs, or staffing assumptions, the charts can reflect the revised forecast and make the impact easier to communicate. This is especially important for an ophthalmology clinic because the business may require significant upfront investment in diagnostic imaging equipment, surgical lasers, facility improvements, and specialized staff, so visualizing the relationship between investment, growth, and profitability helps clarify the business case. Professional charts also make it easier to compare performance across years, spot cash flow pressure, explain revenue concentration by service line, and show how the clinic scales as practitioner utilization improves. For non-financial audiences, these visuals can make complex projections more accessible and improve confidence in the planning process.
ROE Components
The ROE components section uses a DuPont-style analysis to help users understand what is driving return on equity in the ophthalmology clinic forecast. Return on equity is an important investor and owner metric because it connects profitability, asset efficiency, and financial structure. Instead of showing ROE as a single isolated percentage, this component breaks it into meaningful drivers that can be analyzed and improved. Inputs and calculations may include net income, revenue, total assets, equity, profit margin, asset turnover, and leverage assumptions. The outputs help users see whether returns are being driven primarily by operating profitability, efficient use of assets, or the clinic’s capital structure. This is useful for an ophthalmology clinic because asset intensity can be high due to specialized equipment, surgical technology, diagnostic tools, leasehold improvements, and other capital expenditures. A clinic may show strong revenue growth but still produce weaker returns if assets are underutilized or if margins are compressed by supplies, pharmaceuticals, payroll, or rent. This section helps users evaluate whether the business is generating adequate returns relative to the capital invested. It can also support investor conversations by explaining how operational improvements, such as higher practitioner utilization, stronger procedure mix, better cost control, or improved patient throughput, may translate into better equity returns. For owners and managers, the ROE analysis provides a deeper view of financial performance beyond simple profit and loss results.
Revenue Inputs
The revenue inputs section is one of the most important parts of the Ophthalmology Clinic Financial Model because it translates clinic operations into projected income. Revenue in an ophthalmology practice is usually driven by a combination of practitioner count, monthly treatment capacity, utilization rates, appointment volume, patient demand, service pricing, procedure mix, and specialist availability. This section may include editable assumptions for ophthalmologist consultations, ophthalmic surgeries, optometrist services, retina treatments, glaucoma treatments, diagnostic services, or other revenue lines relevant to the clinic. Users can adjust price per service, expected monthly volume, ramp-up timing, practitioner productivity, and utilization to match their market and operating plan. The output is a revenue forecast that reflects how the clinic actually generates income rather than relying on a generic top-down estimate. This is useful for planning because it helps users identify the operational requirements behind the numbers. For example, if the revenue target depends heavily on high-value surgical procedures, the user can test whether the required volume is realistic given practitioner availability, equipment capacity, referral flow, and patient demand. If revenue depends on high-volume optometrist visits, the model can help assess whether staffing and scheduling are sufficient. This component also supports pricing decisions, service mix planning, investor discussions, and sensitivity testing because it clearly connects assumptions to revenue outcomes.
Bank-Ready Reports
The bank-ready reports section organizes the financial outputs in a format suitable for lenders, financing partners, investors, and professional stakeholders. Ophthalmology clinics may require substantial startup capital, especially when purchasing surgical lasers, diagnostic imaging equipment, microscopes, exam rooms, technology systems, and facility renovations. Lenders and funding partners typically want to see clear projections that explain how the business will generate revenue, cover expenses, service debt, maintain liquidity, and reach profitability. This component helps produce structured reports such as profit and loss projections, cash flow forecasts, balance sheet summaries, operating expense schedules, startup cost summaries, debt assumptions, and key financial metrics. The value of this section is that it turns the forecast into a more polished and reviewable package rather than leaving users with raw calculations. A bank can more easily evaluate repayment capacity when revenue, EBITDA, net income, cash flow, and capital requirements are presented clearly. Founders can also use these reports to support loan applications, investor updates, board discussions, and business plan submissions. Since the model is editable, users can align the reports with their specific financing structure, whether that includes owner equity, bank debt, equipment financing, leases, working capital facilities, or investor capital. This makes the Ophthalmology Clinic Financial Model useful not only for internal planning but also for external funding conversations.
Revenue Breakdown
The revenue breakdown section provides a detailed view of the clinic’s revenue streams so users can understand exactly where income is expected to come from. Ophthalmology practices often depend on a blend of lower-priced, higher-volume services and higher-priced, lower-volume procedures. A simple total revenue line does not show whether the business is being driven by consultations, surgeries, optometrist visits, retina treatments, glaucoma care, diagnostics, or other clinical services. This component helps separate revenue by stream, allowing users to analyze pricing, volume, utilization, and contribution across each service category. The outputs may show monthly and annual revenue by service line, percentage contribution to total revenue, growth by segment, and the impact of changes in procedure mix. This is valuable because service mix can strongly influence profitability, staffing needs, equipment utilization, and marketing strategy. A clinic with a higher share of surgical revenue may require different capital investment and scheduling capacity than a clinic focused mainly on consultations and routine eye care. A clinic expanding specialist treatments may need to evaluate whether the additional revenue justifies the added payroll, supplies, or equipment costs. The revenue breakdown also supports decision-making by helping users identify which services deserve more focus, which assumptions need validation, and where the business may be exposed to concentration risk. For investors and lenders, a detailed revenue view adds credibility because it shows that the forecast is built from operational drivers rather than broad revenue estimates.
KPI Dashboard
The KPI dashboard provides a focused view of performance metrics that help users monitor the financial and operational health of the ophthalmology clinic. While financial statements show the overall results, key performance indicators help explain why those results are happening. This section may track metrics such as revenue per practitioner, patient volume, utilization rate, average revenue per visit, gross margin, EBITDA margin, payroll as a percentage of revenue, supplies and pharmaceuticals as a percentage of revenue, cash balance, burn rate, payback period, return on equity, and other clinic-specific benchmarks. The dashboard is useful because it supports faster decision-making and performance management. If revenue is below plan, users can review whether the issue is patient volume, utilization, pricing, or service mix. If profit margins are weaker than expected, users can examine staffing levels, supply costs, rent, or overhead. If cash flow is tight, users can monitor burn rate, collections timing, and working capital requirements. The KPI dashboard can also support benchmarking by helping users compare projected performance against industry norms or internal targets. This makes it valuable for founders preparing a business plan, operators managing an existing practice, consultants advising clients, and investors evaluating the clinic’s financial discipline. By summarizing operational and financial metrics in one place, this component helps transform the model from a static forecast into a management tool that can guide ongoing planning.
Startup Cost Breakdown
The startup cost breakdown section helps users estimate the initial investment required to open or expand an ophthalmology clinic before revenue begins. This is especially important for eye care practices because the upfront capital requirement can be significant. The model can organize costs such as advanced surgical lasers, diagnostic imaging equipment, surgical microscopes, exam equipment, facility build-out, renovation, medical technology systems, furniture, licensing, deposits, initial marketing, professional fees, insurance setup, training, and opening working capital. Users can customize each line item to reflect their clinic size, service offering, location, and purchasing strategy. The outputs help calculate the total launch budget, timing of cash outflows, and funding requirement.
Similar ProductsOther customers were also interested in...

 HenrySheykin
Medical Practice Financial Model Excel Template
The Medical Practice Financial Model helps users turn a clinic concept, expansion plan, or healthcar... Read more
Urgent Care Center Financial Model Excel Template
The Urgent Care Center Financial Model helps users turn a walk-in clinic concept into a structured f... Read more

Physiotherapy Financial Model Excel Template
The Physiotherapy Clinic Financial Model helps founders, clinic owners, consultants, analysts, and b... Read more
Outpatient Clinic Financial Model Excel Template
The Outpatient Clinic Financial Model helps users turn a clinic business concept into a structured, ... Read more

Gynecology Financial Model Excel Template
The Gynecology Clinic Financial Model Financial Model Template helps entrepreneurs, clinic founders,... Read more
Clinic Financial Model Excel Template
The Healthcare Clinic Financial Model helps founders, clinic owners, consultants, analysts, and busi... Read more
Dental Practice Financial Model Excel Template
The Dental Clinic Financial Model helps users turn a dental practice concept, launch plan, or expans... Read more

Nutritionist Financial Model Excel Template
The Nutritionist Financial Model Financial Model Template helps turn a nutrition practice, dietitian... Read more
Dialysis Center Financial Model Excel Template
The Hemodialysis Center Financial Model helps users evaluate the financial feasibility of launching,... Read more

Veterinary Financial Model Excel Template
The Veterinary Clinic Financial Model Financial Model Template helps entrepreneurs, clinic owners, c... Read more
You must log in to submit a review.