0 ITEMS

The AVERAGE Function in Excel calculates the Arithmetic Mean

Averages are frequently used to express a representative value from a set of numbers, groups, etc. This gives us a rough estimate and it takes into account every value in the set which is very helpful when working with large data. In financial modeling, the AVERAGE function in Excel is useful in calculating a representative value such as average revenue per unit, average revenue per user, average wage among employees, etc.
In this article, we will discuss how to use the AVERAGE function in Excel and present practical examples.
The AVERAGE Function in Excel
Before we dive into how to use Excel’s AVERAGE function, let’s first understand what this function exactly is calculating.
According to Meriam Webster’s Dictionary, an average is a single value that summarizes or represents the general significance of a set of values.
This representative single value can be the Median, Mode, and Mean with each describing different values. But the word “average” commonly refers to the Arithmetic Mean.
The Arithmetic Mean is the most common type of average (other types are Geometric and Harmonic Mean) and is calculated by adding all values and dividing the sum by the number of values.

For example, what is the arithmetic mean of the following 5 numbers: 10, 20, 30, 40, and 50.
Using the formula above, adding the numbers 10, 20, 30, 40, and 50 results in a sum of 150. Then divide the sum by the total number of values which is 5, the arithmetic mean is 30.

This concept of Arithmetic Mean is what Excel’s AVERAGE function is based on. The AVERAGE formula in Excel calculates the arithmetic mean of a set of numbers and can be found under the Statistical Formulas.
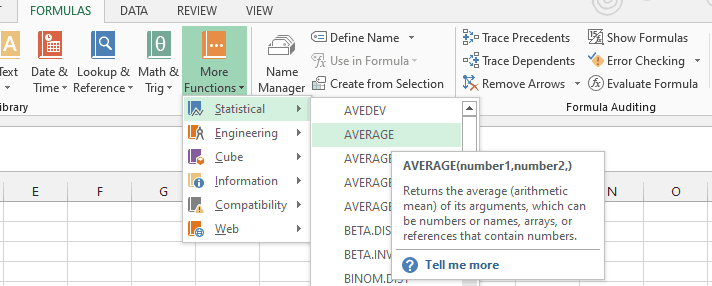
The AVERAGE formula in Excel:
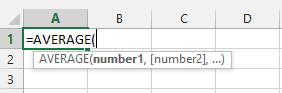
Where:
Number1 – Required argument that represents the numeric value, cell reference, or range of cells to be averaged.
[Number2], … Optional arguments that represent the numeric value, cell reference, or range of cells to be averaged.
Let’s use below numbers in Column A and Column B to illustrate how the AVERAGE formula in Excel works:
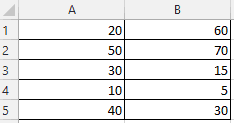

Keep in mind, the AVERAGE function in Excel works in columns, rows, ranges, tables, and cell references.
Examples of How to Use Excel’s AVERAGE Function
To illustrate how to use Excel’s AVERAGE function, assume US-based clothing company has the following sales across six (6) regions for all twelve (12) months.
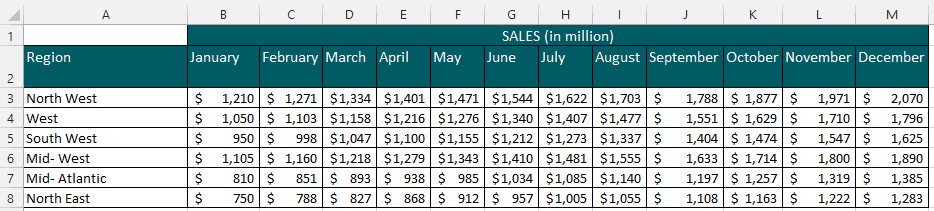
Using the AVERAGE function in Excel, we will answer the following questions:
- What are the average sales for January per region?
- What are the average sales for the North West region?
- What iare the average sales for South West and North East combined?
One Argument
First, we explain the simple use of this formula when using only one argument, e.g. an array of cells.
Question#1 What are average sales for January?
To answer Question #1, we will use cell range B3:B8 (the argument array) which contains all data for January.
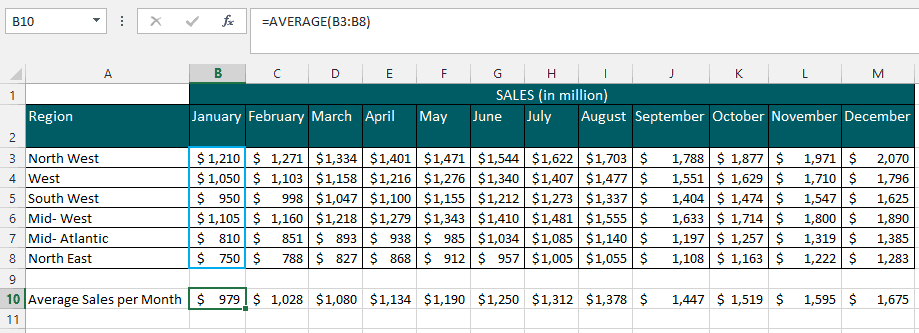
The formula AVERAGE(B3:B8) has a 2-step process:
- Adds all values in cell range B3 to B8 Then
- Divide the sum by the 6 regions
Please note, so far we only use tone argument, Number1, represented by cell range (B3:B8).
On average, sales in January are $979.
You can reference the table when calculating the average sales for the remaining months using the AVERAGE function in Excel.
Question#2 What are the average sales for the North West region?
To answer Question #2, we will use cell range B3:M3 which contains all data for the North West region.
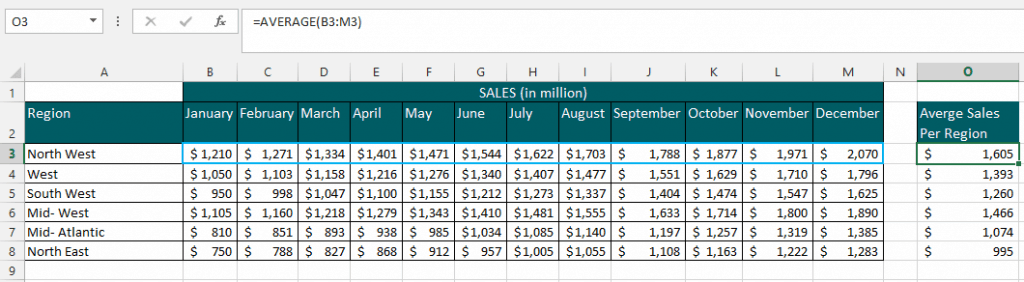
The AVERAGE formula in Excel =AVERAGE(B3:M3) has a 2-step process:
- Adds all values in cell range B3 to M3, then
- Divides the sum by 12 months
Please note, the AVERAGE formula in Excel has only one argument, Number1, represented by cell range(B3:M3).
The average sales for the North West region are $1,605.
You can reference the table when calculating the results for the other regions.
More Than One Argument
In this section, we focus on a slightly more complex use of this function, when using two arguments.
Question#3 What are the average sales for South West and North East combined?
Answering Question #3 will require more than one argument in the AVERAGE formula in Excel. The formula can accommodate 1 to 255 arguments.
The data needed to calculate the average sales for South West and North East are in cell ranges B5:M5 and B8:M8 respectively.
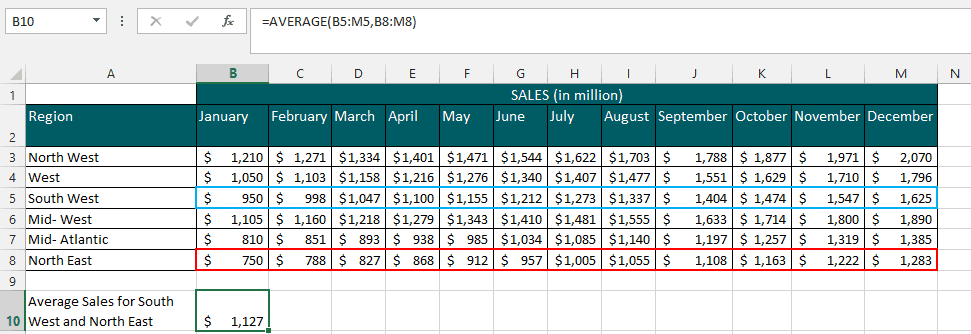
The AVERAGE formula in Excel =AVERAGE(B5:M5,B8:M8) also has a 2-step process:
- Adds all values in cell range B3 to M3 and B8 to M8 Then
- Divide each of the sums of the two ranges by 12 months
The required argument, Number1, is cell range B5:M5, and the optional argument, [Number2], is cell range B8:M8.
The average sales for both regions combined, South West and North East, are $1,127.
You can reference the table when calculating average sales for whatever possible combination of regions you prefer using this formula.
Key Takeaways on Using the Average Formula in Excel
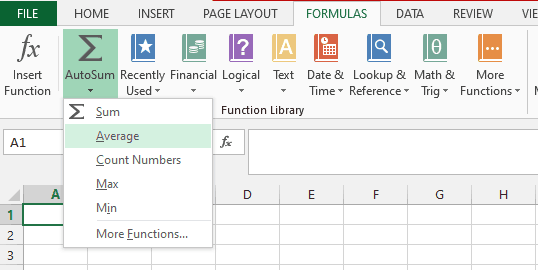
- A quick way to access the AVERAGE function in Excel is by the AutoSum Menu and selecting the AVERAGE Formula.
- Excel’s AVERAGE formula calculates the arithmetic mean.
- The function is not limited to calculating averages for numeric values in a table range, row range, column range, and non-adjacent cells. You can use this Afunction for individual cells as well as entering numeric values directly in the arguments.
- The formula works with numeric values such as whole numbers, fractions, decimals, time, date, etc. The formula can accommodate 1 to 255 arguments.
- The AVERAGE function in Excel does not ignore zero values but ignores blank cells.

Notice how the Average Sales for the North West region are lower when May, June, and July sales are zero. Despite containing zero values, the total sum is still divided by 12 months.

Take note of how the Average Sales for North West regions differ when May, June, and July sales are left blank. Since blank cells are ignored, the total sum is divided by 9 months only.
- The AVERAGE function in Excel will result in errors if any of the arguments in the AVERAGE formula contain errors as well.

Many Financial Models in Excel use this function. Please check them out.