
0 ITEMS

Private Credit / Real Estate Debt Fund Returns and Leverage Model (LP Net IRR, Waterfall with GP Catch-Up, Subscription Line and Back Leverage)
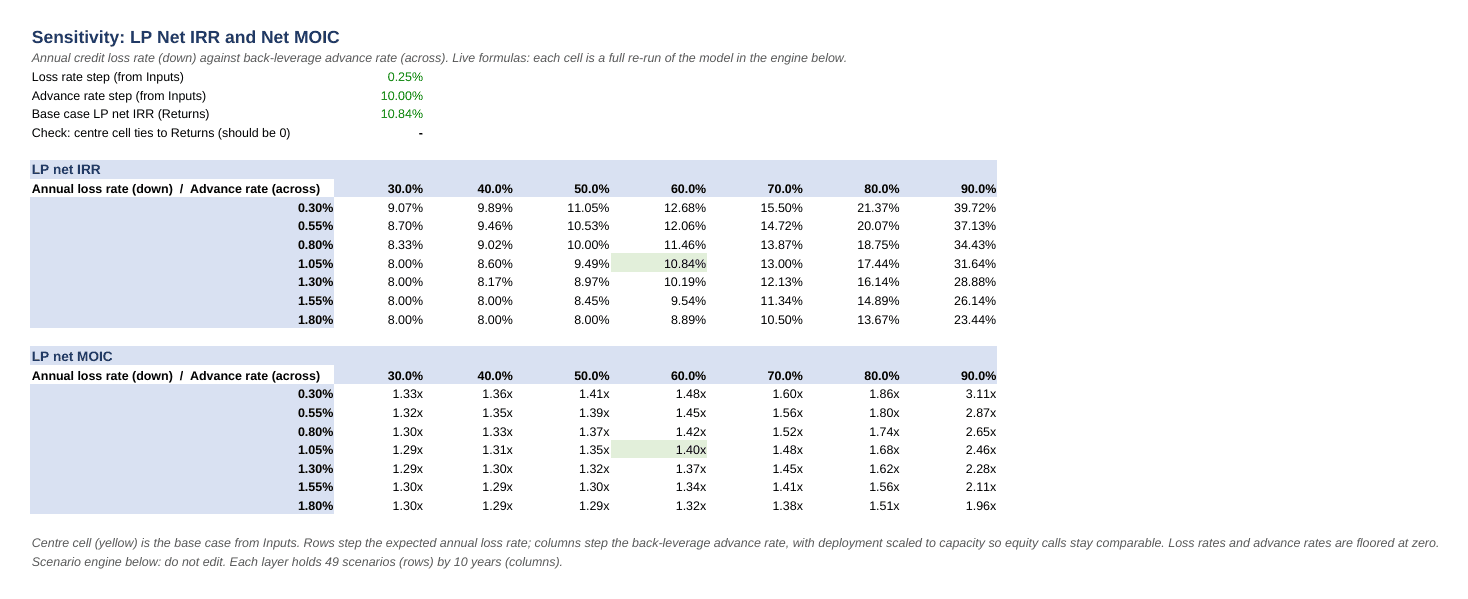
Ten-year closed-end debt fund model with deployment pacing, expected credit losses, subscription line and back leverage, management fees, a European waterfall with a true GP catch-up tier, LP net IRR, MOIC, DPI and TVPI by year, a gross-to-net return bridge and live 7×7 sensitivities of LP net IRR to loss rate and advance rate.
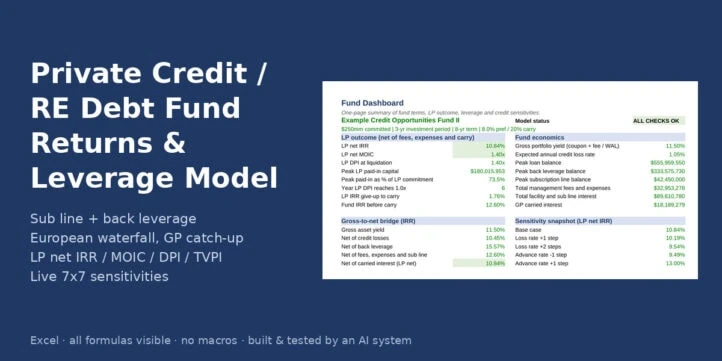

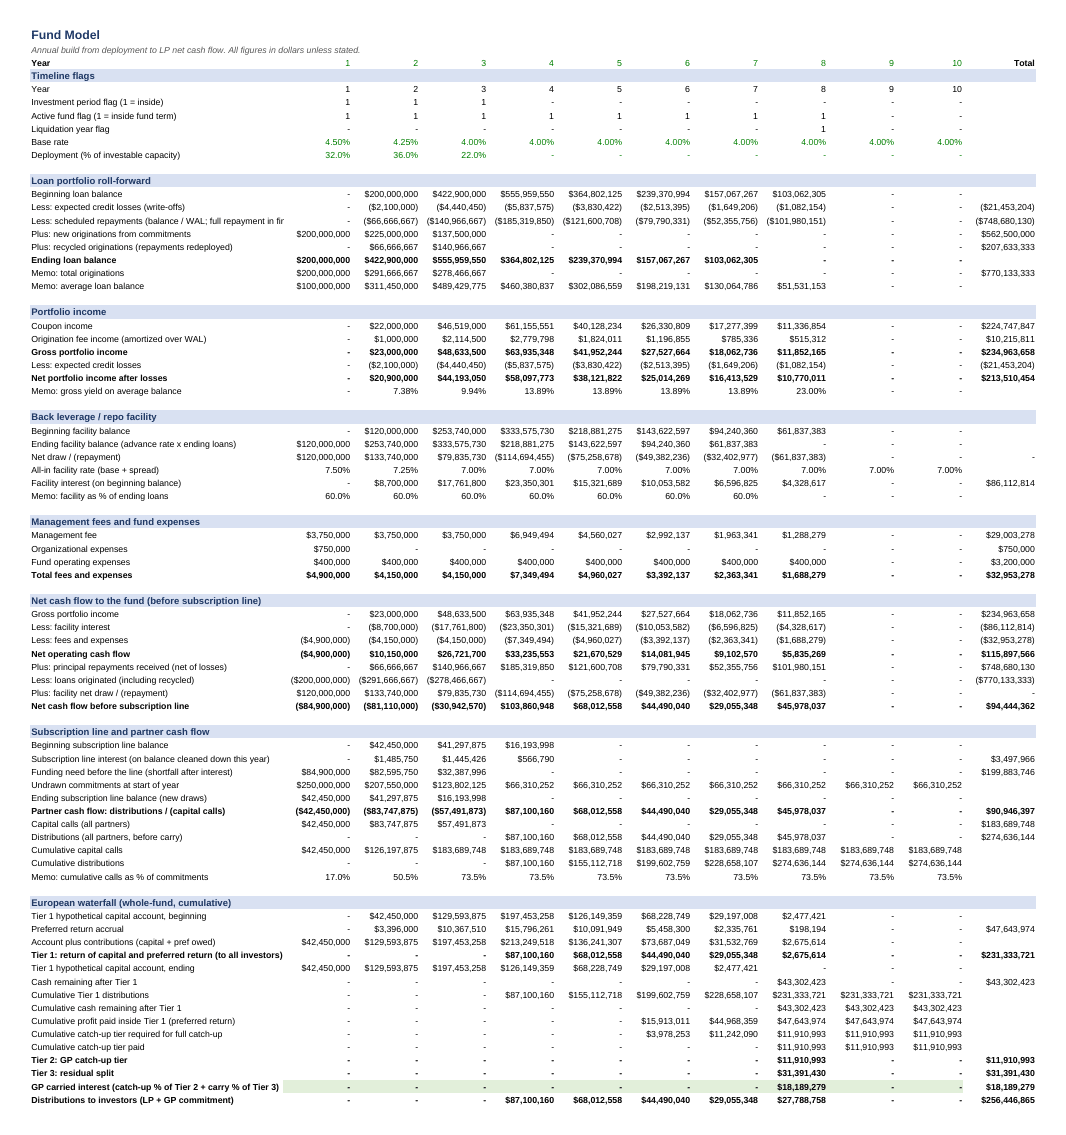
A debt fund’s marketing deck quotes a gross yield. The limited partner gets what is left after credit losses, facility interest, management fees, fund expenses and carried interest, and the gap between those two numbers is the whole underwriting question. This Excel model builds that gap line by line for a closed-end private credit or real estate debt fund, from first close to liquidation, and reports the LP outcome the way an institutional investor reads it: net IRR, net MOIC, DPI and TVPI by year, and a bridge from gross asset yield to LP net return.
What the template is for
Fund managers preparing a fundraising model or sizing the leverage a strategy can carry. Limited partners, consultants and placement agents checking a sponsor’s net return claim and seeing how much of it depends on the subscription line. Analysts and students who want a transparent, formula-only fund model with a real catch-up tier instead of a hard-coded carry percentage.
What it includes
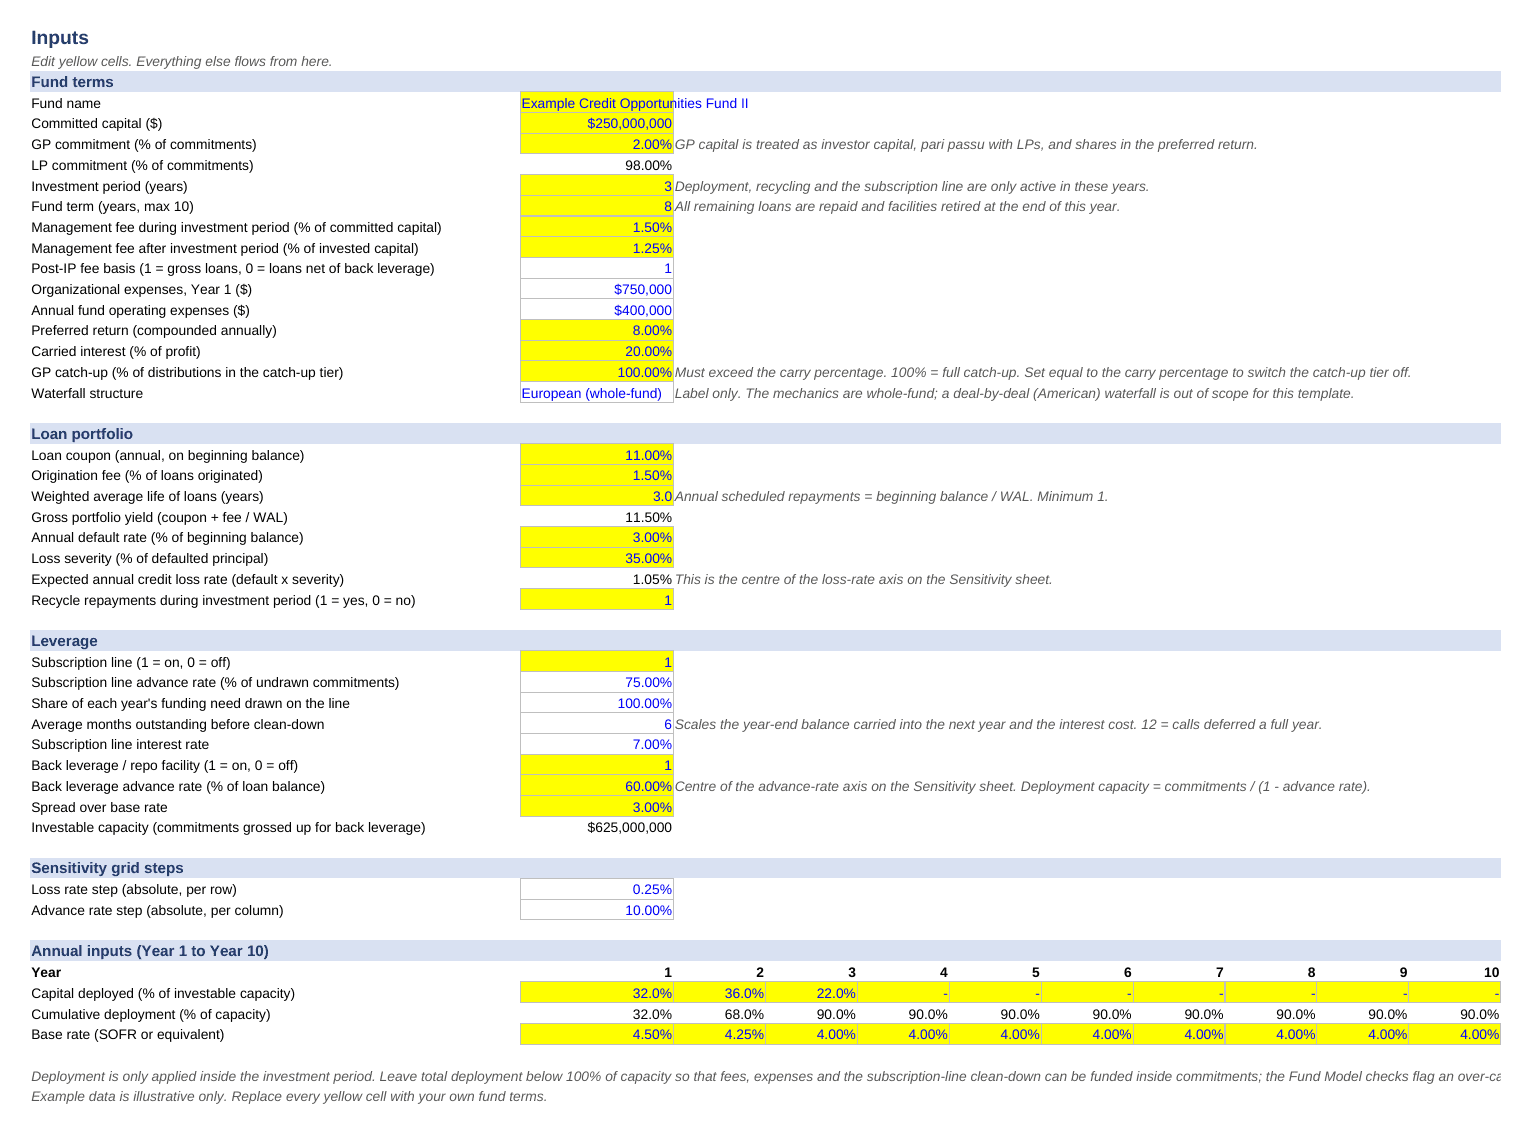
Inputs: committed capital, GP commitment, investment period and fund term, management fee on commitments during the investment period and on invested capital after it (gross or net of leverage, your choice), organizational and annual fund expenses, preferred return, carry and catch-up percentage; loan coupon, origination fee, weighted average life, annual default rate, loss severity and a recycling toggle; subscription line advance rate, usage, months outstanding and rate; back leverage advance rate and spread; a deployment pace row and a base rate path by year; and the two sensitivity step sizes.
Fund Model: a 10-year annual build with the loan book roll-forward (losses, scheduled repayments, new and recycled originations), portfolio income, the back leverage facility with automatic draws and repayments, fees and expenses, net cash flow before and after the subscription line, capital calls and distributions, the European whole-fund waterfall with the Tier 1 hypothetical capital account, the cumulative catch-up target, Tier 2 and Tier 3 allocations and GP carry, cash flows by party, LP metrics by year and a block of seven reconciliation checks with a single status cell.
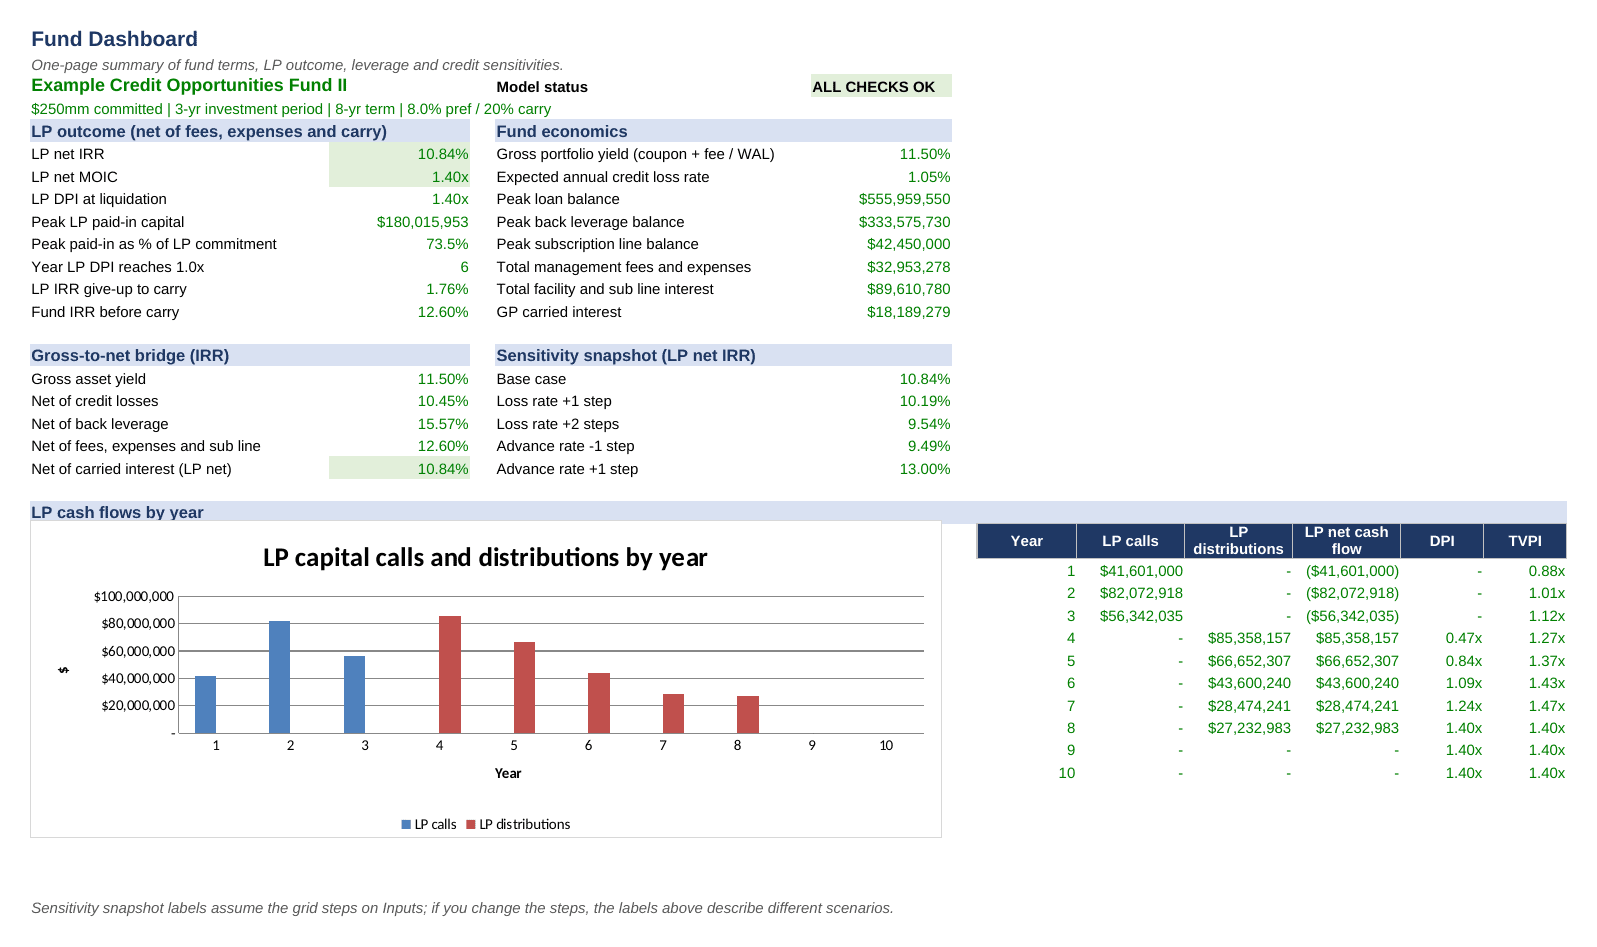
Returns: fund, LP and GP capital, distributions, profit, MOIC and IRR; carry dollars split between the catch-up and residual tiers; the LP’s IRR give-up to carry; the year DPI reaches 1.0x; a five-step gross-to-net IRR bridge (gross asset yield, net of losses, net of leverage, net of fees and expenses, net of carry) with the change at each step; and LP calls, distributions, NAV, DPI, RVPI, TVPI and interim net IRR for every year.
Sensitivity: two 7×7 grids, LP net IRR and LP net MOIC, across annual loss rate and back-leverage advance rate. Every cell is a live formula driven by a 49-scenario replica of the model on the same sheet, with the centre cell tied back to the Returns sheet by a check. No Excel data tables.
Dashboard: one page with the LP outcome, fund economics, the bridge, a sensitivity snapshot, the status line and a chart of LP calls and distributions by year.
Method notes
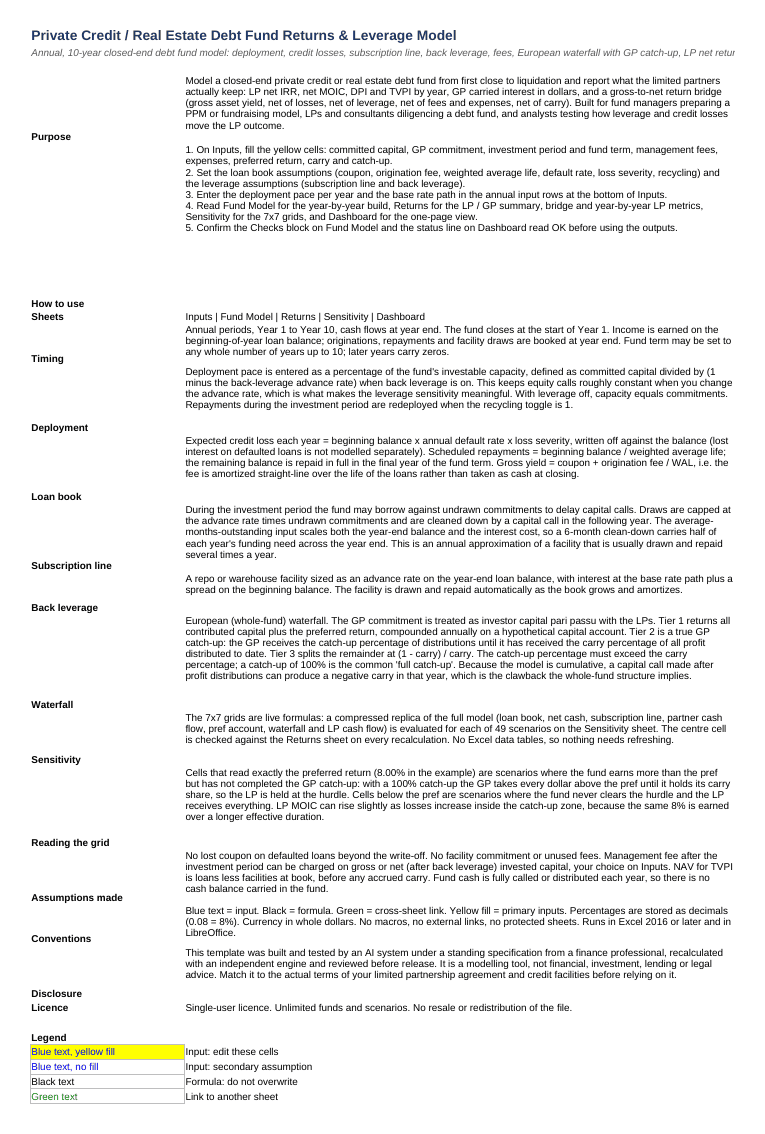
Annual periods with year-end cash flows. Deployment is entered as a percentage of investable capacity (commitments grossed up for back leverage) so that equity calls stay comparable when the advance rate changes. Gross yield is the coupon plus the origination fee amortized over the weighted average life. The subscription line defers calls by an average-months-outstanding input and is cleaned down each year. The catch-up tier pays the GP its catch-up percentage of distributions until the GP holds the carry percentage of all profit distributed to date, which is why the LP is pinned at the preferred return across part of the sensitivity grid.
How to use it
Replace the yellow cells on Inputs, confirm the Dashboard status reads ALL CHECKS OK, then read Returns and Sensitivity. Blue text marks inputs, black text formulas, green text links to another sheet. No macros, no locked cells, no external links; runs in Excel 2016 or later and LibreOffice.
This template was built and tested by an AI system under a standing specification from a finance professional, recalculated with an independent engine and reviewed before release. All cells are unlocked and every formula is visible. Example data is included. It is a modelling tool, not financial, investment, lending or legal advice.
Similar ProductsOther customers were also interested in...



 eFinancialModels
Electric Vehicle (EV) Charging Station Financial M...
With this comprehensive 5- or 10-year monthly tool, investors can assess the viability of setting up... Read more

Financial Model for Mobile App | Mobile App Busine...
The Mobile App Financial Plan Template in Excel allows you to develop financial projections when lau... Read more

 HenrySheykin
Food Truck Financial Model Excel Template
The Food Truck Financial Model helps entrepreneurs, founders, business owners, consultants, and anal... Read more

Green Hydrogen Production from Wind Energy Financi...
The Green Hydrogen from Wind Financial Model aims to comprehensively forecast a horizon of 40 years ... Read more

Simple Mutual Non-Disclosure Agreement Template
Protect your business secrets with ease using our Simple Mutual Non-Disclosure Agreement Template. S... Read more

Solar Energy Financial Model
The Solar Energy Financial Model Spreadsheet Template in Excel assists you in preparing a sophistica... Read more

 Peter Graf
The Customer-Centric Financial Model for Restauran...
Starting a restaurant without a financial plan is like driving a car blindfolded. You wouldn´t do i... Read more
You must log in to submit a review.