
0 ITEMS

Non-Powered Dam Hydropower Conversion, Site Screening, Turbine Sizing & Project Finance Model – 30-Year Forecast
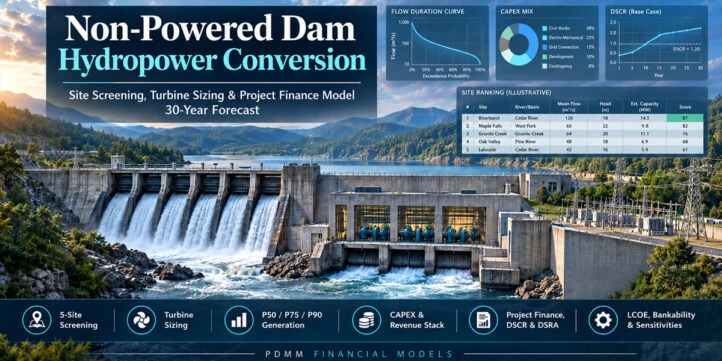
Turn an existing non-powered dam opportunity into a structured investment decision. This premium Excel model is built for developers, utilities, dam owners, water authorities, infrastructure investors, lenders, advisors, and project teams that need to move from a preliminary site idea to a fully linked hydropower conversion case. Instead of treating hydropower as a simple capacity-times-price forecast, the workbook connects site screening, head and flow, operational restrictions, turbine sizing, monthly generation, retrofit CAPEX, operating costs, revenue contracting, construction funding, senior debt, cash flow, returns, LCOE, scenarios, sensitivities, and a final Go / Hold / Reject development view.

💧 Non-Powered Dam Hydropower Conversion Financial Model
Turn an existing non-powered dam opportunity into a structured investment decision. This premium Excel model is built for developers, utilities, dam owners, water authorities, infrastructure investors, lenders, advisors, and project teams that need to move from a preliminary site idea to a fully linked hydropower conversion case.
Instead of treating hydropower as a simple capacity-times-price forecast, the workbook connects site screening, head and flow, operational restrictions, turbine sizing, monthly generation, retrofit CAPEX, operating costs, revenue contracting, construction funding, senior debt, cash flow, returns, LCOE, scenarios, sensitivities, and a final Go / Hold / Reject development view.
🧭 What decisions does the model support?
Use the workbook to answer practical questions such as:
- Which non-powered dam should be prioritized from a group of candidate sites?
- How do gross head, net head, design flow, environmental flow, and operational restrictions affect usable turbine flow?
- Which turbine technology is most suitable under the modeled head and flow envelope?
- What installed MW and annual P50, P75, and P90 generation can the project support?
- How much retrofit CAPEX is required by major category and how does the total compare with an editable $/kW benchmark range?
- What happens to economics when construction is delayed or accelerated?
- How should PPA, merchant, renewable-attribute, capacity/grid-service, and optional incentive revenues be combined?
- How much senior debt can the project carry under DSCR constraints?
- What DSRA, cash sweep, debt service, and sponsor equity requirements result from the financing structure?
- What are the project IRR, equity IRR, NPV, MOIC, payback, LCOE, LLCR, PLCR, and bankability outputs?
- Which assumptions matter most to value, generation, and debt coverage?
- Should the selected project advance, be optimized, or be redesigned?
⚙️ Model workflow
The model follows a clear decision process.
1. Screen candidate dams.
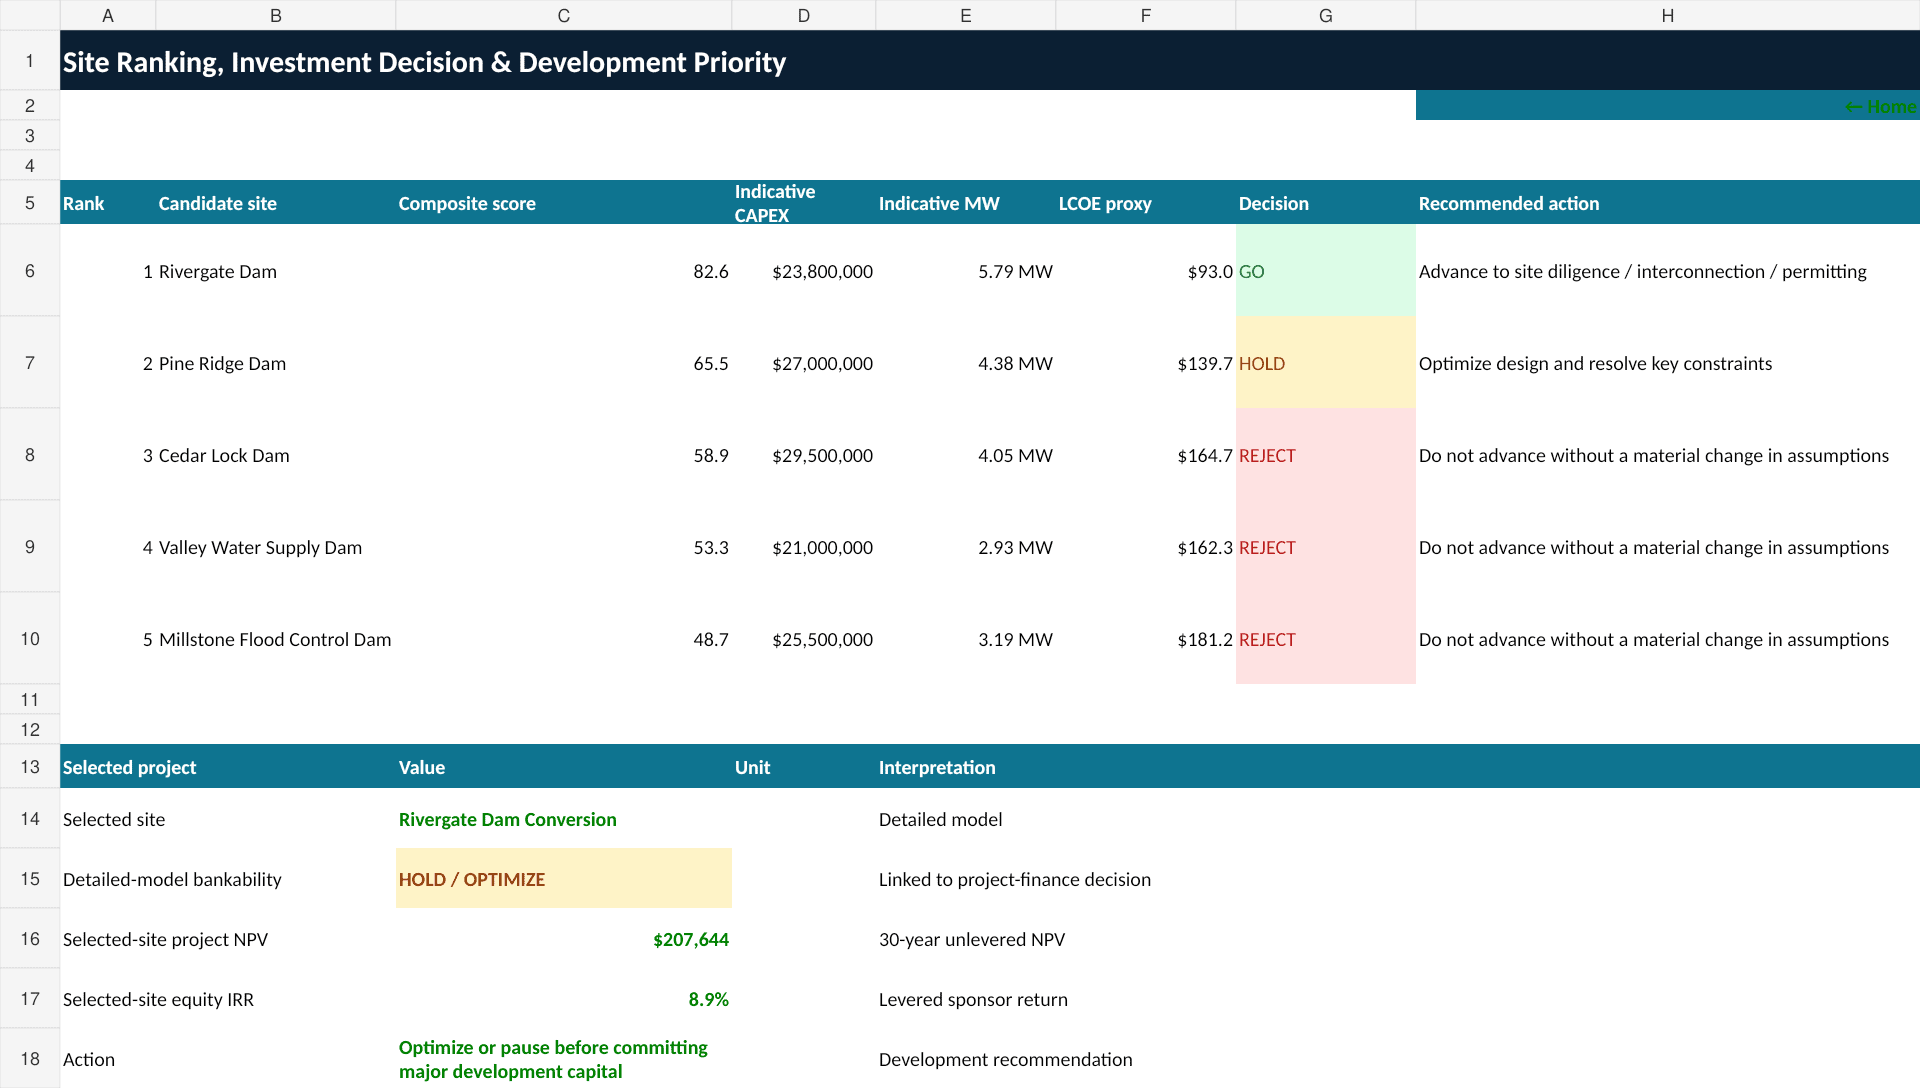
The Site Screening engine compares five replaceable sample sites using head, average flow, design flow, grid distance, constraint score, indicative CAPEX, MW, P50 generation, CAPEX/kW, an LCOE proxy, technical score, cost score, composite score, rank, and a development decision.
2. Set selected-site assumptions.
The centralized Site Inputs sheet holds the project scenario, development timing, head and hydraulic-loss assumptions, natural flow, design flow, minimum environmental flow, turbine and generator efficiencies, availability, station use, generation degradation, P75/P90 factors, revenue assumptions, inflation, tax, discount rates, debt parameters, DSRA, benchmark CAPEX, cash sweep, working capital, useful life, residual value, maintenance reserve, and lifecycle CAPEX assumptions.
3. Build the hydrology and operating case.
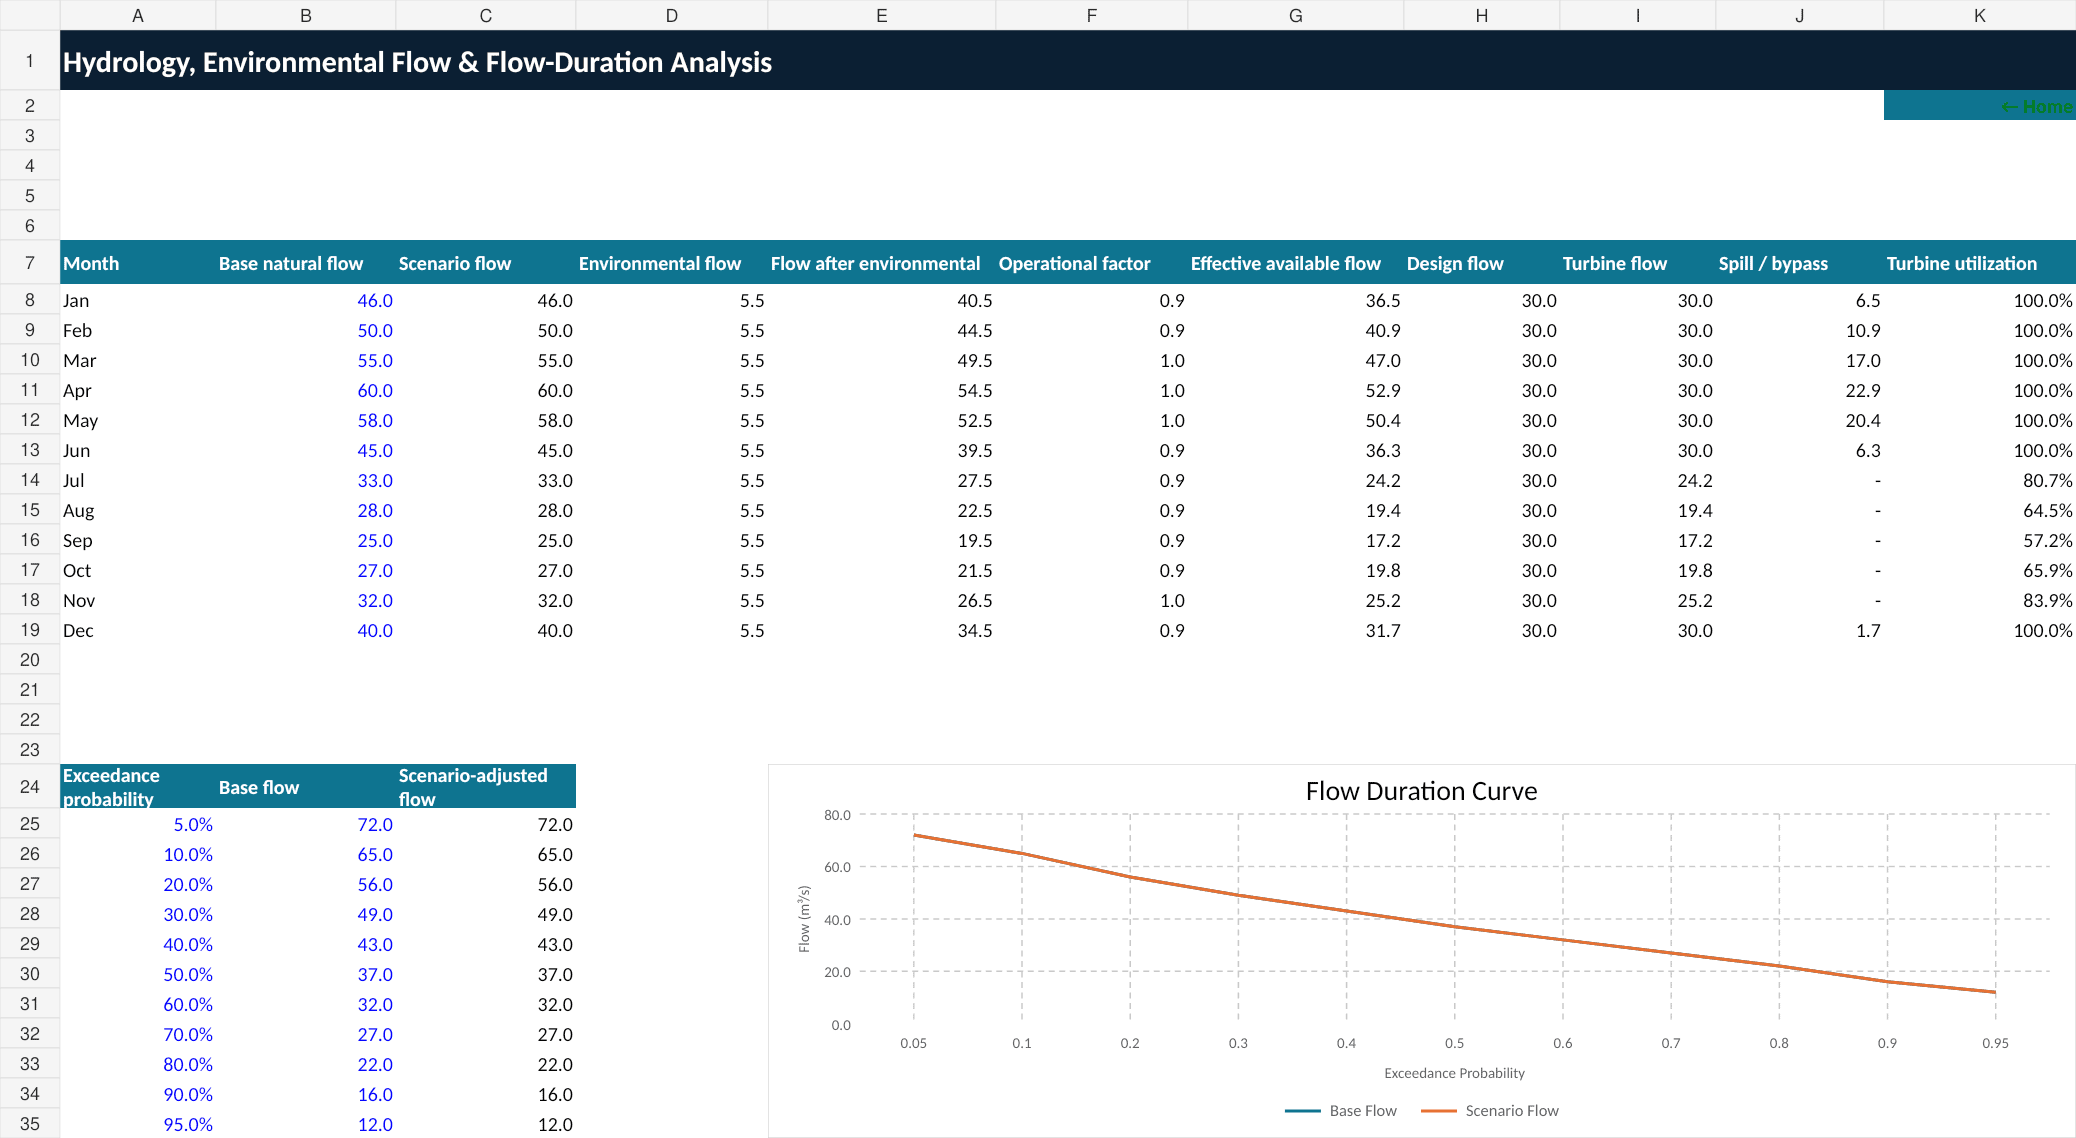
Monthly natural flow is adjusted for the selected scenario, minimum environmental flow, and modeled navigation, irrigation, flood-control, and water-supply constraints. The workbook also includes a flow-duration curve table and chart.
4. Size and compare turbine technologies.
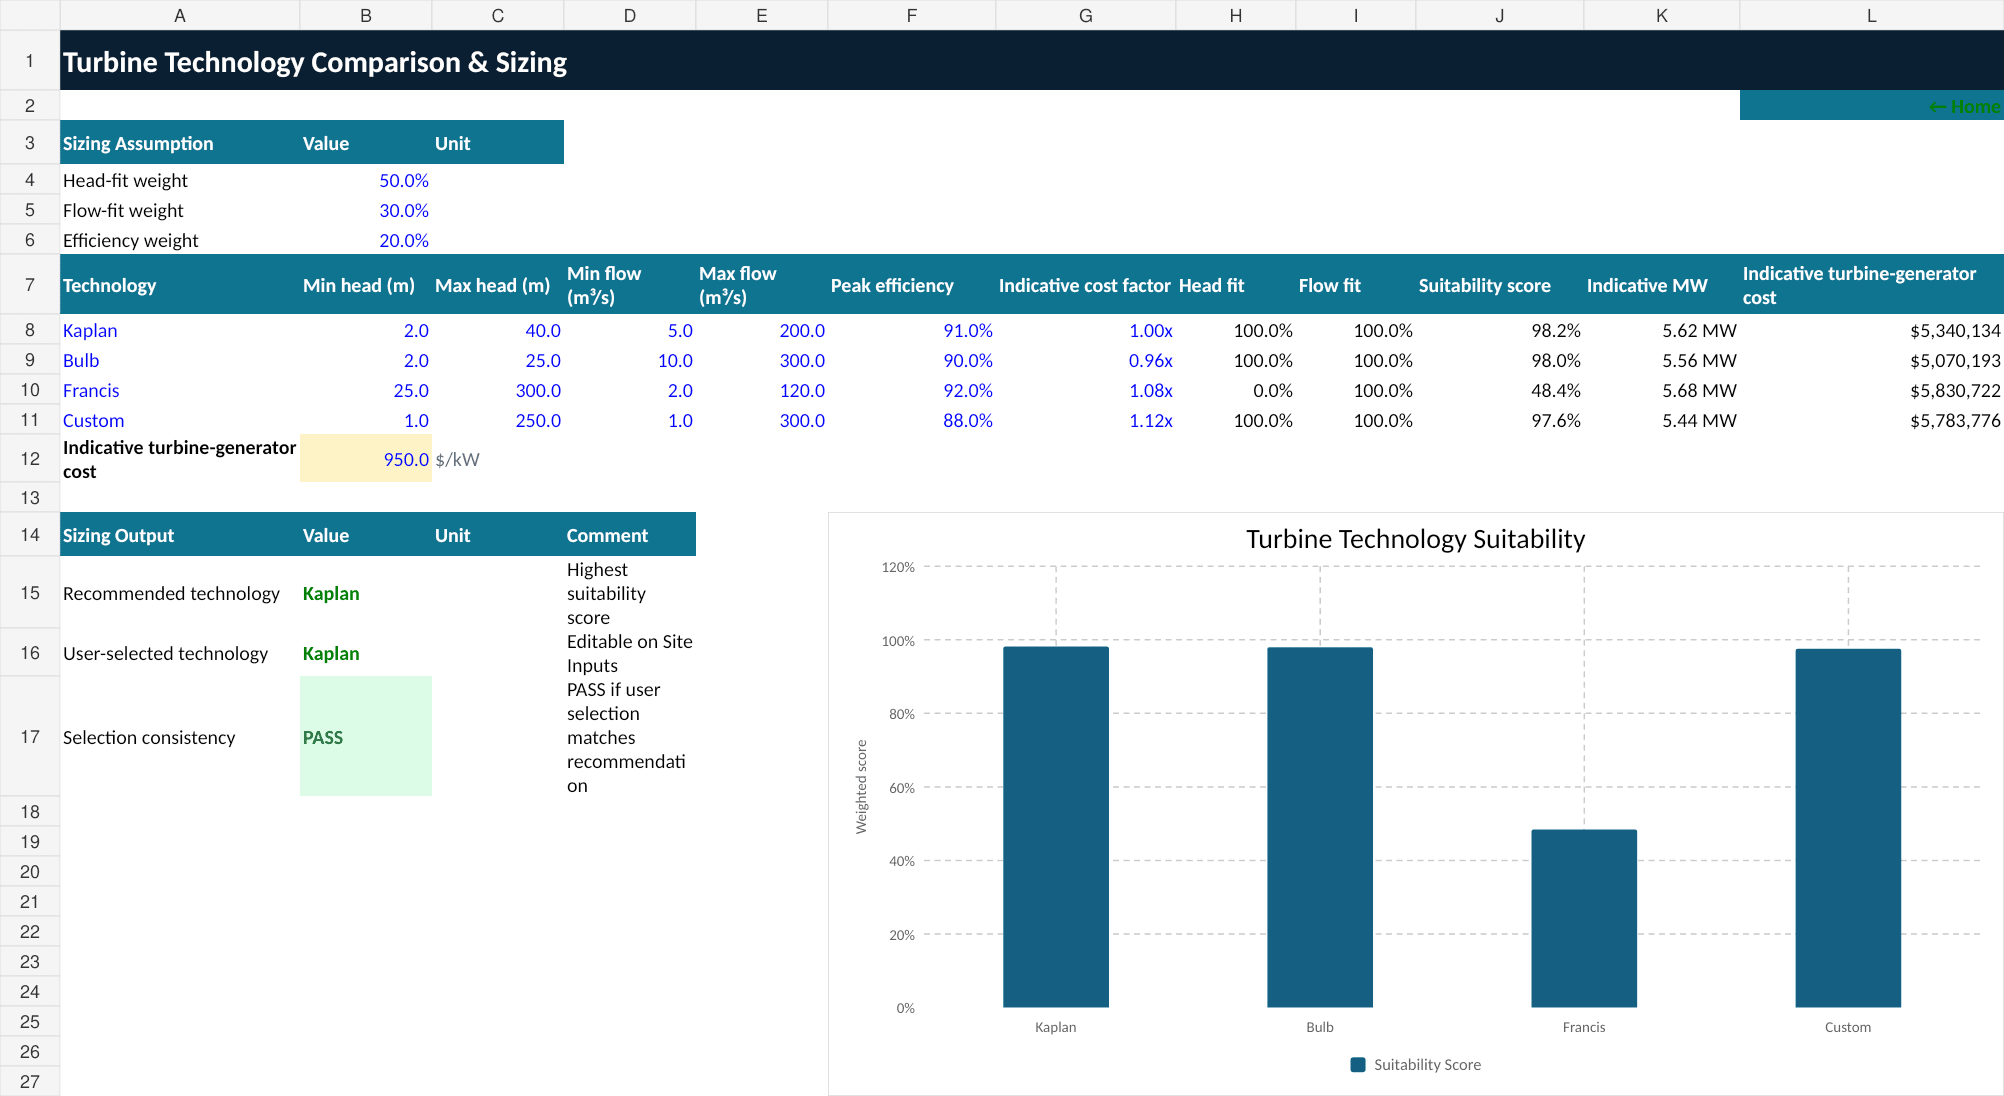
Kaplan, Bulb, Francis, and Custom options are compared for head fit, flow fit, peak efficiency, indicative cost factor, suitability score, indicative MW, and indicative turbine-generator cost. A recommendation is shown against the user-selected technology.
5. Forecast generation.
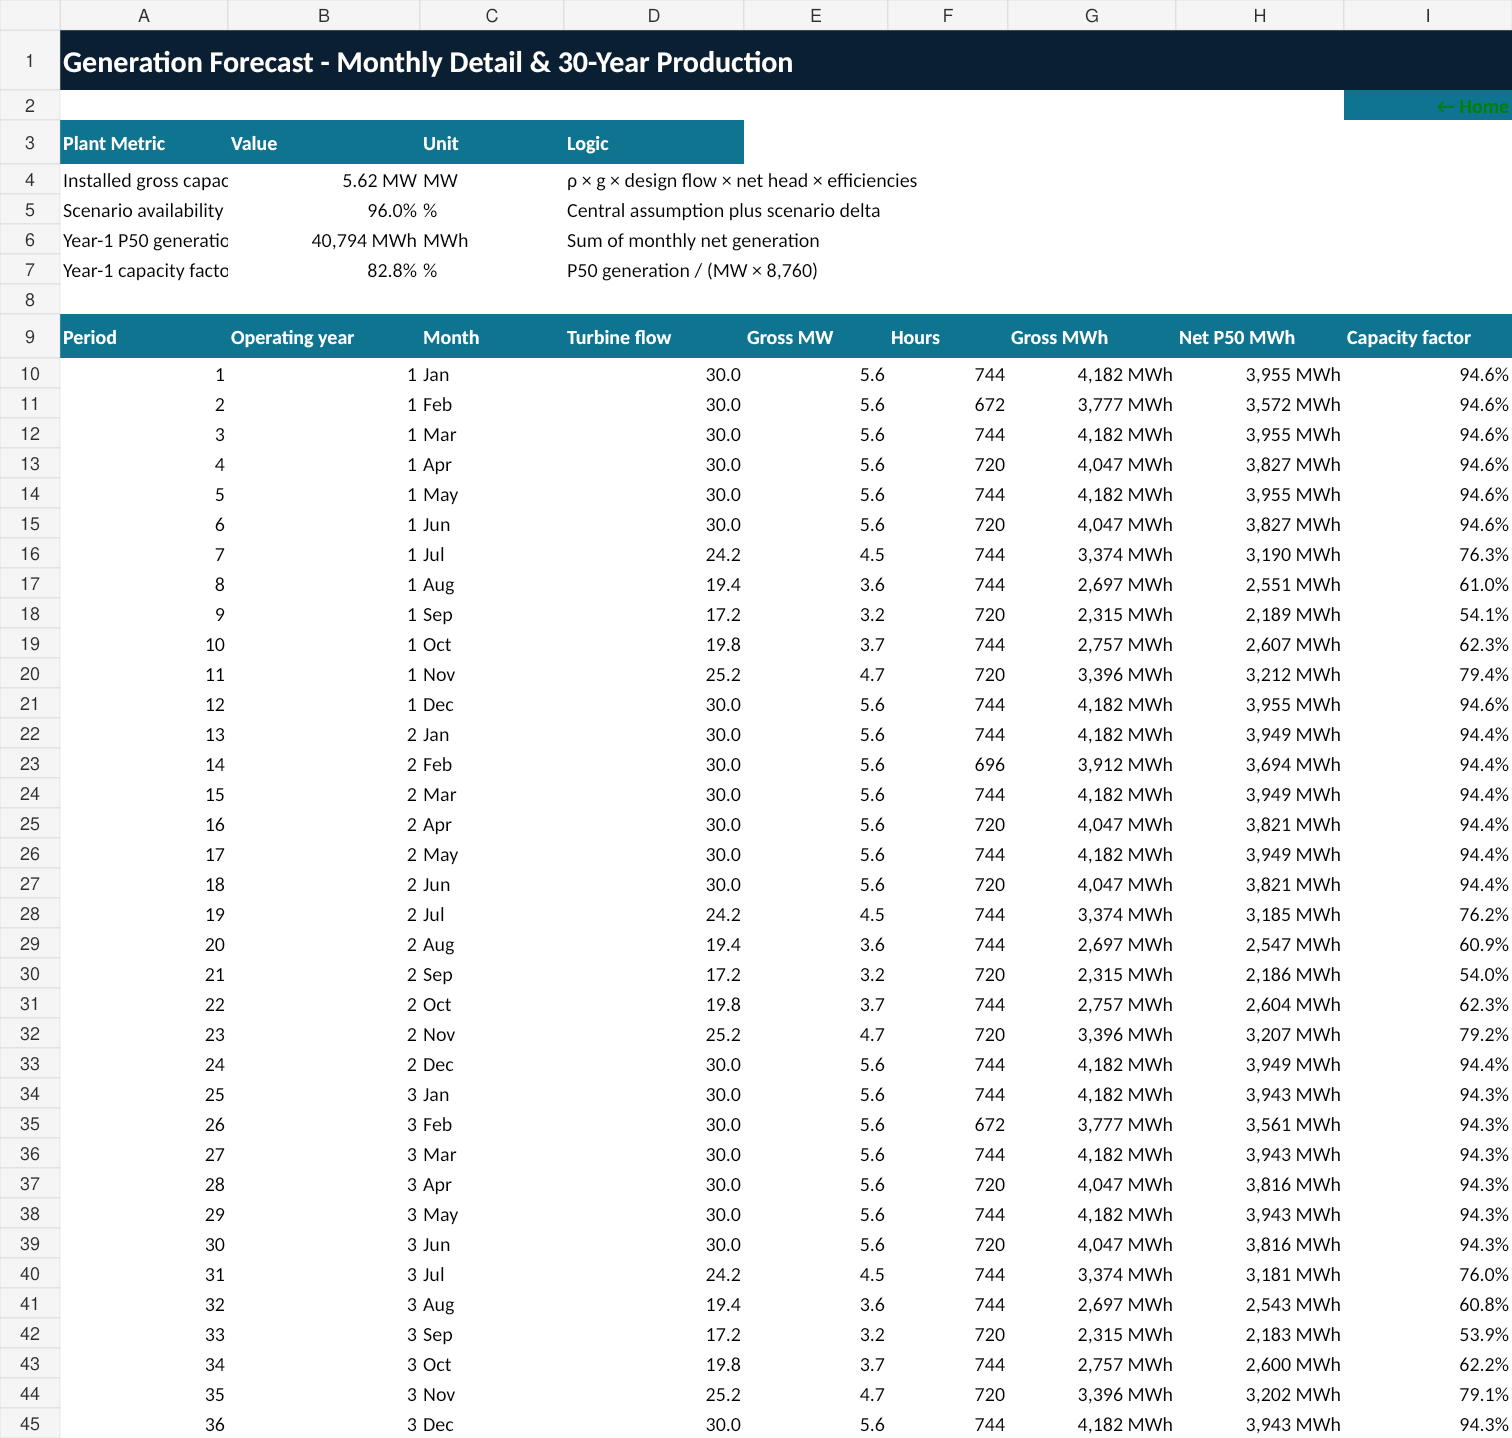
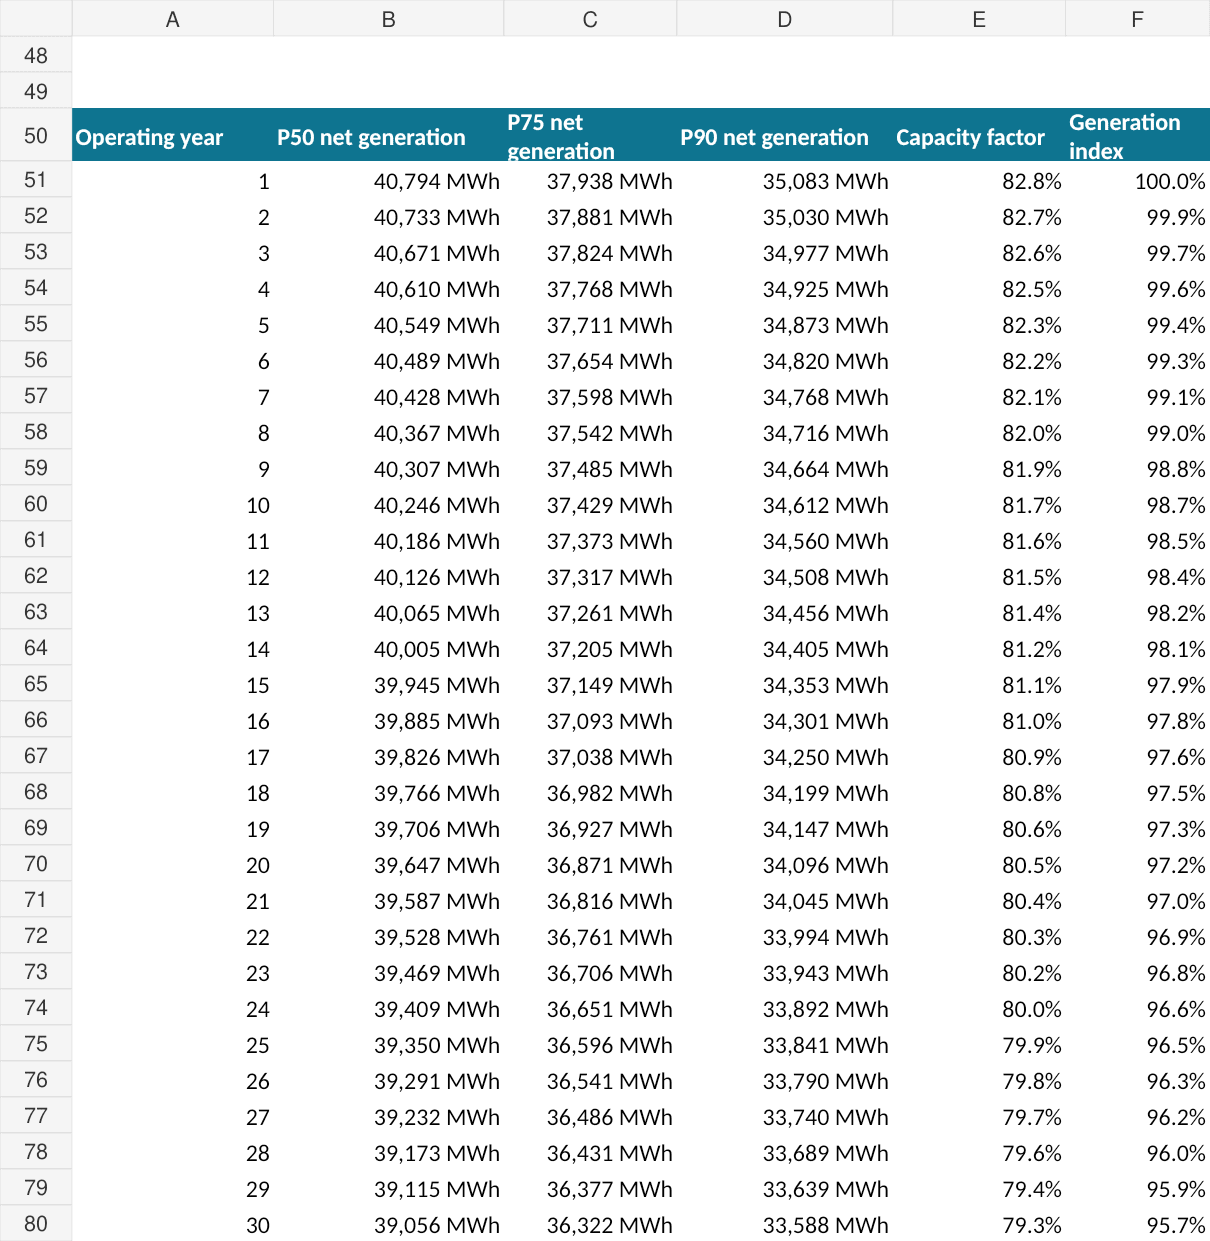
The Generation schedule includes 36 months of operating detail plus a 30-year annual forecast. It calculates turbine flow, gross MW, hours, gross MWh, net P50 MWh, capacity factor, P75 output, P90 output, degradation, and generation index.
💵 CAPEX, OPEX, revenue, and financing
The Development Timeline models permitting, engineering, civil works, electromechanical procurement and installation, interconnection, commissioning, effective start/end timing, monthly spend percentages, monthly engineering CAPEX, and cumulative spend.
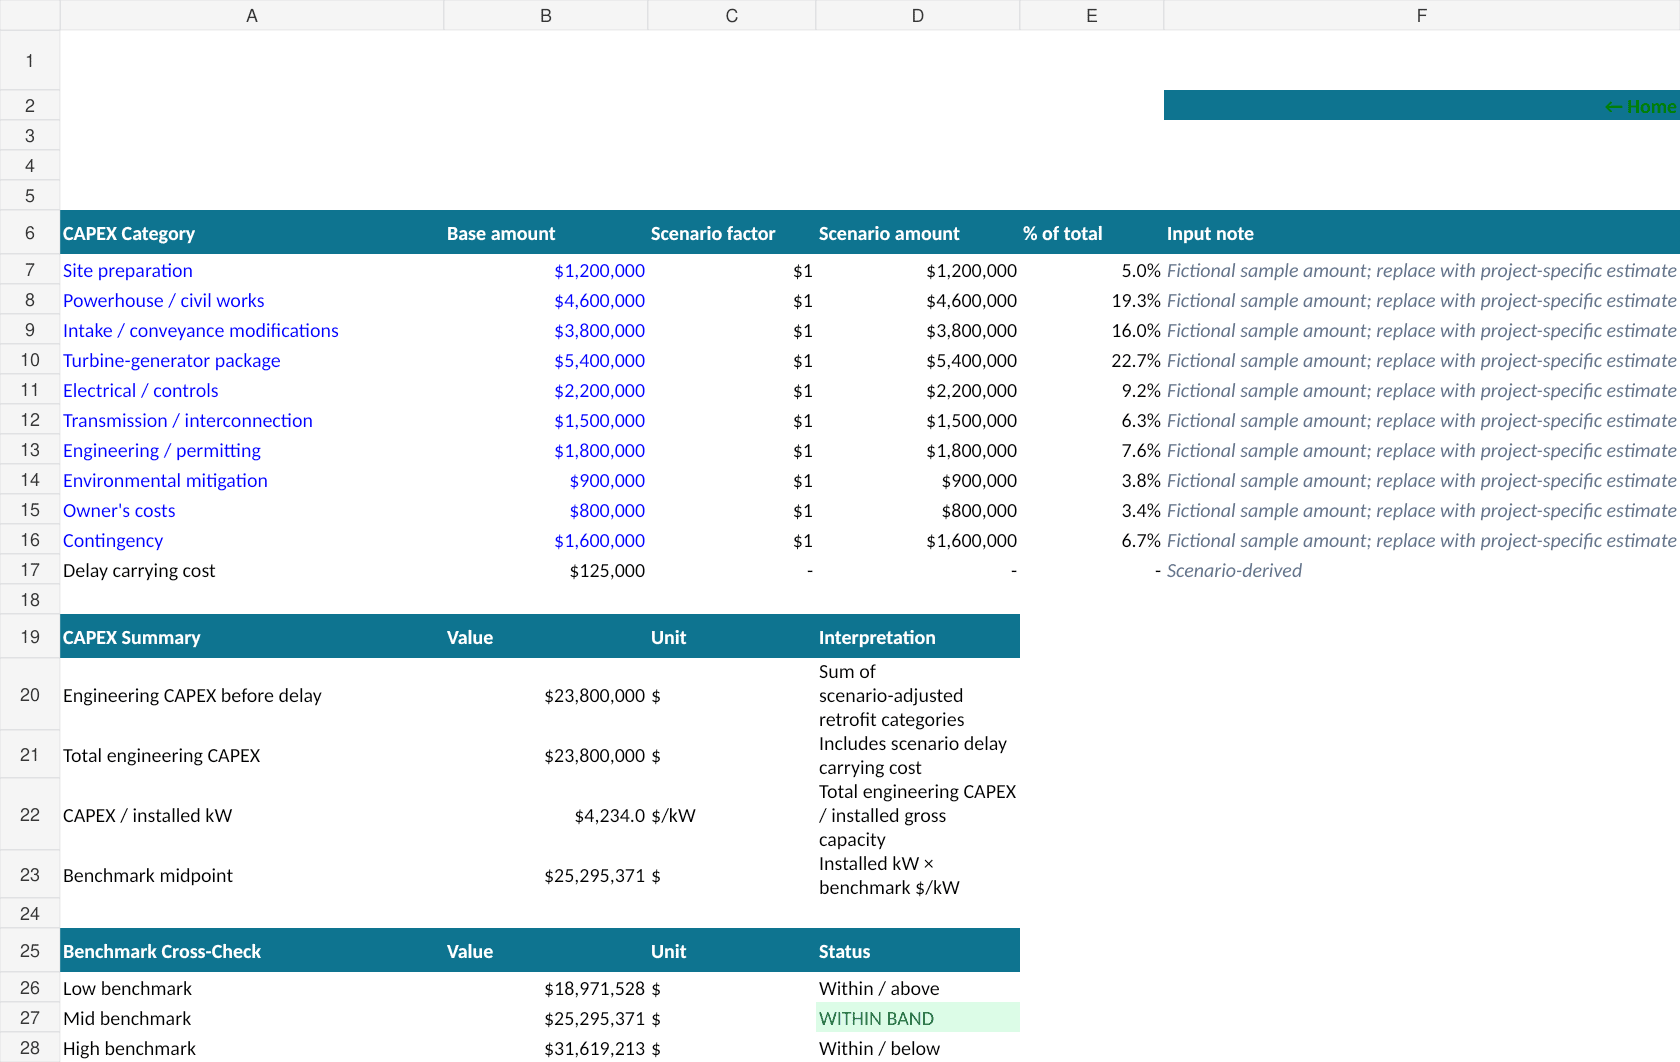
The CAPEX schedule breaks the project into site preparation, powerhouse/civil works, intake/conveyance modifications, turbine-generator package, electrical/controls, transmission/interconnection, engineering/permitting, environmental mitigation, owner’s costs, contingency, and scenario-derived delay carrying cost. It also calculates CAPEX per installed kW and a low/mid/high benchmark cross-check.
The OPEX & Maintenance schedule models fixed O&M, variable O&M, insurance, water/land charges, regulatory/compliance costs, administration, total cash OPEX, and major-maintenance reserve funding across 30 years.
The Revenue & Incentives schedule separately models contracted PPA revenue, merchant revenue, renewable-attribute revenue, capacity/grid-service revenue, and an optional illustrative production-incentive input. Contracted share, tariffs, escalation rates, and incentive assumptions are editable.
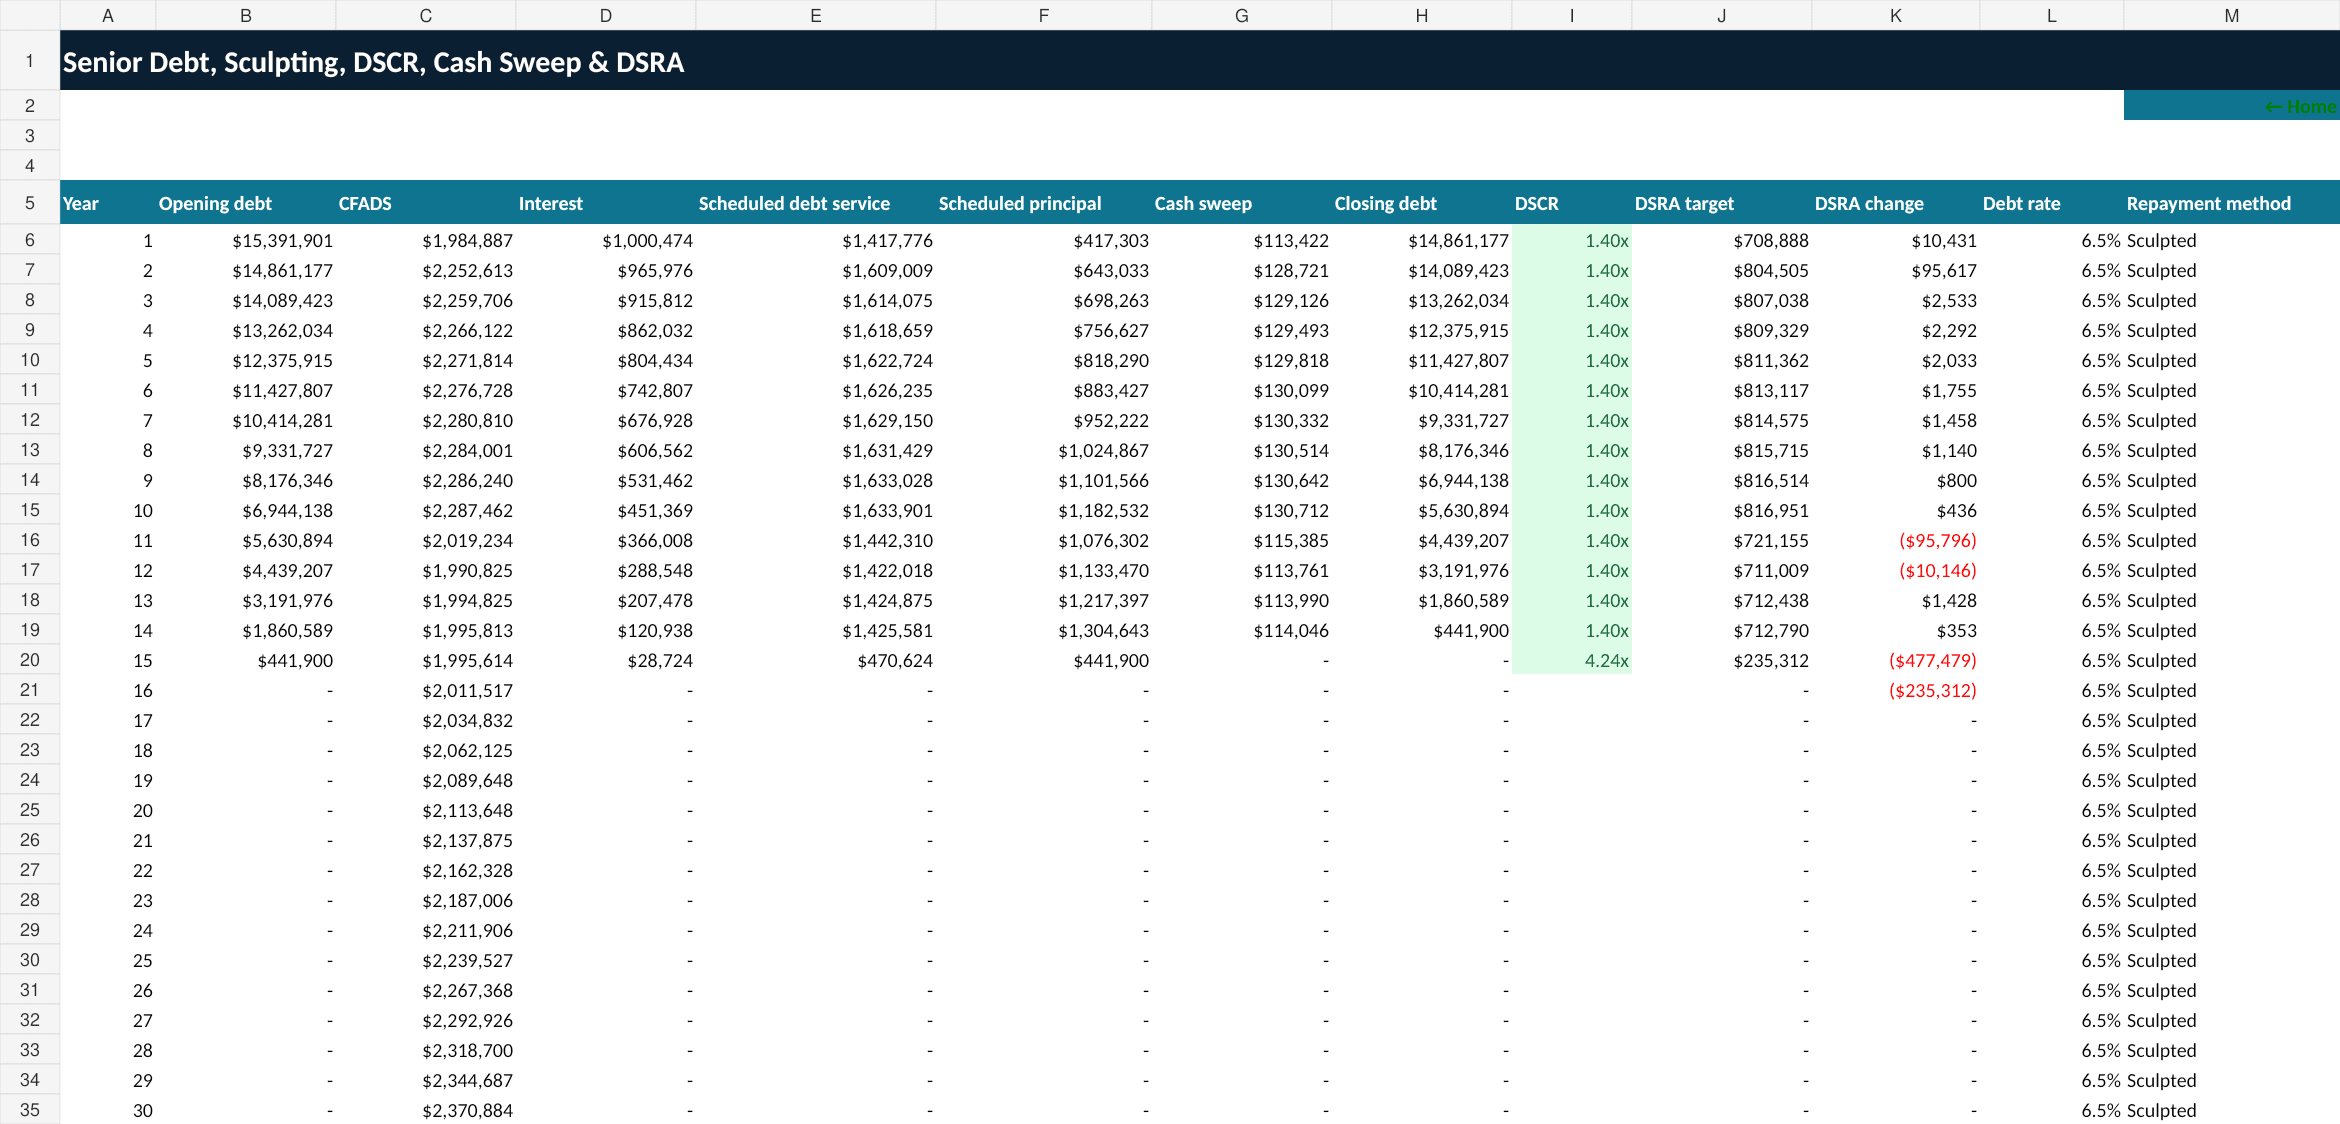
The Sources & Uses and Debt / DSCR schedules connect project CAPEX to estimated interest during construction, financing fee, initial DSRA, senior debt, sponsor equity, CFADS, scheduled debt service, sculpted or scheduled amortization, principal repayment, cash sweep, closing debt, DSCR, DSRA target/change, and debt rate.
📊 Integrated financial statements and returns
The workbook contains fully linked schedules for:
- Fixed assets, lifecycle CAPEX, accumulated depreciation, and net PPE
- 30-year Income Statement
- 30-year Balance Sheet with balance check
- 30-year Cash Flow and sponsor distribution waterfall
- Project and equity return analysis
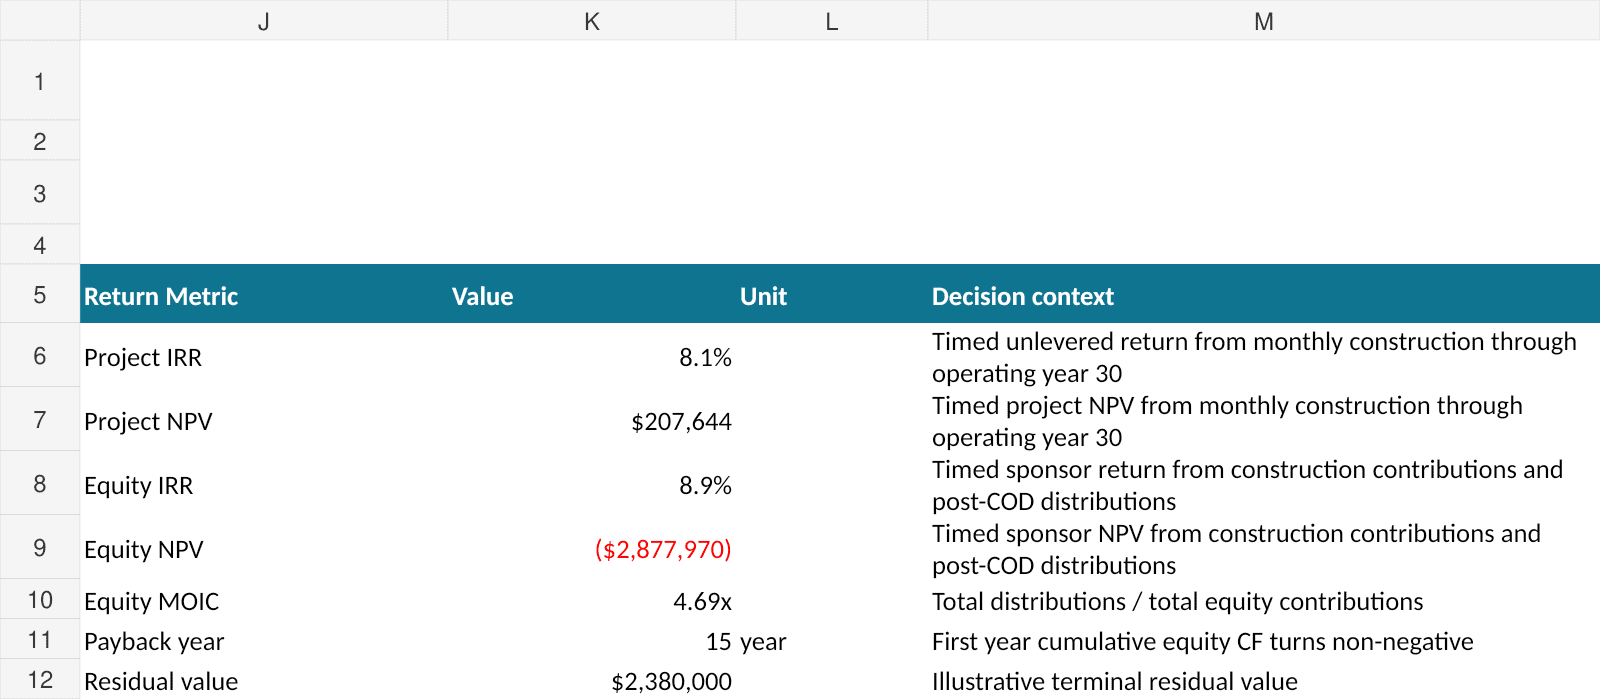
The returns section uses timed construction and operating cash flows for project IRR, project NPV, equity IRR, equity NPV, equity MOIC, payback year, and residual value.
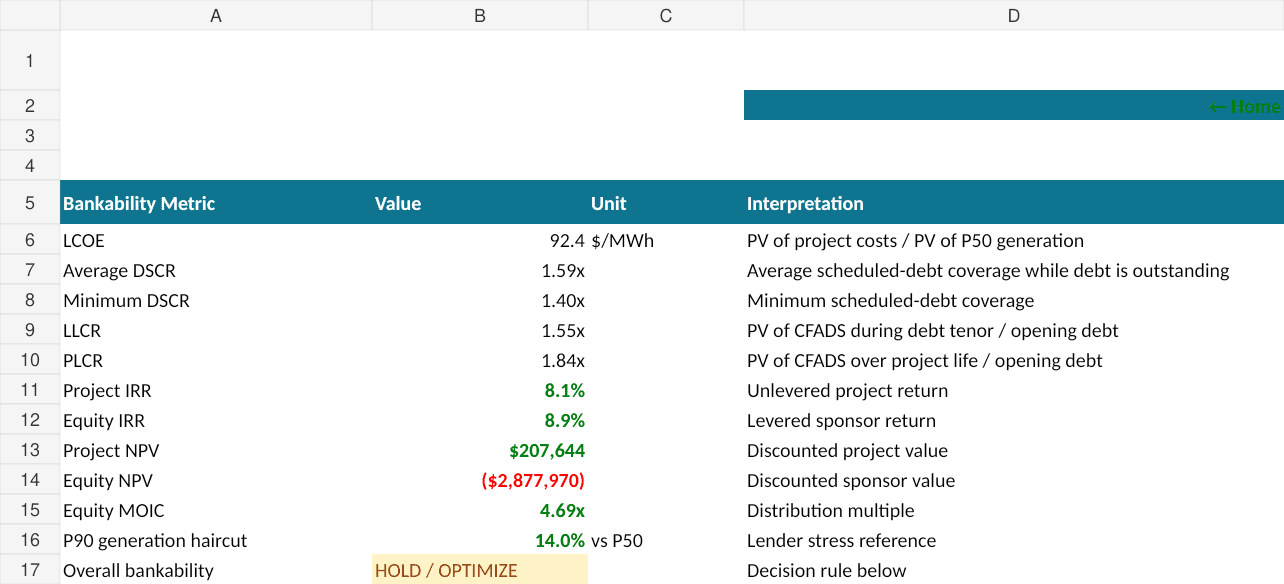
The LCOE & Bankability sheet brings together LCOE, average DSCR, minimum DSCR, LLCR, PLCR, project IRR, equity IRR, project NPV, equity NPV, equity MOIC, the P90 generation haircut, and an overall bankability decision.
🔀 Scenarios and sensitivities
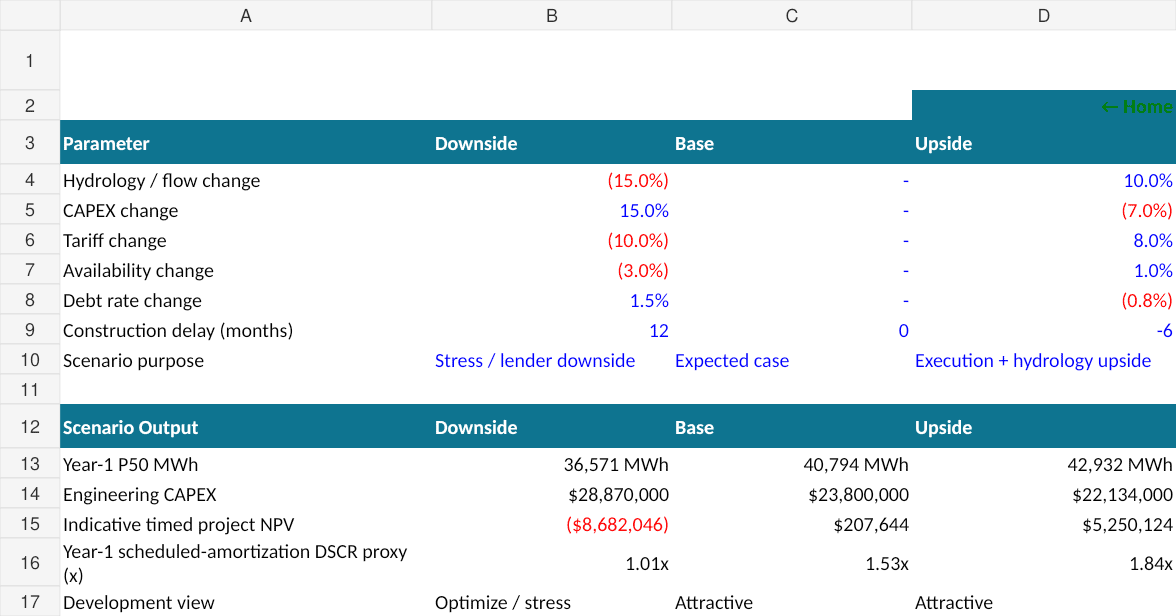
The Scenario Manager contains Downside, Base, and Upside cases. The cases adjust hydrology/flow, CAPEX, tariff, availability, debt rate, and construction timing, then compare Year-1 P50 generation, engineering CAPEX, indicative timed project NPV, scheduled-amortization DSCR proxy, and development view.
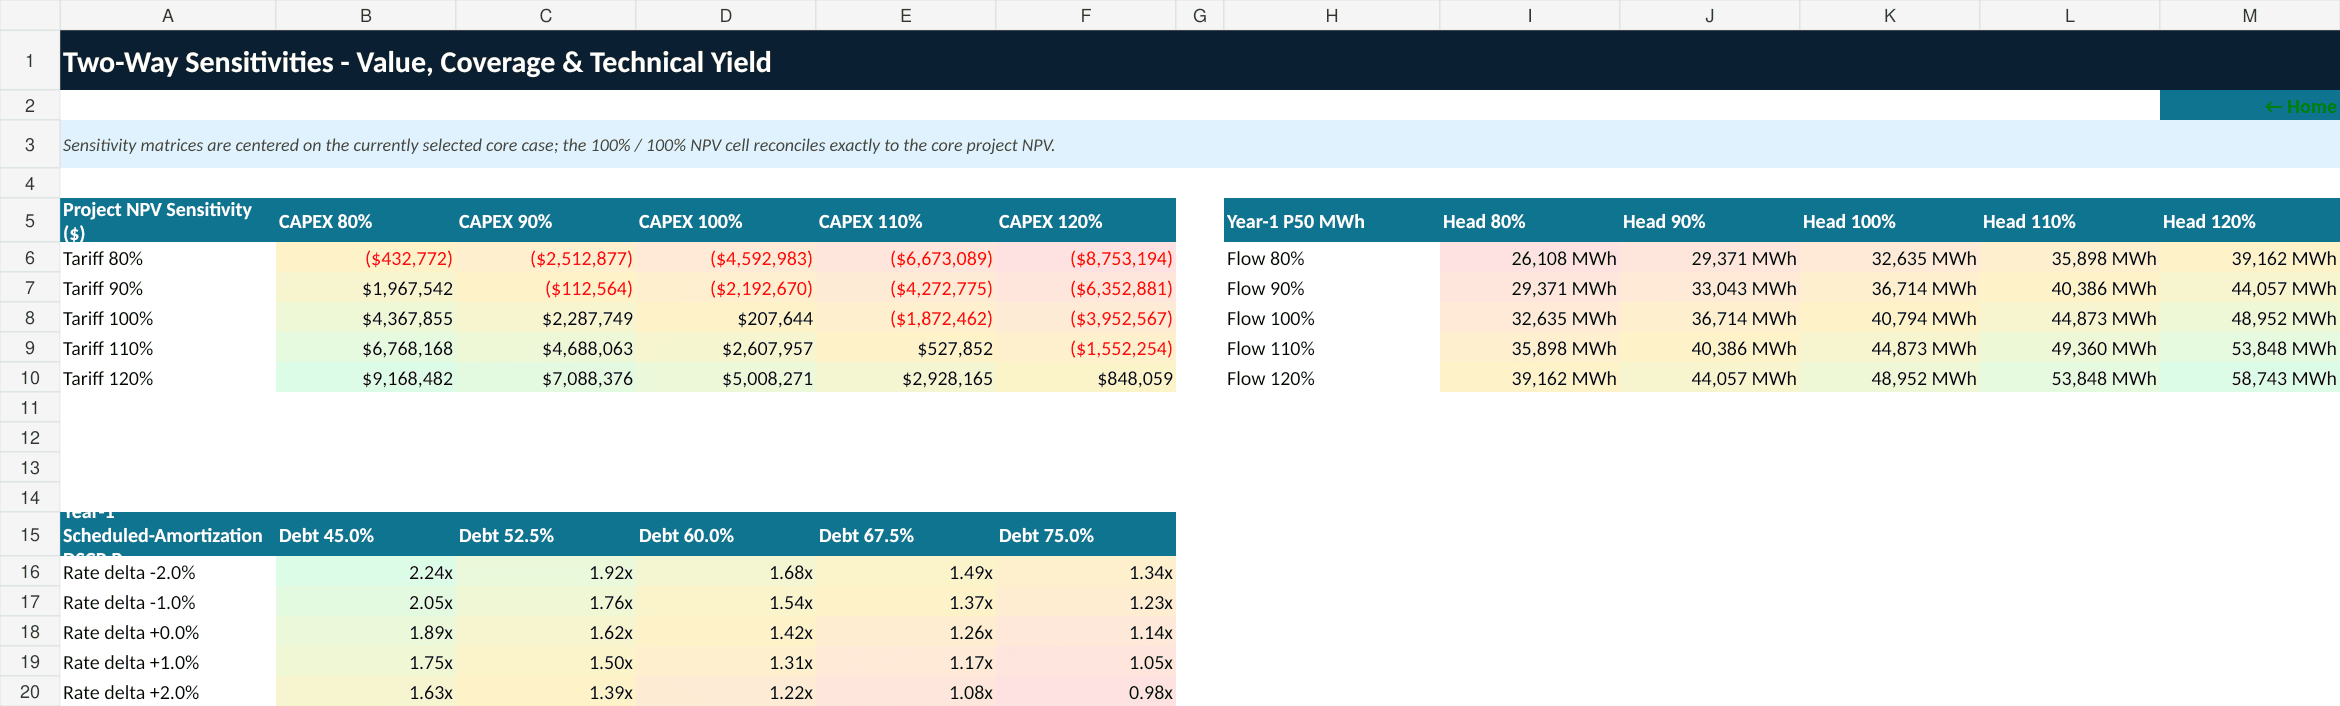
The Sensitivity Analysis includes three decision-useful two-way matrices:
- Project NPV: tariff versus CAPEX
- Year-1 P50 generation: flow versus head
- Year-1 scheduled-amortization DSCR proxy: debt percentage versus interest-rate change
The 100% tariff / 100% CAPEX center point reconciles to the core project NPV.
📈 Executive outputs and buyer-facing dashboards
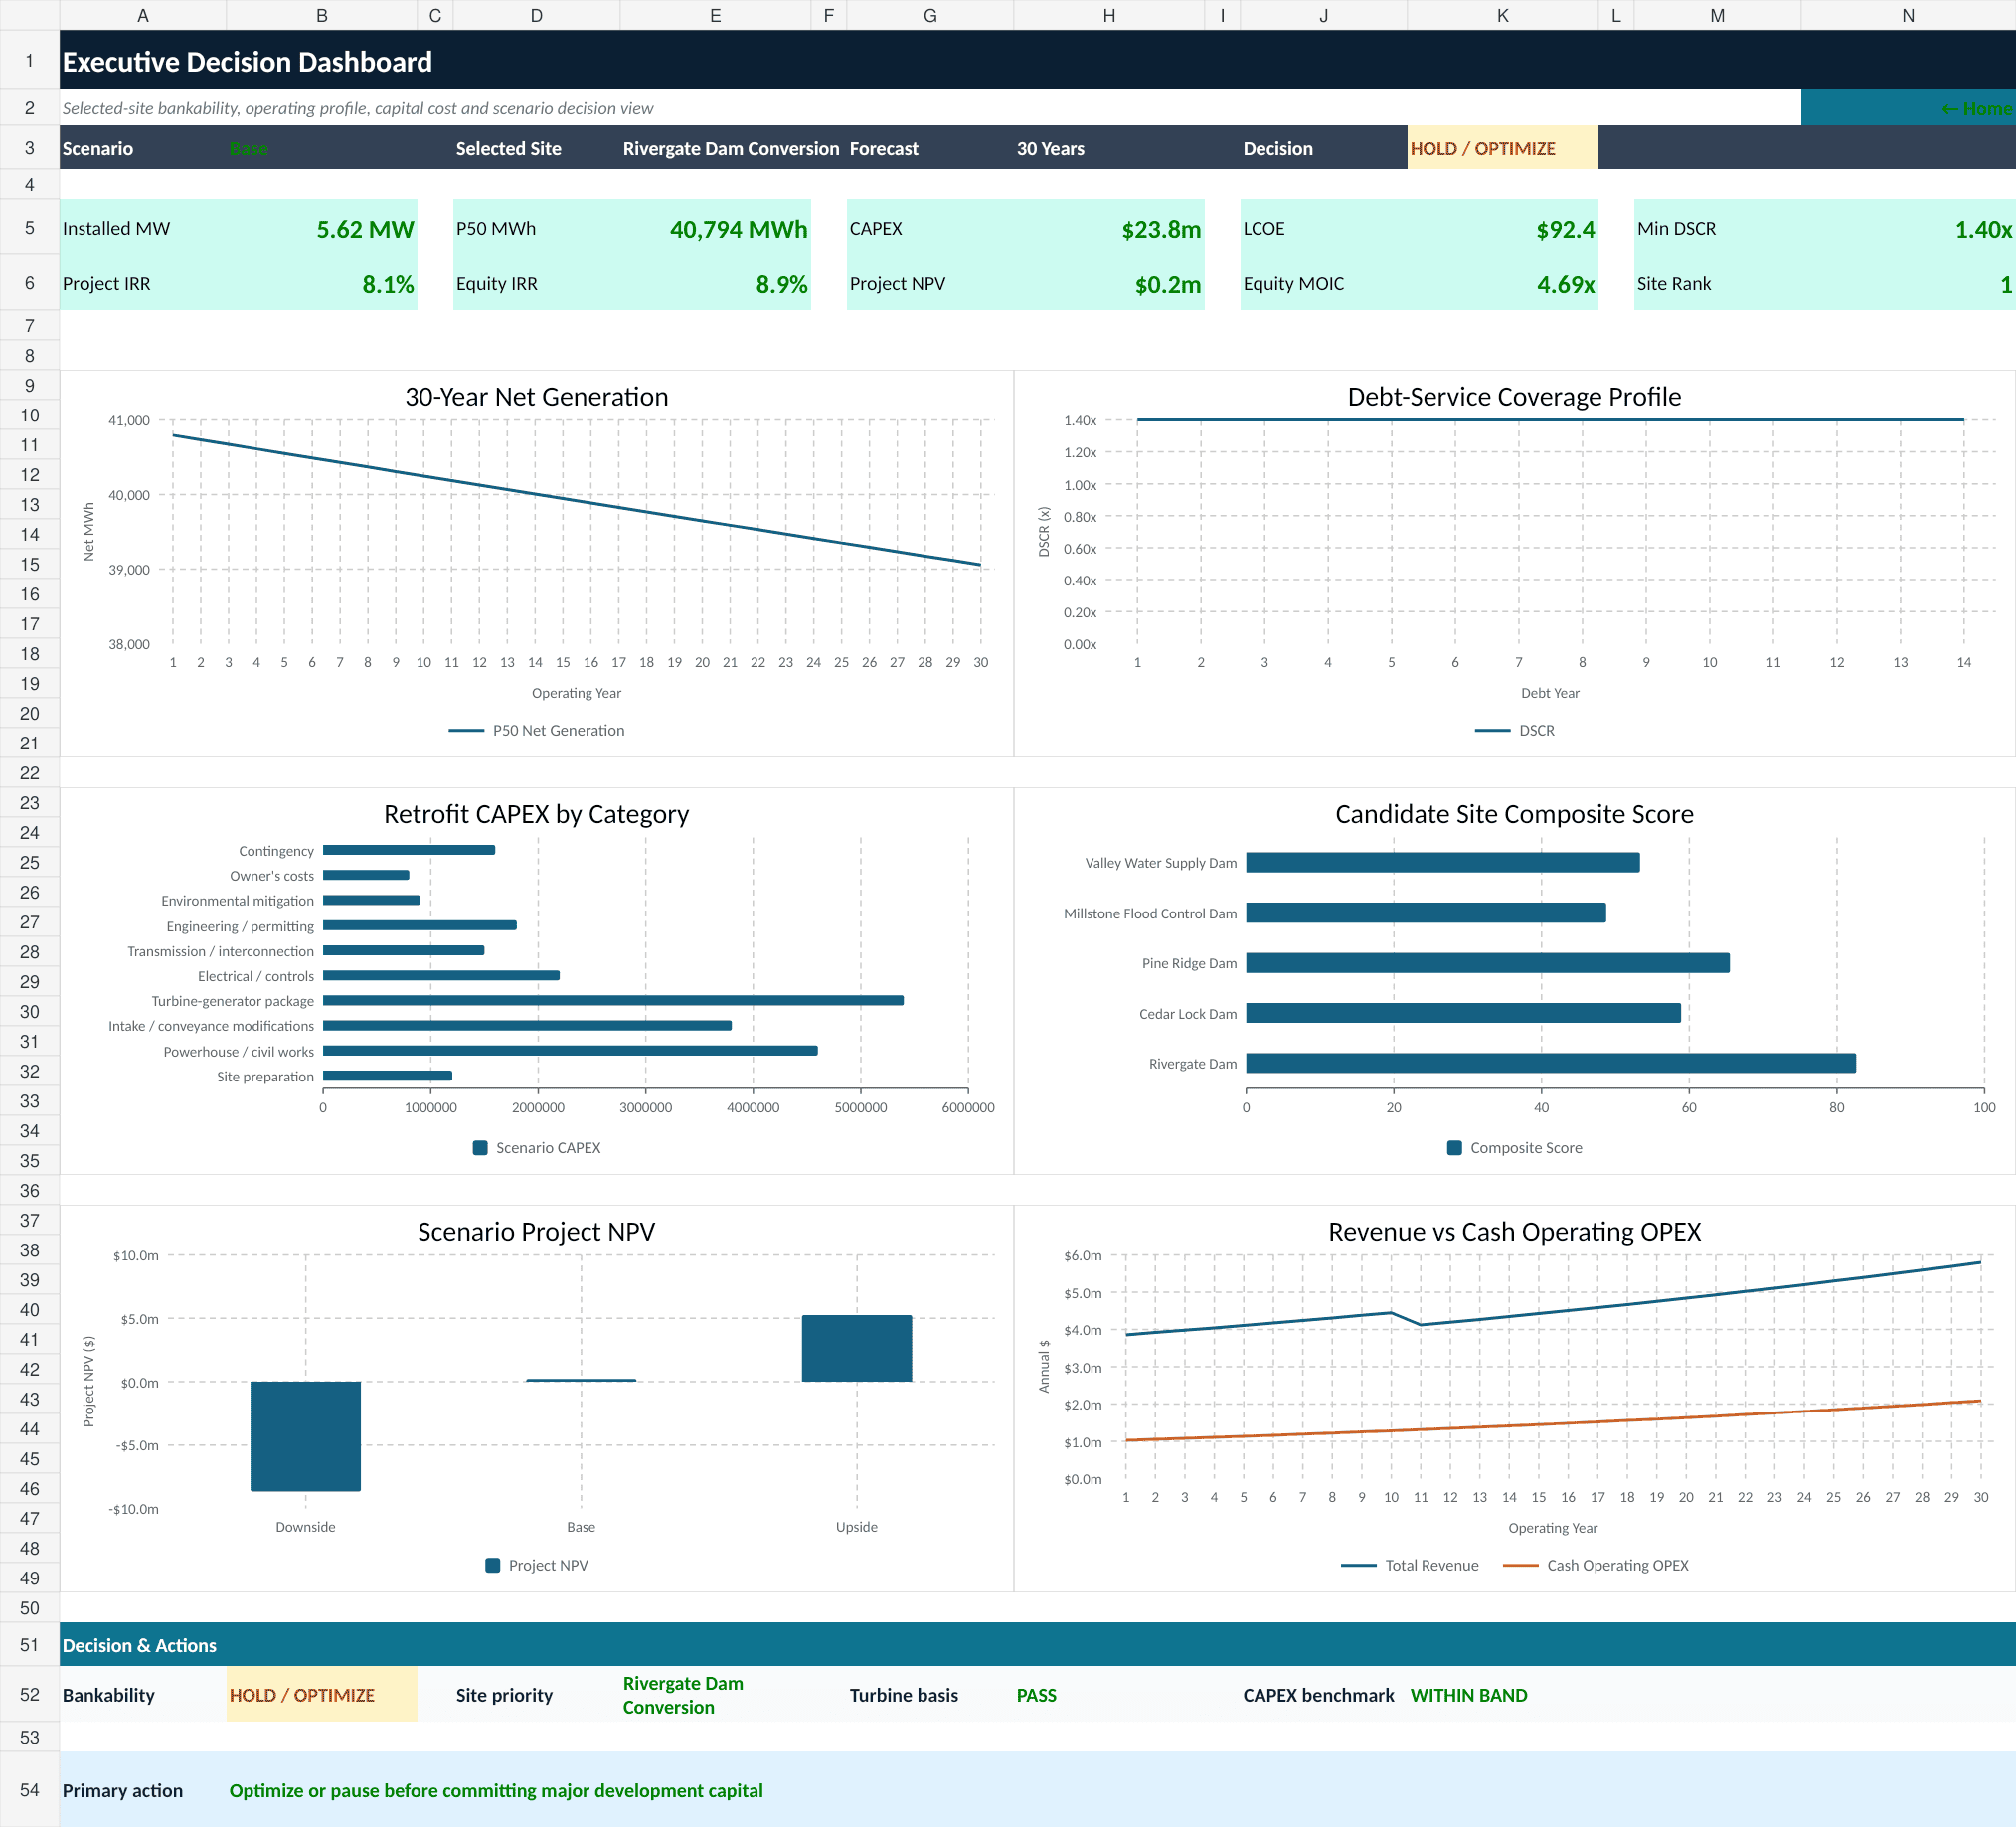
The Executive Summary and Executive Dashboard provide compact KPI cards and native Excel charts for installed MW, P50 MWh, CAPEX, LCOE, minimum DSCR, project IRR, equity IRR, project NPV, equity MOIC, site rank, long-term generation, debt-service coverage, CAPEX mix, candidate-site scores, scenario project NPV, and revenue versus cash OPEX.
A separate Site Ranking & Decision sheet prioritizes the candidate sites and provides a recommended development action. The included fictional demonstration case is intentionally decision-oriented rather than forced to show a positive outcome.
✅ Integrity and methodology
The workbook includes 30 model-integrity checks covering sources and uses, balance-sheet balancing, installed-MW recomputation, flow limits, operational bounds, P75/P90 ordering, debt behavior, DSCR, LCOE, NPV reconciliation, CAPEX allocation, construction-spend normalization, scenario selection, turbine selection, site-score bounds, cash liquidity, scenario and sensitivity reconciliation, technical input bounds, efficiency/availability, revenue share, financing bounds, working-capital days, lifecycle CAPEX timing, capacity factor, and effective scenario availability.
The Methodology & Sources sheet explains hydropower physics, hydrology treatment, generation cases, CAPEX methodology, debt logic, DSRA, return calculations, LCOE, site screening, workbook source references, and model-use disclosures.
🎯 Recommended use cases
- Non-powered dam conversion feasibility planning
- Candidate-dam screening and development prioritization
- 30-year generation and operating forecast
- PPA, merchant, renewable-attribute, capacity, and incentive revenue planning
- Retrofit CAPEX budgeting and benchmark comparison
- Construction cash-flow and funding planning
- OPEX, maintenance reserve, and lifecycle CAPEX planning
- Project-finance debt sizing, sculpting, DSCR, and DSRA analysis
- Liquidity, cash-flow, and sponsor-equity planning
- Profitability and integrated three-statement forecasting
- LCOE and bankability assessment
- Downside / Base / Upside scenario analysis
- Head, flow, CAPEX, tariff, leverage, and interest-rate sensitivity analysis
- Project and equity valuation using IRR, NPV, MOIC, and payback
- Investment-committee, lender, developer, or advisor decision support
👥 Intended users
This model is designed for hydropower developers, renewable and infrastructure investors, utilities, municipal or state dam owners, water authorities, project-development teams, financial advisors, transaction teams, lenders, consultants, and analysts evaluating an existing dam conversion opportunity.
📦 What is delivered
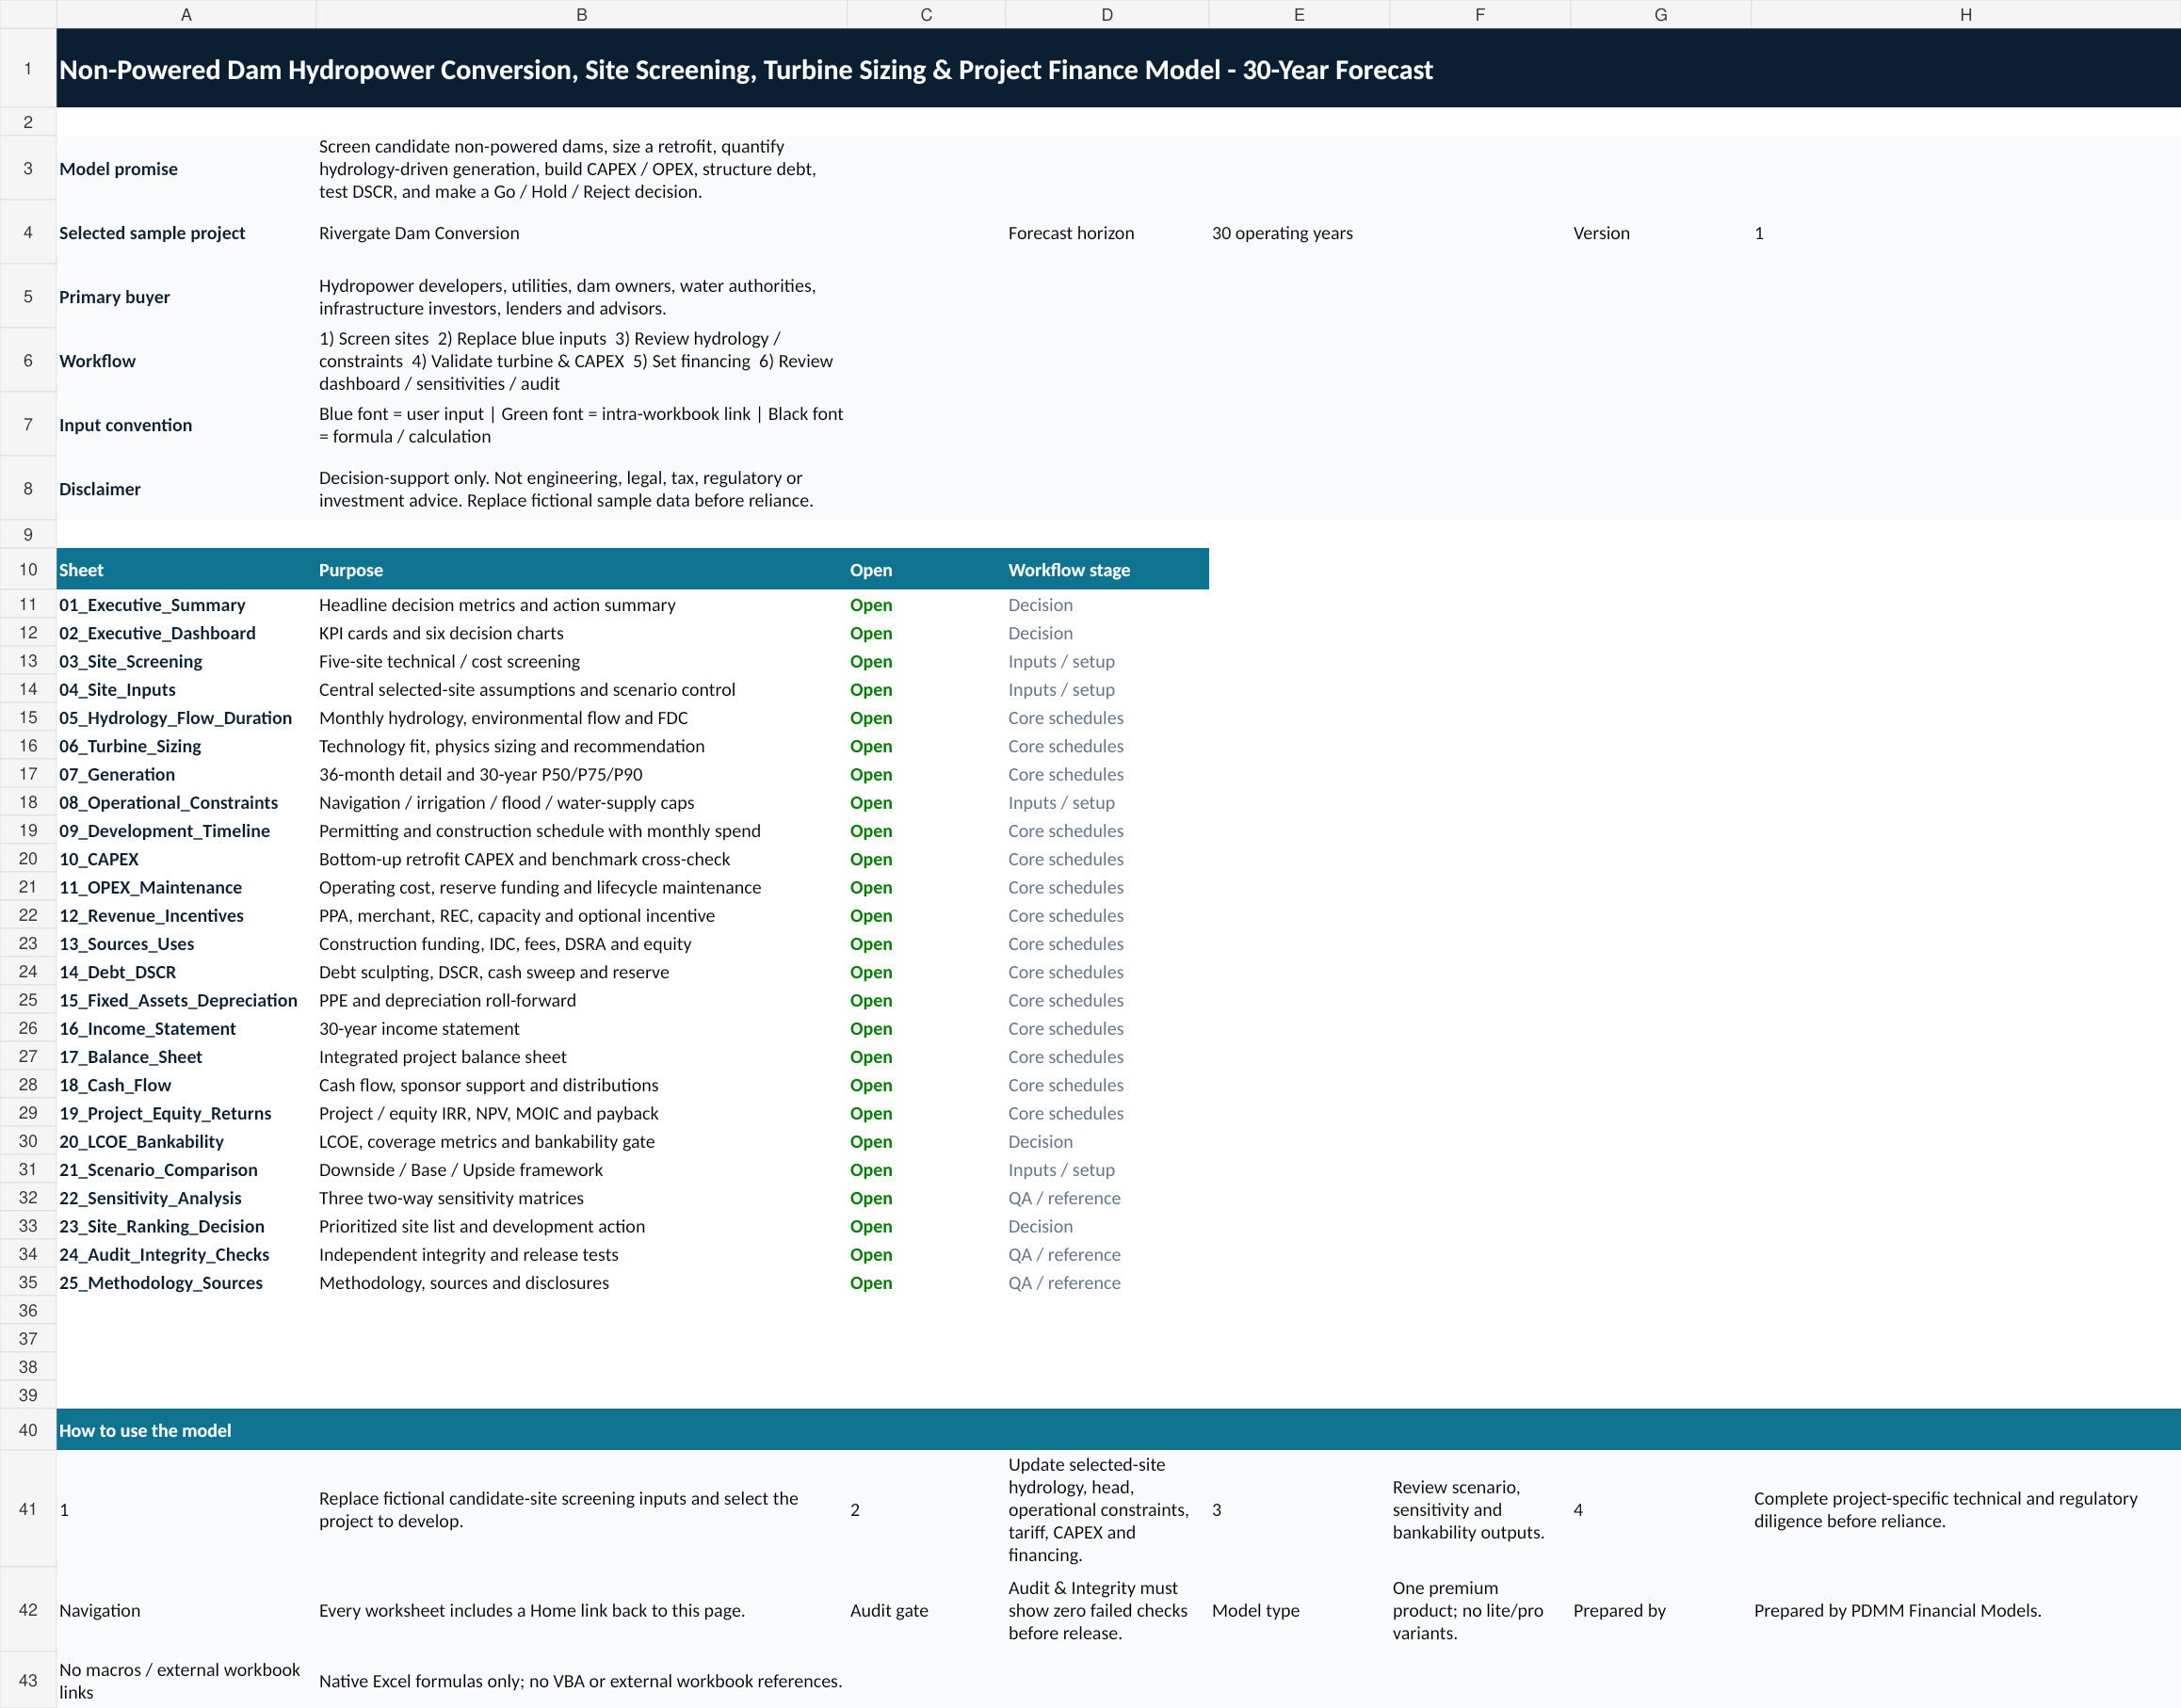
You receive the fully editable audited Excel workbook with 26 worksheets, centralized assumptions, replaceable fictional sample data, native Excel charts, linked financial statements, scenarios, sensitivities, decision outputs, methodology, sources, and integrity checks. The upload package also includes a full 26-page PDF preview and selected PNG previews for evaluating the model before purchase.
Similar ProductsOther customers were also interested in...



 eFinancialModels
Electric Vehicle (EV) Charging Station Financial M...
With this comprehensive 5- or 10-year monthly tool, investors can assess the viability of setting up... Read more

Financial Model for Mobile App | Mobile App Busine...
The Mobile App Financial Plan Template in Excel allows you to develop financial projections when lau... Read more

 HenrySheykin
Food Truck Financial Model Excel Template
The Food Truck Financial Model helps entrepreneurs, founders, business owners, consultants, and anal... Read more

Green Hydrogen Production from Wind Energy Financi...
The Green Hydrogen from Wind Financial Model aims to comprehensively forecast a horizon of 40 years ... Read more

Simple Mutual Non-Disclosure Agreement Template
Protect your business secrets with ease using our Simple Mutual Non-Disclosure Agreement Template. S... Read more

Solar Energy Financial Model
The Solar Energy Financial Model Spreadsheet Template in Excel assists you in preparing a sophistica... Read more

 Peter Graf
The Customer-Centric Financial Model for Restauran...
Starting a restaurant without a financial plan is like driving a car blindfolded. You wouldn´t do i... Read more
You must log in to submit a review.