
0 ITEMS

Landscaping Financial Model Excel Template
The Landscaping Service Financial Model helps users turn a landscaping business plan into a structured, editable financial forecast. It is designed for entrepreneurs, landscaping business owners, consultants, analysts, founders, and anyone preparing business plans, lender documents, investor materials, or internal budgets. Instead of starting from a blank spreadsheet, users can work from a ready-to-use model built around the realities of a landscaping service, including recurring maintenance plans, design and installation projects, enhancement services, seasonal cash flow patterns, startup investment, payroll, and ongoing operating expenses. This financial model template supports practical financial planning by connecting the main business drivers in one place. Users can adjust revenue assumptions, pricing, customer acquisition expectations, service mix, cost of goods sold, staffing needs, overhead, and capital expenditures to match their own business strategy. The model helps estimate startup costs, project operating expenses, forecast cash flow, review profitability, and evaluate how quickly the business may reach break-even. This makes it useful for both new landscaping companies and established operators planning expansion, equipment purchases, new service lines, or funding conversations. The template is especially helpful for decision-making because it allows users to see how changes in assumptions affect financial outcomes. A landscaping service may depend on recurring customer contracts, project-based work, material costs, labor efficiency, seasonal demand, and marketing performance, so the model gives users a more organized way to test different possibilities before committing capital. It can help answer important questions such as how much funding is needed, whether pricing supports healthy margins, what payroll level the business can afford, and how revenue growth impacts cash reserves. Built for professional use, the Landscaping Service Financial Model includes editable assumptions, forecast outputs, visual reporting, scenario analysis, performance metrics, and investor-ready financial statements. It can be used in Microsoft Excel or Google Sheets, making it accessible for individual founders, finance teams, advisors, and collaborative planning. Whether the goal is to launch a new landscaping company, prepare a loan application, pitch investors, evaluate profitability, or manage growth more confidently, this template provides a practical framework for organizing the numbers and making better financial decisions.
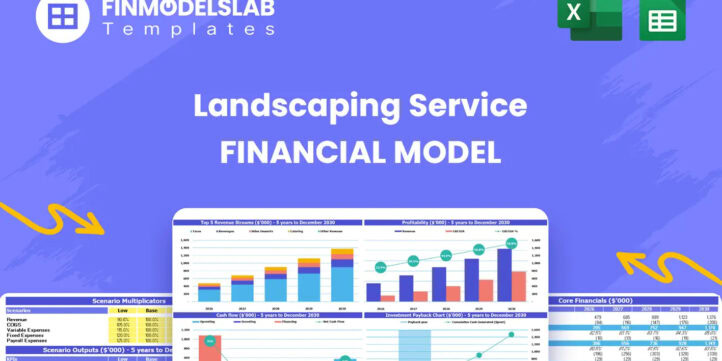


Financial Model Overview
The Landscaping Service Financial Model is a ready-to-use financial model template built to help entrepreneurs, business owners, consultants, analysts, and founders plan, evaluate, and present the financial outlook of a landscaping business. It brings together the key assumptions needed to forecast revenue, startup costs, operating expenses, payroll, cash flow, profitability, break-even timing, and funding requirements in one structured workbook. For a landscaping service, financial planning is especially important because revenue can come from several sources, including recurring maintenance plans, premium service packages, one-time design and installation work, and seasonal enhancement services. Costs can also vary significantly based on labor, materials, equipment, fuel, marketing, insurance, and the timing of customer demand. This template gives users a practical way to replace guesswork with clear assumptions, automated calculations, and professional outputs that can support business planning, investor discussions, lender presentations, internal budgeting, and growth decisions.
All-in-One Dashboard
The all-in-one dashboard gives users a central view of the most important inputs and outputs in the Landscaping Service Financial Model. This component is designed to make the model easier to navigate by bringing key assumptions, financial results, and performance indicators into one place. Users can review high-level revenue forecasts, expense expectations, cash flow movement, profitability trends, and business performance without having to search through multiple tabs. It may draw from inputs such as customer volume, pricing, service mix, payroll assumptions, overhead costs, startup investment, and financing decisions, then summarize the resulting outputs in a clean and practical format. For founders and business owners, the dashboard is useful because it turns a detailed spreadsheet into a decision-making tool. It helps users quickly understand whether the landscaping service is on track, where profitability is improving, whether cash reserves are adequate, and which assumptions may need to be adjusted before presenting the plan to lenders, investors, partners, or internal stakeholders.
Low, Base, and High Scenario Analysis
The low, base, and high scenario analysis section helps users test how the landscaping business may perform under different operating conditions. A landscaping service can be affected by market demand, customer acquisition costs, seasonality, labor availability, material pricing, project conversion rates, and competitive pricing pressure, so a single forecast is often not enough for reliable planning. This component allows users to compare a conservative case, an expected case, and an optimistic case by adjusting major assumptions such as new customer growth, average project value, recurring maintenance plan adoption, marketing efficiency, gross margin, operating expenses, and staffing requirements. The outputs may show how each scenario affects revenue, EBITDA, profit margins, cash flow, funding needs, and return expectations. This is useful for budgeting and risk management because it helps users prepare contingency plans, set realistic targets, and understand which assumptions have the greatest impact on financial performance. It also strengthens funding materials by showing investors and lenders that the business plan has been tested beyond a single best-case projection.
Professional Charts and Visual Reports
The professional charts and visual reports component turns the model’s financial projections into presentation-ready visuals. Landscaping business plans often involve many moving parts, including multiple revenue streams, recurring customer contracts, project-based sales, payroll growth, material costs, equipment investment, and seasonal cash flow patterns. Charts help simplify these details by showing trends in a format that is easier for stakeholders to understand. This section may include visual summaries of revenue growth, expense categories, gross margin, EBITDA, cash balance, net income, customer growth, and service mix over the forecast period. The purpose is not only to make the financial model more polished, but also to help users spot patterns and explain the business story more clearly. For example, a chart may show when recurring maintenance revenue begins to stabilize cash flow, when project revenue accelerates growth, or when higher utilization improves margins. These visual outputs are useful for pitch decks, funding discussions, board updates, partner meetings, and internal reviews where decision-makers need quick insight rather than raw spreadsheet data.
ROE Components and DuPont Analysis
The ROE components and DuPont analysis section helps users examine the drivers behind return on equity and overall financial performance. Rather than looking only at the final profit number, this component breaks performance into underlying elements such as profitability, asset efficiency, and leverage. For a landscaping service, this can be valuable because returns may be influenced by how effectively the business uses equipment, how well it manages labor productivity, how much margin it earns on maintenance plans and installation projects, and how financing decisions affect equity returns. Inputs may include net income, revenue, total assets, equity, debt, operating margin, and asset turnover. The outputs help users understand whether returns are being driven by strong operations, efficient use of assets, or financial leverage. This is useful for owners and investors because it provides a more analytical view of business quality. It can support decisions about buying versus leasing equipment, expanding crews, investing in vehicles, adjusting pricing, or changing the service mix to improve returns over time.
Revenue Inputs and Assumption Planning
The revenue inputs and assumption planning section is where users define the commercial engine of the landscaping service. This component allows users to input and customize the assumptions that drive sales, including pricing, customer acquisition, marketing spend, conversion rates, recurring plan adoption, project frequency, average project value, and service package mix. A landscaping company may generate income from basic maintenance plans, premium maintenance packages, all-inclusive services, design and installation projects, and enhancement services such as seasonal planting, lighting, irrigation upgrades, mulch installation, or cleanup work. By organizing these assumptions clearly, the model helps users build a revenue forecast that reflects how the business actually operates. Outputs may include monthly and annual revenue projections, customer count growth, average revenue per customer, recurring revenue, project-based revenue, and total sales by period. This section is useful because it connects business strategy with financial results. Users can test whether marketing spend produces enough customers, whether pricing supports margin goals, and whether recurring maintenance revenue is sufficient to create a stable base for growth.
Bank-Ready Financial Reports
The bank-ready financial reports section provides structured financial outputs that can support lender reviews, funding applications, investor discussions, and professional business planning. Lenders and investors typically want to see more than a simple revenue estimate. They expect organized statements that show profitability, cash flow, balance sheet movement, debt capacity, capital needs, and the assumptions behind the forecast. This component may include projected profit and loss statements, cash flow statements, balance sheets, debt schedules, operating summaries, and key financial metrics over a multi-year period. For a landscaping service seeking financing for trucks, trailers, mowers, tools, storage space, working capital, or expansion, these reports help present the business in a credible and understandable format. Inputs from the rest of the model, such as startup costs, revenue assumptions, payroll, overhead, COGS, loan terms, and capital expenditures, flow into the reports automatically. This makes the template useful for preparing loan packages, investor materials, partnership reviews, and internal financial plans without building reports manually from scratch.
Revenue Breakdown by Service Stream
The revenue breakdown by service stream section gives users a detailed view of how different landscaping services contribute to total revenue. This is important because not all revenue has the same margin profile, seasonality, operational complexity, or growth potential. Recurring maintenance plans may provide steady monthly revenue and improve cash flow visibility, while design and installation projects may generate larger one-time revenue but require more materials, scheduling, labor coordination, and project management. Enhancement services may provide valuable upsell opportunities and improve customer lifetime value. This component allows users to separate and review revenue streams such as basic maintenance, premium maintenance, all-inclusive maintenance, design and installation projects, and seasonal enhancements. Inputs may include pricing, number of customers, project volume, service frequency, conversion rates, and expected growth by category. Outputs may show revenue by stream, contribution to total sales, growth trends, and the changing mix of recurring and non-recurring revenue. This helps users identify which services are driving growth, which may need pricing adjustments, and where sales efforts should be focused to improve profitability.
KPI Dashboard and Benchmark Tracking
The KPI dashboard and benchmark tracking section helps users monitor the performance metrics that matter most for a landscaping service. While financial statements show the overall results, KPIs help explain whether the business is operating efficiently and whether the plan is realistic compared with industry expectations. This component may track metrics such as gross margin, EBITDA margin, net profit margin, customer acquisition cost, customer count, average revenue per customer, recurring revenue share, labor cost as a percentage of revenue, COGS percentage, cash balance, payback period, and return metrics. It can also help users compare projected performance against internal targets or industry benchmarks. Inputs are drawn from the revenue forecast, cost structure, payroll plan, marketing assumptions, and financial statements, while the outputs provide a concise performance view. This is useful for ongoing management because it helps owners quickly identify problems and opportunities. For example, if customer acquisition cost rises too high, margins fall below target, or labor costs grow faster than revenue, the dashboard can signal that the business plan needs adjustment before cash flow or profitability is affected.
Startup Cost and CAPEX Planning
The startup cost and CAPEX planning section helps users estimate the upfront investment required to launch or expand a landscaping service. This is a critical component because landscaping businesses often require meaningful initial spending before revenue begins, especially for work trucks, trailers, commercial mowers, trimmers, blowers, hand tools, storage or warehouse setup, office equipment, software, licenses, insurance deposits, uniforms, branding, initial marketing, and working capital. Users can customize these inputs to match their own launch plan, equipment strategy, location, team size, and service offering. The outputs help calculate total startup funding needs, timing of capital expenditures, depreciation assumptions, and the amount of cash required before the business becomes self-sustaining. This section is useful for budgeting, fundraising, and lender conversations because it provides a clear explanation of where startup capital will be used. It can also help users compare purchasing equipment upfront versus leasing, delaying certain investments, or scaling operations in phases to preserve cash while still building the capacity needed to serve customers effectively.
Break-Even Analysis
The break-even analysis section helps users estimate when the landscaping service may generate enough revenue to cover its costs and move toward sustainable profitability. This component uses assumptions from the revenue forecast, cost of goods sold, payroll plan, fixed overhead, variable expenses, and pricing structure to calculate the point at which the business stops operating at a loss. For a landscaping company, break-even planning is especially useful because costs such as labor, equipment, insurance, fuel, rent, software, and marketing can begin before the customer base is fully developed. The outputs may include break-even revenue, break-even timing, contribution margin, monthly profit movement, and the level of customer activity needed to cover expenses. This helps users understand whether their pricing, sales targets, and operating cost structure are realistic. It also supports decision-making by showing how changes in service mix, customer growth, labor efficiency, material costs, or marketing performance can accelerate or delay profitability. For funding discussions, break-even analysis provides a clear milestone that investors and lenders can use to evaluate business viability.
File types:
Excel – Single-User: .xlsx
Excel – Multi-User: .xlsx
Similar ProductsOther customers were also interested in...



 Andreas
AgroTech Services Financial Model (10+ Yrs. DCF an...
The AgroTech Services Financial Model with DCF (Discounted Cash Flow) and Valuation is a comprehensi... Read more
 HenrySheykin
Spa Financial Model Excel Template
The Spa Financial Model helps entrepreneurs, spa owners, consultants, analysts, and business planner... Read more
Cattle Farming Financial Model Excel Template
The Cattle Farming Financial Model helps users turn a cattle farm concept, expansion plan, or fundin... Read more
Cafe Financial Model Excel Template
The Cafe Financial Model is a ready-to-use financial model template designed to help entrepreneurs, ... Read more
Car Wash Service Financial Model Excel Template
The Car Wash Financial Model is a ready-to-use financial model template designed to help entrepreneu... Read more
Nail Salon Financial Model Excel Template
The Nail Salon Financial Model Financial Model Template helps entrepreneurs, salon owners, consultan... Read more
Outpatient Clinic Financial Model Excel Template
The Outpatient Clinic Financial Model helps users turn a clinic business concept into a structured, ... Read more
Skin Care Financial Model Excel Template
The Skin Care Clinic Financial Model helps entrepreneurs, clinic owners, consultants, analysts, and ... Read more
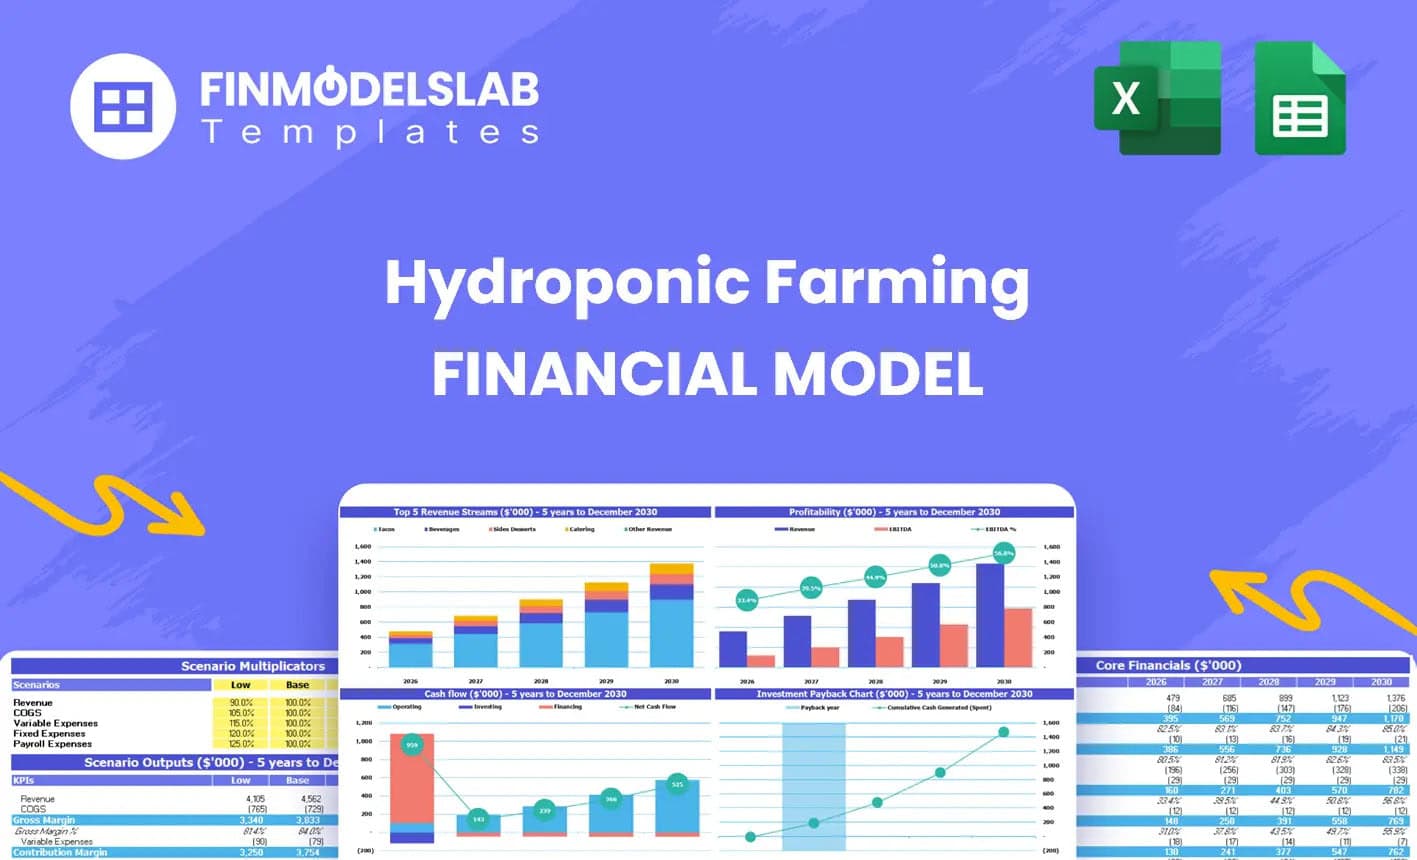
Hydroponics Financial Model Excel Template
The Hydroponic Farming Financial Model helps entrepreneurs, growers, consultants, analysts, and busi... Read more

Freight Brokerage Financial Model Excel Template
The Freight Brokerage Financial Model Financial Model Template helps entrepreneurs, founders, busine... Read more
You must log in to submit a review.