
0 ITEMS

CRE Bridge Loan Pricing and Lender Yield Model (SOFR Floor, Future Funding, Extension and Exit Fees, Back-Leverage IRR)
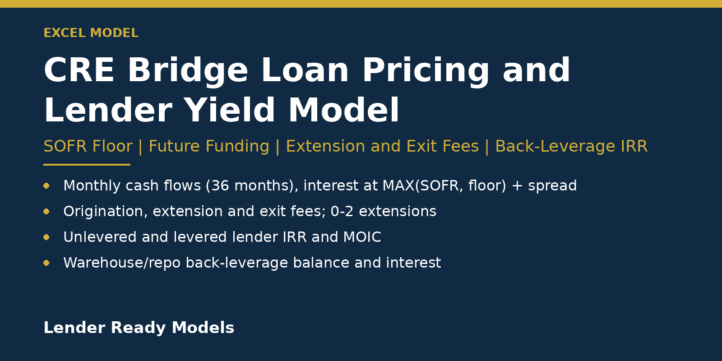
A lender-side Excel model for pricing a floating-rate commercial real estate bridge loan month by month.
| Financial Model, Real Estate |
| Excel, IRR (Internal Rate of Return), Levered Yield, Loans, Pricing, Scenario Analysis |
A lender-side Excel model for pricing a floating-rate commercial real estate bridge loan month by month.
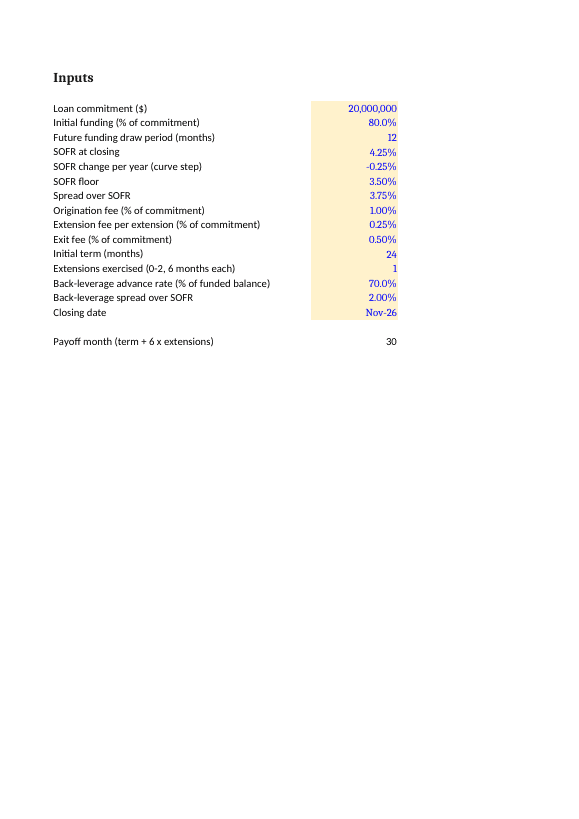
- Inputs: commitment, initial funding %, future-funding draw period, SOFR at close and annual curve step, SOFR floor, spread, origination / extension / exit fees, initial term and extensions (0-2 x 6 months), back-leverage advance rate and spread.
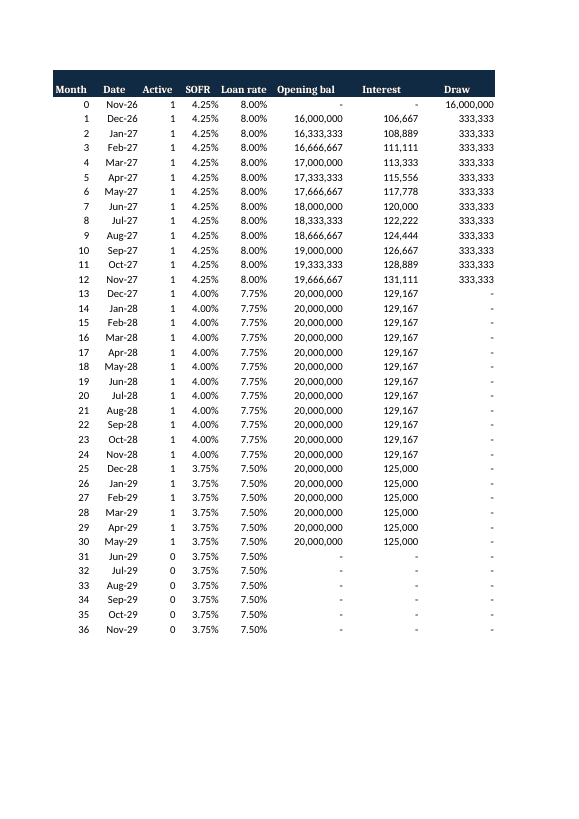
- Monthly cash flows (36 months): opening balance, interest at MAX(SOFR, floor) + spread, draws, fees, payoff, closing balance; warehouse/repo back-leverage balance and interest.
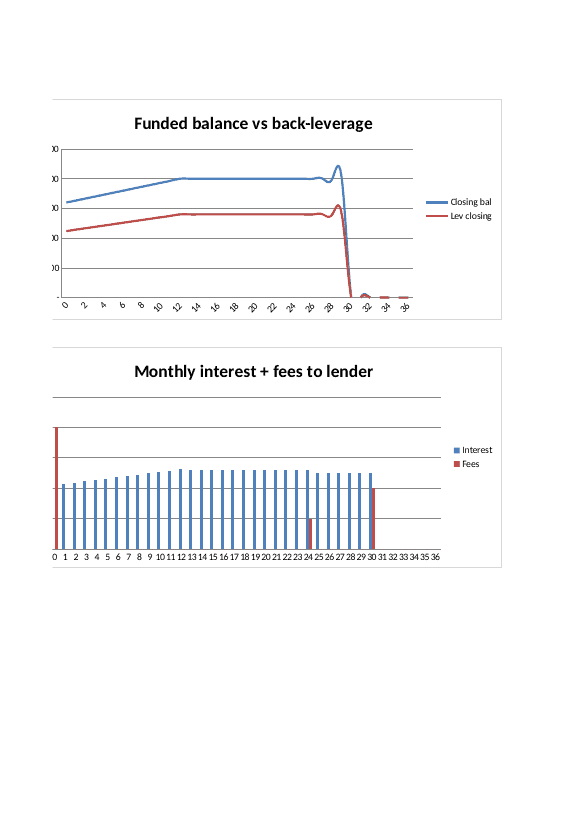
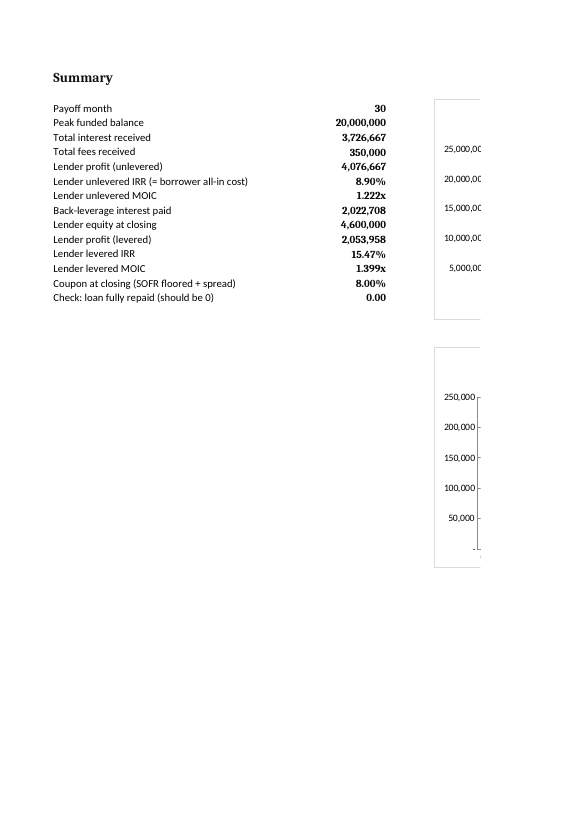
- Summary: payoff month, peak funded balance, total interest and fees, unlevered lender IRR and MOIC (equal to the borrower’s all-in cost), levered IRR and MOIC, lender equity at close, repayment check. Two charts.
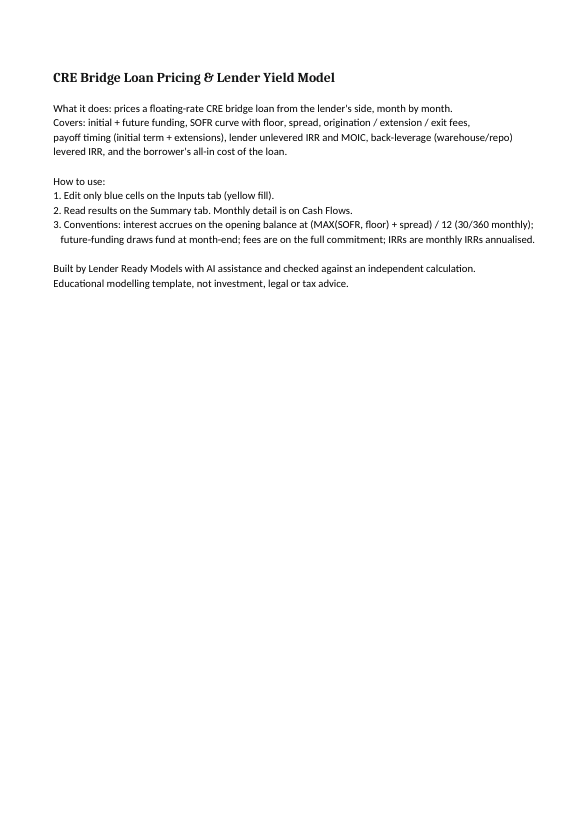
- Conventions documented on the Start Here tab (30/360 monthly accrual, month-end draws, fees on commitment).
Built with AI assistance and checked against an independent calculation. Educational template, not investment advice.
What the model is used for
Working out what a floating-rate bridge loan earns the lender, and costs the borrower, once the floor, fees, future funding and extension timing are combined, with and without back-leverage.
Tabs and structure
- Start Here: scope, steps and conventions.
- Summary: 14 outputs and two charts (funded balance vs back-leverage; monthly interest and fees).
- Inputs: 15 blue cells on yellow, plus the calculated payoff month.
- Cash Flows: months 0 to 36 in 16 columns, including dates, SOFR, loan rate, and unlevered and levered lender cash flow.
Key inputs
Loan commitment, initial funding %, future funding draw period, SOFR at closing, SOFR change per year, SOFR floor, spread, origination, extension and exit fees, initial term, extensions exercised (whole number, 0 to 2), back-leverage advance rate and spread, closing date.
Outputs
Payoff month, peak funded balance, total interest received, total fees received, unlevered and levered lender profit, IRR and MOIC, back-leverage interest paid, lender equity at closing, coupon at closing, and a check that the loan is fully repaid (should be 0).
How to use it
Edit only the blue cells on Inputs, read results on Summary, and review monthly detail on Cash Flows. IRRs are monthly IRRs annualised.
File and limitations
One .xlsx workbook, no macros. Sample figures are fictional. Built with AI assistance and checked for formula errors. Not investment, legal or tax advice.
Similar ProductsOther customers were also interested in...



 eFinancialModels
Electric Vehicle (EV) Charging Station Financial M...
With this comprehensive 5- or 10-year monthly tool, investors can assess the viability of setting up... Read more

Financial Model for Mobile App | Mobile App Busine...
The Mobile App Financial Plan Template in Excel allows you to develop financial projections when lau... Read more

 HenrySheykin
Food Truck Financial Model Excel Template
The Food Truck Financial Model helps entrepreneurs, founders, business owners, consultants, and anal... Read more

Green Hydrogen Production from Wind Energy Financi...
The Green Hydrogen from Wind Financial Model aims to comprehensively forecast a horizon of 40 years ... Read more

Simple Mutual Non-Disclosure Agreement Template
Protect your business secrets with ease using our Simple Mutual Non-Disclosure Agreement Template. S... Read more

Solar Energy Financial Model
The Solar Energy Financial Model Spreadsheet Template in Excel assists you in preparing a sophistica... Read more

 Peter Graf
The Customer-Centric Financial Model for Restauran...
Starting a restaurant without a financial plan is like driving a car blindfolded. You wouldn´t do i... Read more
You must log in to submit a review.