
0 ITEMS

Biotech & Pharma rNPV Valuation Model Excel – 20-Year Drug Pipeline DCF, Clinical PoS & Funding
20-year Excel biotech valuation model for 15 drug candidates with stage-based clinical PoS, asset rNPV, licensing and commercialization revenue, three-statement forecasts, 60-month runway, dilution, scenarios and 8 dashboard charts. Includes a 26-page PDF guide.


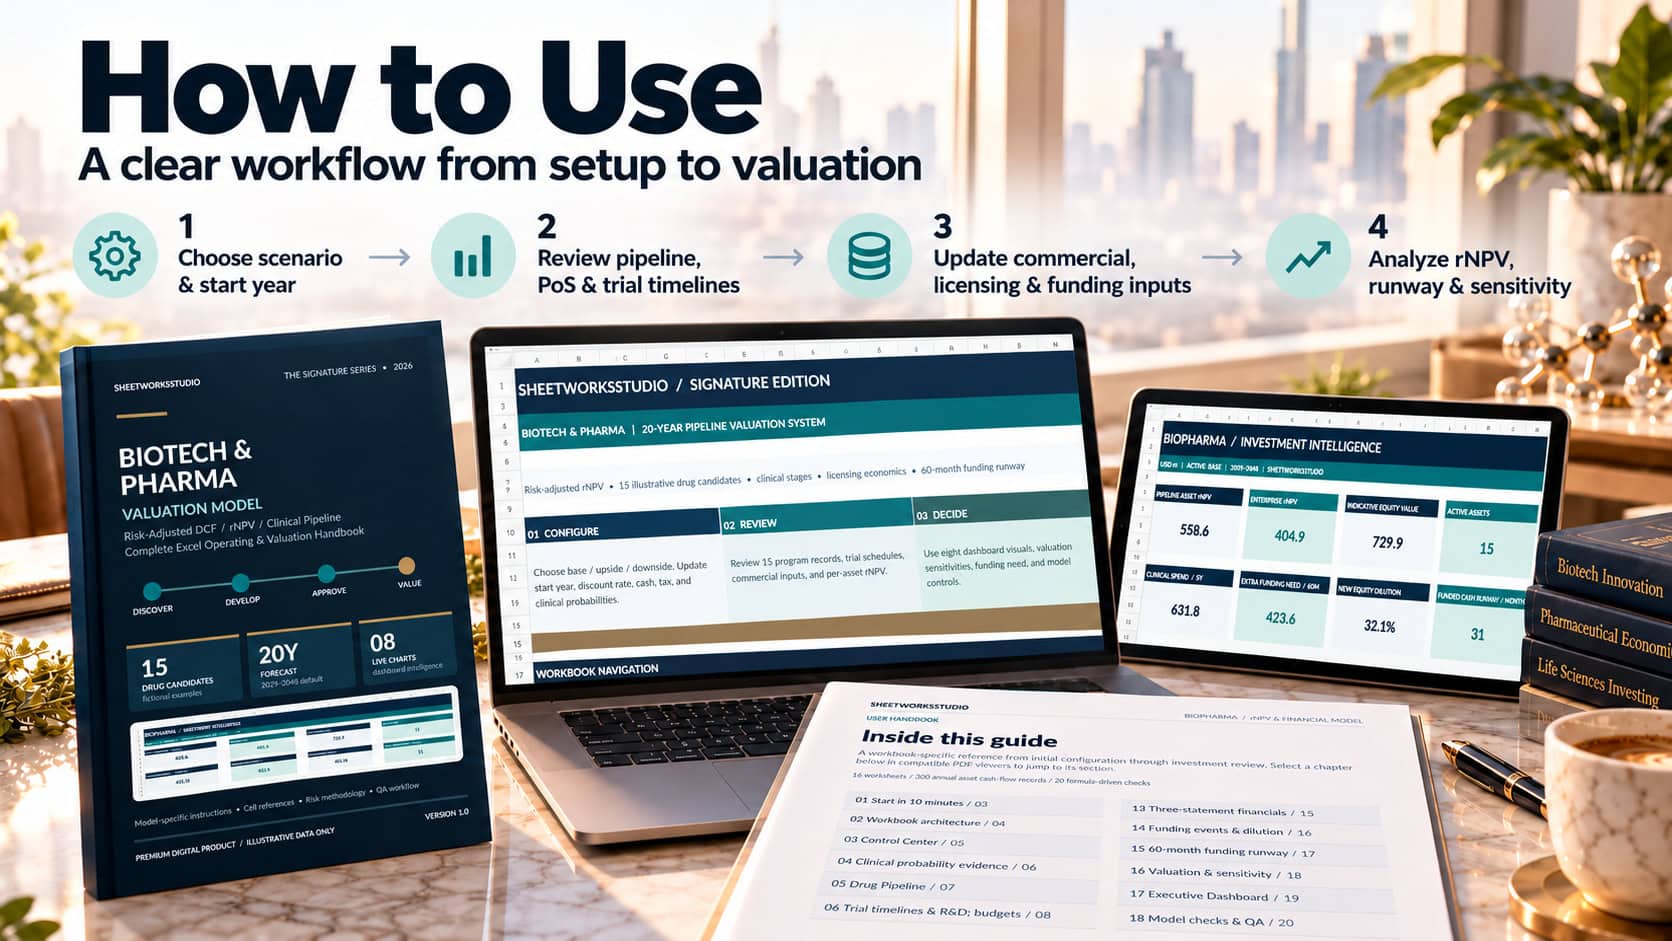


20-Year Risk-Adjusted DCF / rNPV | Clinical Pipeline | Funding & Equity Dilution
Value drug development programs, assess clinical risk and translate a multi-asset pipeline into transparent financial and financing forecasts.
The Biotech & Pharma Valuation Model – Signature Edition by SheetworksStudio is an integrated, editable Excel valuation system for biotechnology founders, pharmaceutical finance teams, corporate-development professionals, analysts, investment teams and life sciences advisors.
The workbook combines phase-specific Probability of Success (PoS), development spending, product commercialization, licensing terms, company financial forecasts, a five-year monthly funding plan and equity dilution into one connected framework.
Instead of applying a blanket clinical haircut, risk-adjusted research spending is weighted by the probability of reaching future stages and commercial revenues by the modeled probability of approval.
The purchase includes 16 Excel worksheets, 15 illustrative drug candidates, 20 annual forecast periods, 60 months of cash-runway planning, three operating scenarios, eight Excel dashboard charts and a 26-page PDF handbook.
🧬 CLINICAL PIPELINE & RISK-ADJUSTED VALUATION
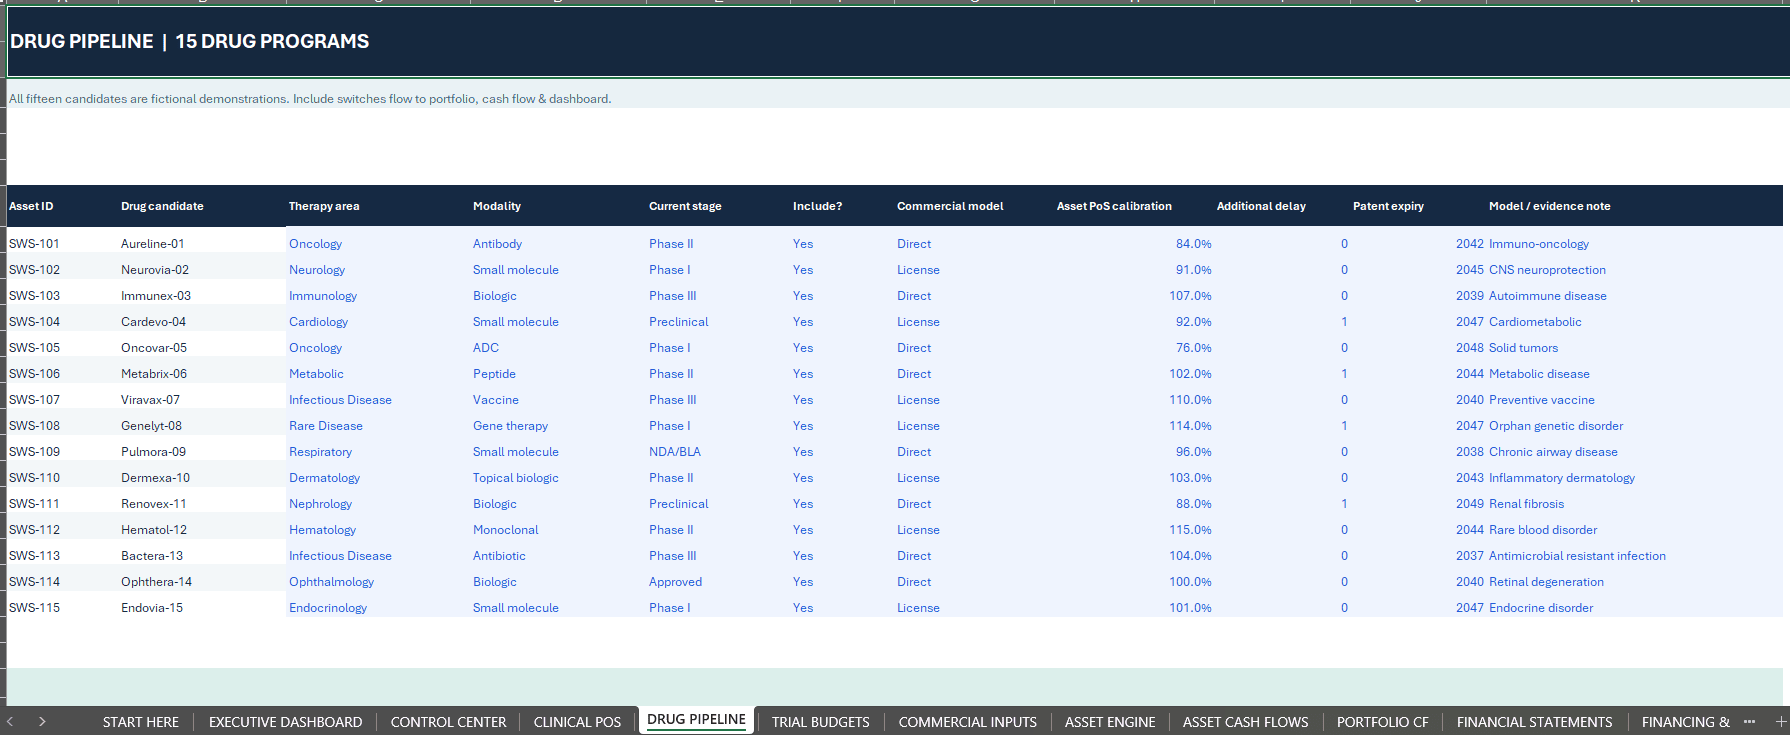
Analyze 15 individual drug candidates with editable development-stage, modality, therapeutic area, risk calibration and commercial assumptions.
Key features include:
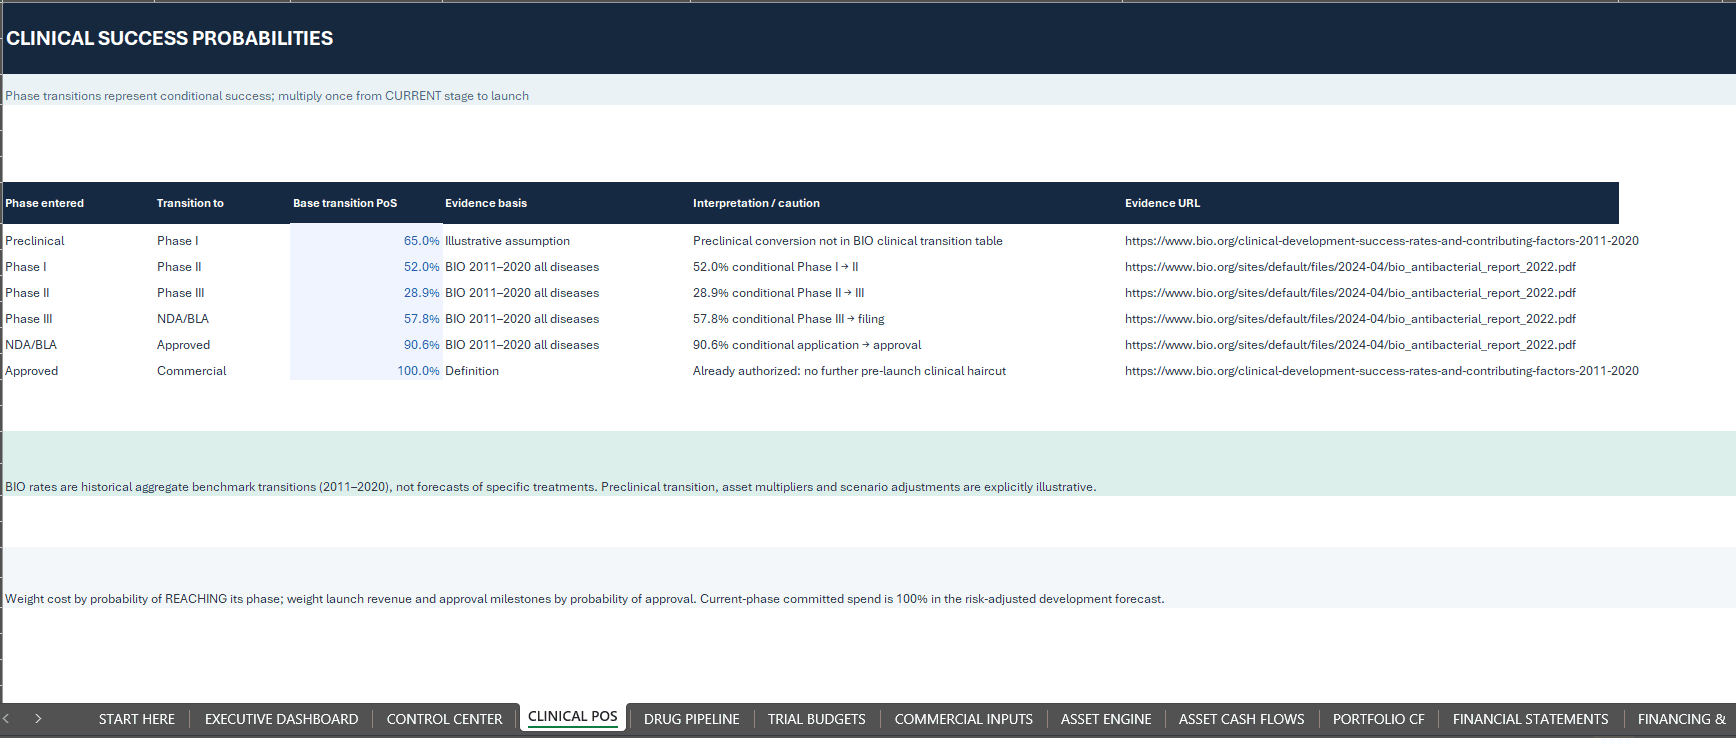
- Preclinical, Phase I, Phase II, Phase III, NDA/BLA and Approved stages
- Conditional stage-transition PoS and cumulative approval probability
- Candidate-level clinical probability adjustments
- Stage duration, remaining R&D spending and expected launch timing
- Patent expiration and post-exclusivity revenue erosion
- Discounted risk-adjusted cash flow and asset rNPV
- Unrisked NPV comparisons and consolidated pipeline valuation
The CLINICAL POS worksheet contains historical benchmark rates and source notes.
These clinical probability assumptions must be independently reviewed and adapted to the relevant therapeutic indication and development program.
💊 COMMERCIALIZATION & LICENSING ECONOMICS
Select Direct Commercialization or Licensing for each drug candidate.
Direct Commercialization
Model eligible patient populations, annual net treatment price, peak market penetration, commercial adoption ramp, annual price growth, product costs, selling expenses and patent-expiry erosion.
Licensing
Model upfront payments, approval and sales milestones, sales-trigger assumptions and recurring royalty economics.
Contingent income is weighted according to the workbook’s clinical probability conventions.
Each asset feeds into the 20-year investment forecast and consolidated portfolio calculations.
📊 FINANCIAL FORECASTS & INVESTMENT DASHBOARD
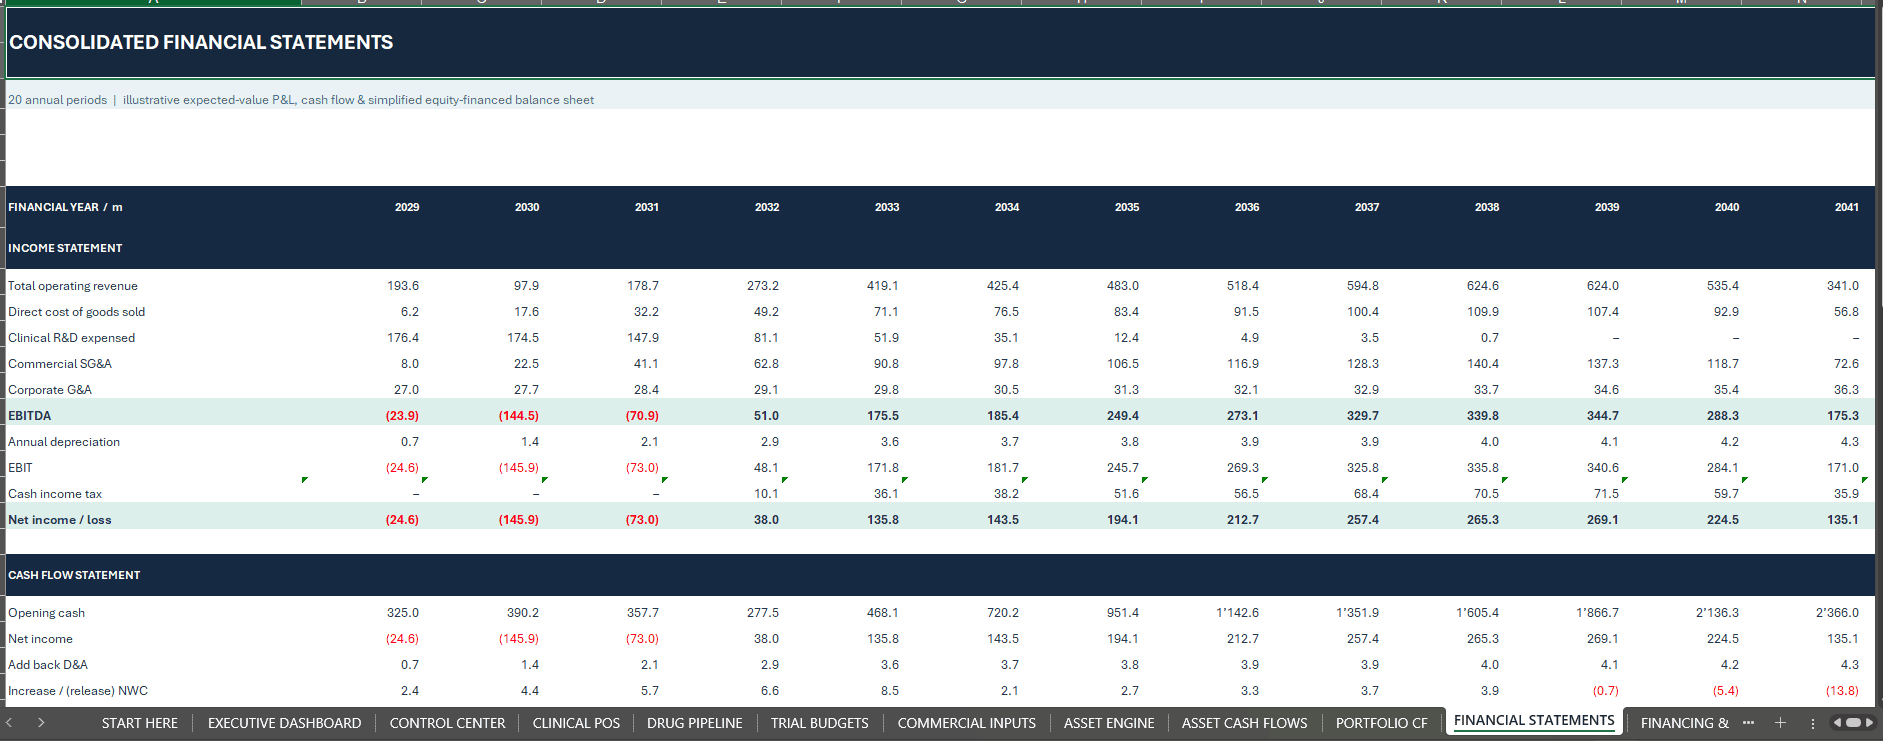
The model provides 20 annual periods, with illustrative years 2029–2048, and an editable starting year.
The financial framework includes:
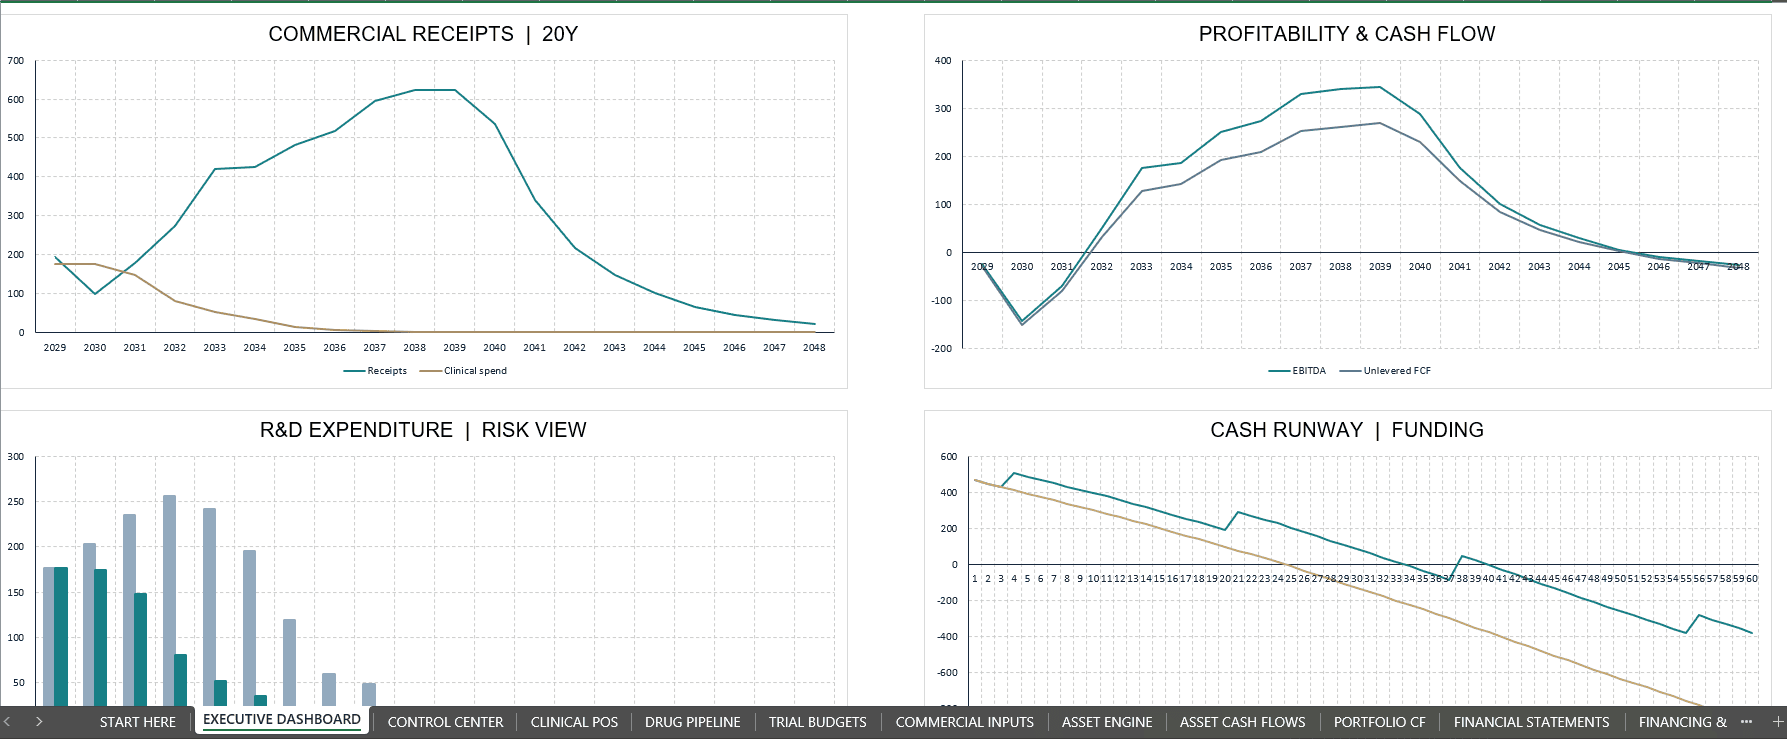
- Risk-adjusted direct product sales and licensing receipts
- Clinical research and development spending
- Cost of goods sold and commercial SG&A
- Corporate G&A, CAPEX and depreciation
- Working capital and simplified corporate taxation
- Income Statement, Balance Sheet and Cash Flow Statement
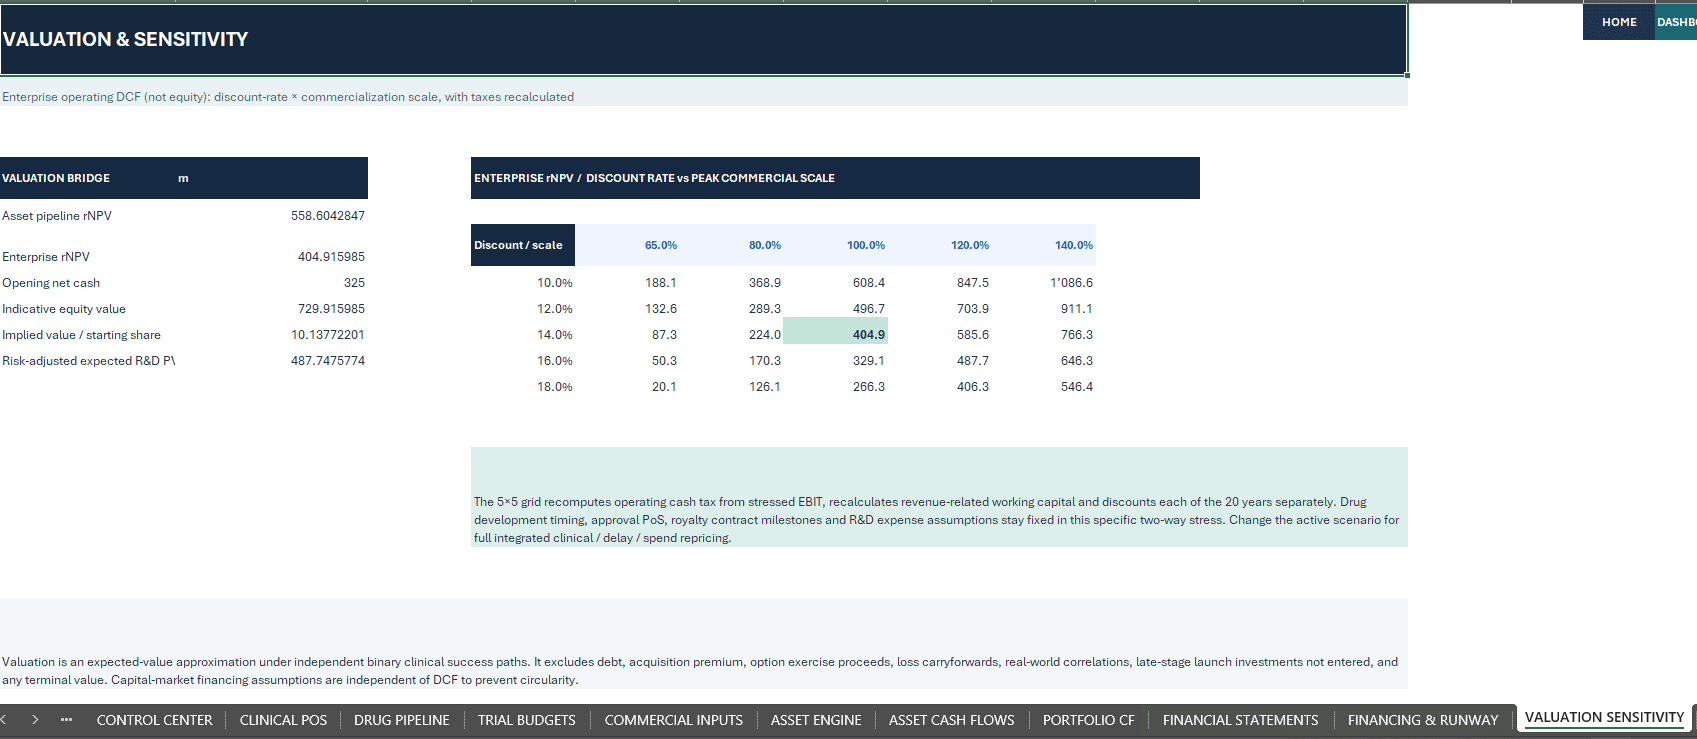
- Enterprise risk-adjusted valuation and indicative equity value
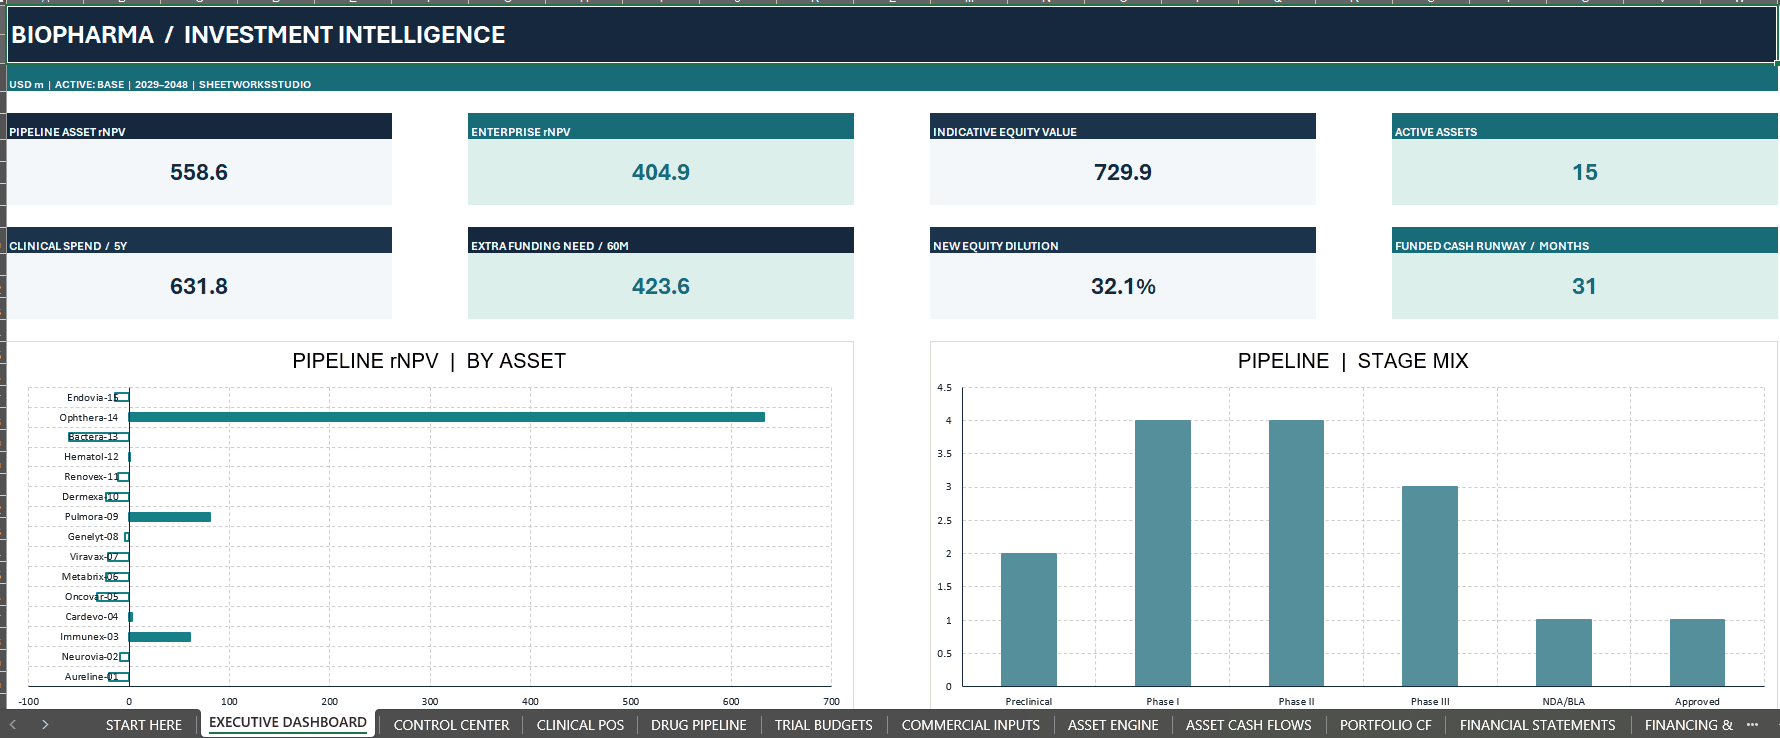
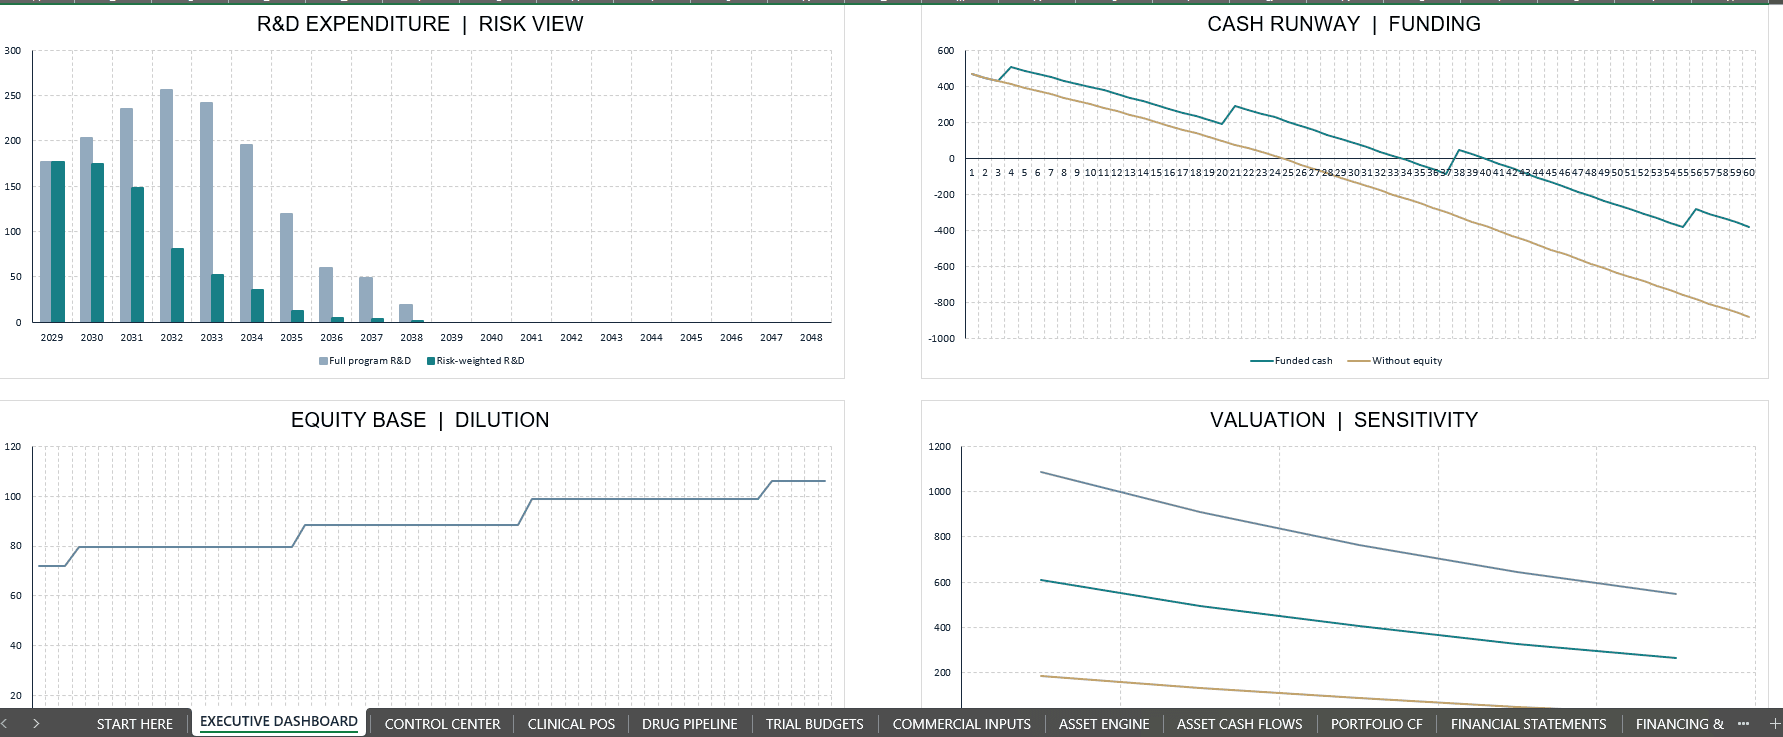
Executive Dashboard – 8 Dynamic Charts
The dashboard presents essential valuation, operational and financing indicators:
- Pipeline Asset rNPV
- Enterprise rNPV
- Indicative Equity Value
- Active Drug Candidates
- Five-Year Clinical Spending
- Additional Funding Need
- New Equity Dilution
- Funded Cash Runway
Eight native Excel charts visualize the underlying financial and clinical development calculations.
All reported values are illustrative financial model outputs, not guaranteed investment or clinical outcomes.
💰 60-MONTH FUNDING, CASH RUNWAY & DILUTION
Follow monthly liquidity requirements during the first five years.
The financing module includes:
- Monthly opening and closing cash balances
- Planned clinical development expenditure and corporate G&A
- Minimum liquidity reserves
- Scheduled financing rounds
- Equity issue prices and newly issued shares
- Shareholder dilution
- Additional funding requirements
- Funded and unfunded cash runway analysis
- Financing register prepared for up to 500 events
The liquidity forecast uses a conservative planned-spending approach rather than assuming all clinical research expenditure can be reduced by the probability of success.
Important: Funding requirements relate to the selected 60-month period. Clinical development delays may shift expenditure beyond that window, reducing near-term funding requirements without eliminating future financing risk.
🔄 BASE, UPSIDE & DOWNSIDE SCENARIOS
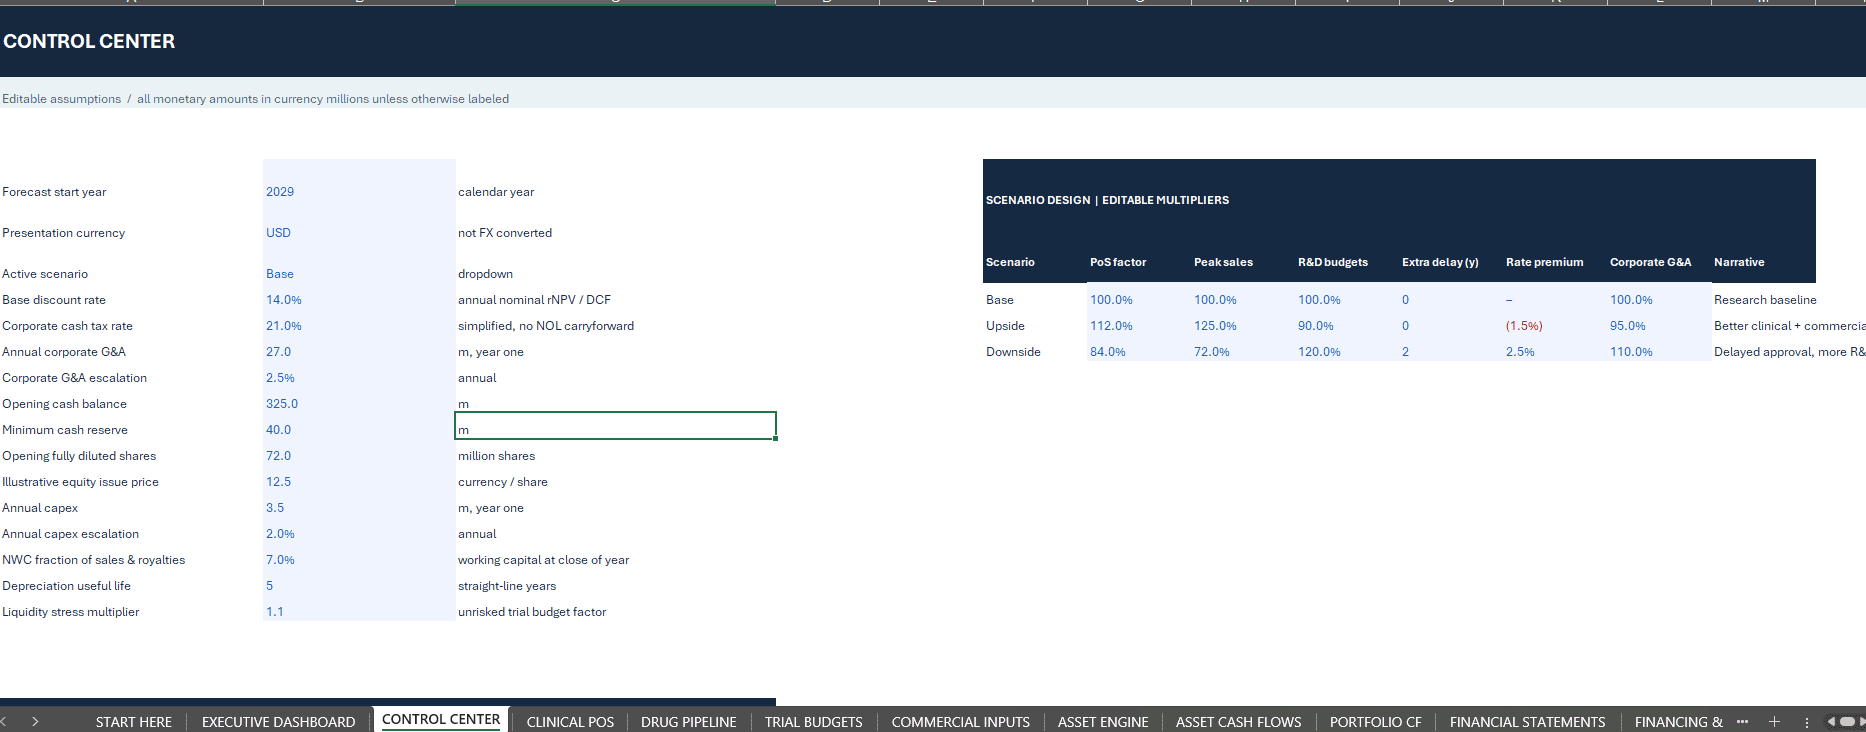
Change the active scenario in CONTROL CENTER to evaluate alternative clinical, commercial and financial conditions.
BASE CASE
Central illustrative clinical development, commercialization and financing assumptions.
UPSIDE CASE
Improved clinical probabilities, stronger commercial potential and more favorable development economics.
DOWNSIDE CASE
Lower success probabilities, weaker sales assumptions, additional R&D spending and delayed development.
Valuation Sensitivity
A 5 × 5 Enterprise rNPV sensitivity matrix examines changes in discount rates and peak commercial sales assumptions.
The sensitivity matrix holds selected clinical development and licensing inputs fixed. Broader scenario changes can be evaluated through the live scenario controls.
⚙️ PROFESSIONAL WORKBOOK STRUCTURE
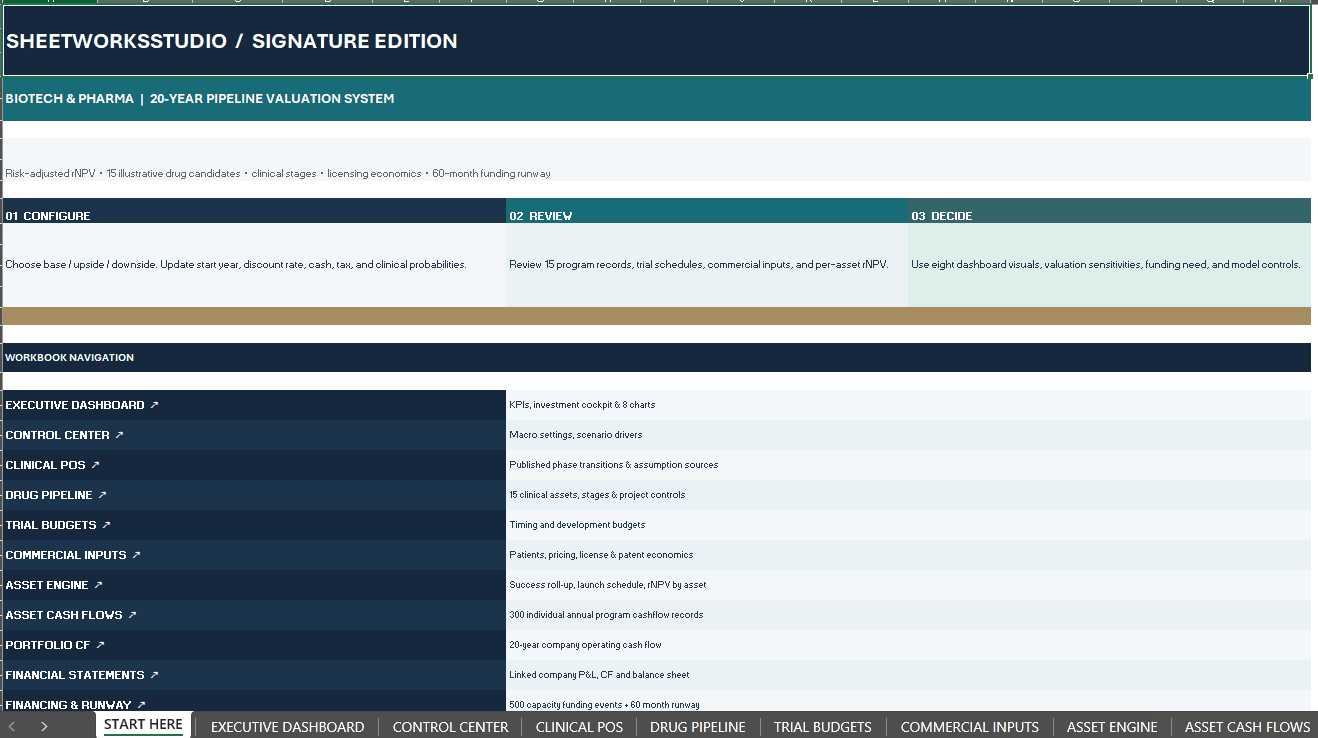
The Excel model includes 16 integrated worksheets:
- START HERE – Setup and navigation
- EXECUTIVE DASHBOARD – KPIs and eight charts
- CONTROL CENTER – Scenario and company assumptions
- CLINICAL POS – Stage probabilities and benchmarks
- DRUG PIPELINE – Fifteen asset records
- TRIAL BUDGETS – Development timing and budgets
- COMMERCIAL INPUTS – Patient, pricing and licensing assumptions
- ASSET ENGINE – Clinical probability and asset valuations
- ASSET CASH FLOWS – Risk-adjusted program cash flows
- PORTFOLIO CF – Consolidated portfolio economics
- FINANCIAL STATEMENTS – Twenty-year three-statement forecast
- FINANCING & RUNWAY – Monthly liquidity and equity events
- VALUATION SENSITIVITY – Discount rate and sales stress testing
- CHART DATA – Linked dashboard series
- MODEL CHECKS – Twenty calculation controls
- USER GUIDE & SOURCES – Instructions and references
Built-In Model Checks
The MODEL CHECKS worksheet provides 20 formula-driven controls addressing clinical assumptions, financial reconciliations, valuation links, cash balances, financing entries and forecast structure.
Passing a model-integrity check does not certify clinical assumptions, future regulatory outcomes or the financial feasibility of a transaction.
📦 WHAT YOU RECEIVE
1. Biotech & Pharma rNPV Financial Model (.xlsx)
A fully editable 16-worksheet Excel workbook with:
- 15 illustrative drug development programs
- 20-year annual forecasting
- 60-month liquidity analysis
- Three financial scenarios
- Eight executive dashboard charts
- Direct commercialization and licensing economics
- Financial statements and enterprise valuation
- Funding and dilution analysis
- Twenty model validation controls
2. Professional How-to-Use Guide – 26-Page PDF
A detailed English manual covering:
- Workbook setup and navigation
- Clinical probability methodology
- Drug pipeline assumptions
- Trial durations and development budgets
- Commercialization and licensing economics
- Financial statement interpretation
- Company and asset rNPV
- Equity funding and dilution
- Cash runway
- Scenario and sensitivity analysis
- Model validation and troubleshooting
- Clinical probability sources and glossary
The handbook contains 24 chapters, practical cell references and a final review checklist.
3. Illustrative Sample Data
Fictional drug candidates, clinical assumptions, commercial terms, financial figures and financing events demonstrate the complete valuation workflow.
IDEAL FOR
- Biotechnology Founders and CFOs
- Pharmaceutical Finance Teams
- Life Sciences Investors
- Healthcare and Biotechnology Investment Analysts
- Business Development and Licensing Professionals
- Pharmaceutical Portfolio Managers
- Corporate Development and M&A Teams
- Financial Modeling Consultants
- Specialist Finance and Biotechnology Students
Typical use cases include pipeline valuation, fundraising preparation, licensing analysis, biotech company forecasting, portfolio reviews and scenario analysis.
Similar ProductsOther customers were also interested in...



 eFinancialModels
Electric Vehicle (EV) Charging Station Financial M...
With this comprehensive 5- or 10-year monthly tool, investors can assess the viability of setting up... Read more

Financial Model for Mobile App | Mobile App Busine...
The Mobile App Financial Plan Template in Excel allows you to develop financial projections when lau... Read more

 HenrySheykin
Food Truck Financial Model Excel Template
The Food Truck Financial Model helps entrepreneurs, founders, business owners, consultants, and anal... Read more

Green Hydrogen Production from Wind Energy Financi...
The Green Hydrogen from Wind Financial Model aims to comprehensively forecast a horizon of 40 years ... Read more

Simple Mutual Non-Disclosure Agreement Template
Protect your business secrets with ease using our Simple Mutual Non-Disclosure Agreement Template. S... Read more

Solar Energy Financial Model
The Solar Energy Financial Model Spreadsheet Template in Excel assists you in preparing a sophistica... Read more

 Peter Graf
The Customer-Centric Financial Model for Restauran...
Starting a restaurant without a financial plan is like driving a car blindfolded. You wouldn´t do i... Read more
You must log in to submit a review.