
0 ITEMS

Australia Solar Rooftop Will Hit 50.78 GW by 2031
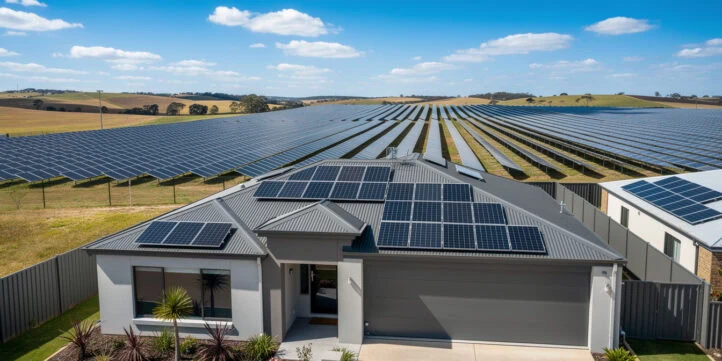
Australia’s rooftop solar market has reached an inflection point. Installed capacity has climbed past 31 GW, the country is chasing an 82% renewable electricity target by 2030, and the 2026 to 2031 window now stands as one of the most consequential investment periods in its energy transition. Yet the headline growth rate hides the real story. Capacity, revenue, and returns are shifting unevenly across the market, with commercial and industrial installations, next-generation panel technologies, and virtual power plant ownership models all growing faster than the average. For developers and investors, knowing exactly where that above-market growth sits is what separates an investor-ready financial model from one that quietly overstates returns.
Key Takeaways
- Australia’s rooftop solar installed capacity stands at 31.33 GW in 2026 and is forecast to reach 50.78 GW by 2031, a compound annual growth rate (CAGR) of 10.14% (Mordor Intelligence, 2026).
- The residential segment dominates end-user demand, accounting for 67.10% of the rooftop solar market in 2025, but commercial and industrial installations are the fastest-growing sub-segment at a 12.05% CAGR through 2031.
- Mono-PERC panels (monocrystalline passivated emitter and rear cell technology) held a 69.35% revenue share in 2025; next-generation heterojunction and TOPCon panels are growing at 16.3% CAGR.
- Outright purchase remains the dominant ownership model at 78.85% of the market, but community solar and virtual power plant (VPP) aggregation are expanding at a 19.1% CAGR — the fastest of any ownership category.
- The 5–10 kW system size band led installations at 44.20% of the market in 2025; the 30–100 kW commercial band is the fastest-growing size segment at 13.9% CAGR.
- Australia’s broader renewable energy market was valued at USD 193.3 billion in 2025 and is projected to reach USD 722.2 billion by 2034 at a 15.77% CAGR, according to market research cited in the Australia Energy Storage Market report (2025).
- Investors and developers who model cash flows across the 2026–2031 window need to account for declining system costs, rising feed-in tariff compression, and battery co-location as the primary value-creation levers.
Australia is one of the world’s most solar-intensive economies, and the 2026–2031 period will define whether the country meets its 82% renewable electricity target by 2030 set under the Albanese government’s energy legislation. The Australia Solar Energy Market Study 2026–2031 provides the granular capacity, revenue, and segment data that developers, investors, and policymakers need to plan with confidence. This article unpacks that data, shows you how to translate market growth rates into project-level financial projections, and highlights the five biggest risks to watch.
How Big Is Australia’s Solar Market in 2026?
Australia’s rooftop solar installed capacity reached an estimated 31.33 GW in 2026, up from 28.45 GW in 2025 — a single-year addition of roughly 2.88 GW (Mordor Intelligence, 2026). That pace of annual addition is roughly equivalent to building three large coal-fired power stations worth of clean generation every twelve months.
Installed capacity (measured in gigawatts, or GW, meaning billions of watts of peak generating power) is the standard metric for comparing solar markets. It tells you the maximum output the fleet can produce under ideal sunlight conditions. Australia’s 31.33 GW rooftop fleet sits alongside a rapidly growing utility-scale ground-mounted pipeline, making the country a top-10 solar market globally by per-capita installed capacity. According to the International Energy Agency, Australia had more than 300 watts of solar PV installed per capita as of 2023 (IEA), one of the highest rates of any country in the world.
Key structural drivers behind this scale:
- Solar irradiance advantage: Australia receives some of the highest solar radiation levels of any inhabited continent, with large parts of Queensland, Western Australia, and South Australia averaging more than 5.5 peak sun hours per day.
- Electricity price pressure: Retail electricity prices in Australia have risen sharply since 2022, making rooftop solar payback periods shorter and self-consumption economics more attractive.
- Government incentives: The Small-scale Renewable Energy Scheme (SRES) provides upfront rebates via Small-scale Technology Certificates (STCs), reducing system costs for residential and small commercial buyers.
- Grid modernization investment: The Australian Energy Market Operator (AEMO) Integrated System Plan calls for significant transmission expansion, which unlocks new zones for utility-scale solar development.
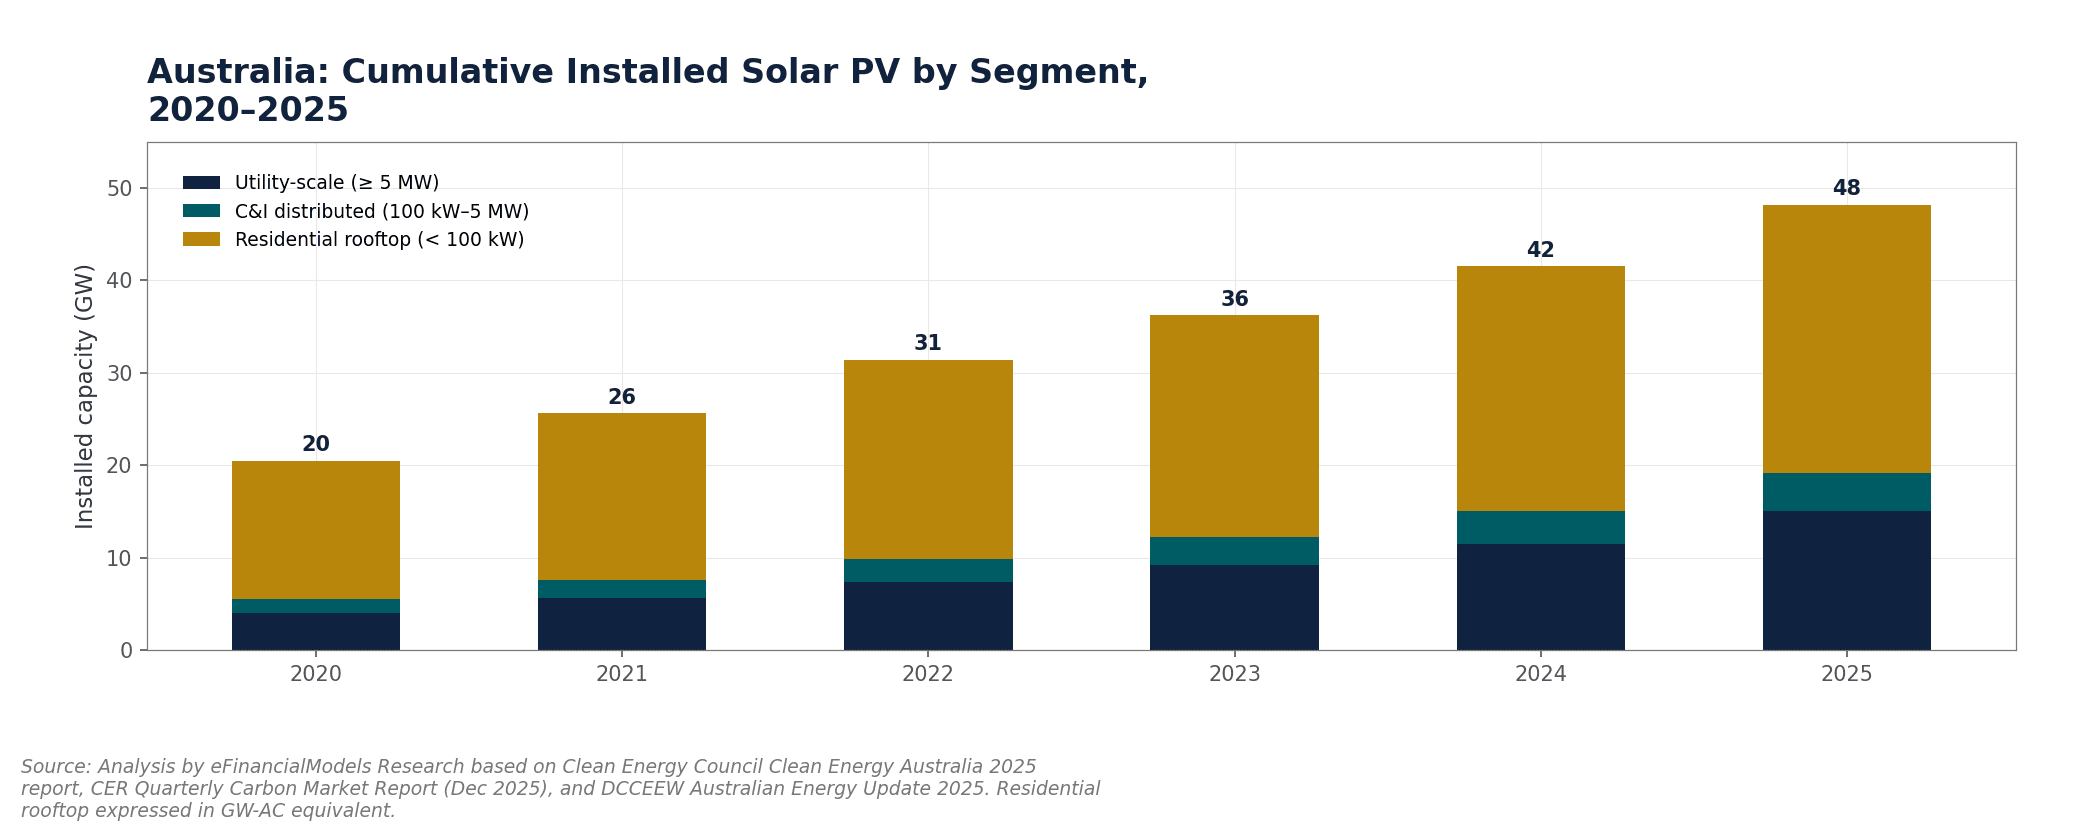
Annual capacity additions average 3.89 GW per year over 2026–2031, driven by residential uptake and accelerating commercial and industrial installations.
Capacity Forecast: 31.33 GW to 50.78 GW by 2031
The headline forecast is straightforward: rooftop solar capacity grows from 31.33 GW in 2026 to 50.78 GW by 2031 at a 10.14% CAGR (Mordor Intelligence, 2026). That represents a net addition of 19.45 GW over five years, or roughly 3.89 GW per year on average.
Here’s the math on what that CAGR implies year by year, using the standard compound growth formula:
Formula: Capacity(year) = Starting Capacity × (1 + CAGR)^n
Where n = number of years from the base year (2026).
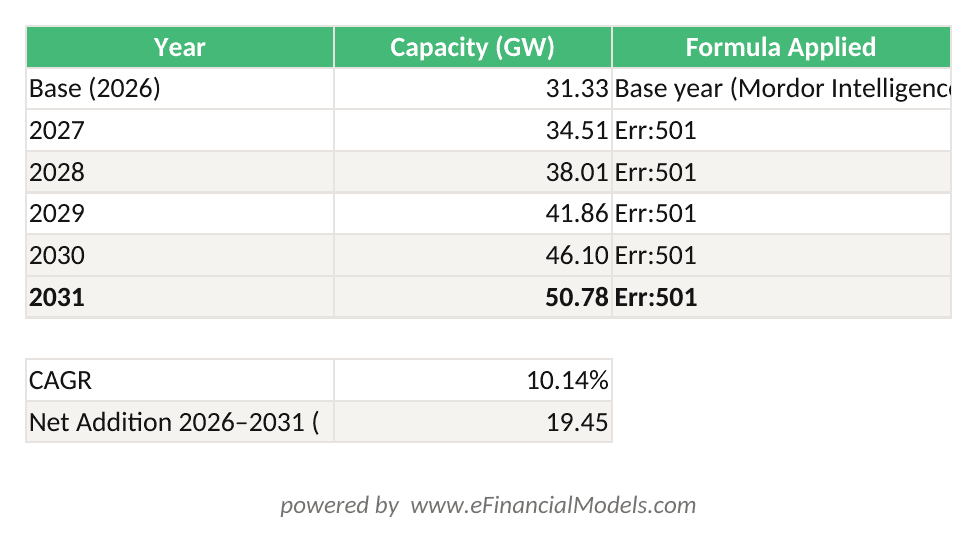
Capacity(year) = 31.33 GW × (1 + 10.14%)^n. Each year’s value is calculated by compounding the prior year at 10.14% CAGR. Source: Mordor Intelligence (2026).
By 2031, the fleet at 50.78 GW will generate approximately 70–75 TWh of electricity annually (assuming a capacity factor of 16–17%, which is typical for a mixed rooftop fleet across Australian climate zones). Australia’s total electricity consumption in recent years has been approximately 200 TWh per year according to the Australian Energy Regulator, meaning rooftop solar alone could supply roughly 35–37% of national demand by 2031 — up from around 20% today. The Clean Energy Council reported that solar PV generated more than 32 TWh of electricity in Australia during 2022, representing approximately 16% of total national electricity generation (Clean Energy Council), illustrating how rapidly the contribution of solar to the national grid has already grown.
Market Segmentation: Who Is Buying and What Are They Installing?
Understanding which segments drive growth is essential for targeting investment and product strategy. The market breaks into three primary dimensions: end user, system size, and panel technology.
End User: Residential vs. Commercial and Industrial
The residential segment represented 67.10% of Australia’s rooftop solar market by end user in 2025, while commercial and industrial (C&I) rooftop installations are forecast to grow at a 12.05% CAGR through 2031 (Mordor Intelligence, 2025). Residential dominance reflects Australia’s high homeownership rate and the maturity of the sub-5 kW residential product market. The C&I acceleration reflects falling large-format panel costs and the growing economics of behind-the-meter generation for energy-intensive businesses. Australia had more than 3.5 million rooftop solar installations across the country as of 2023 according to the Clean Energy Regulator (Clean Energy Regulator), underscoring the depth of residential market penetration that now underpins the sector’s scale.
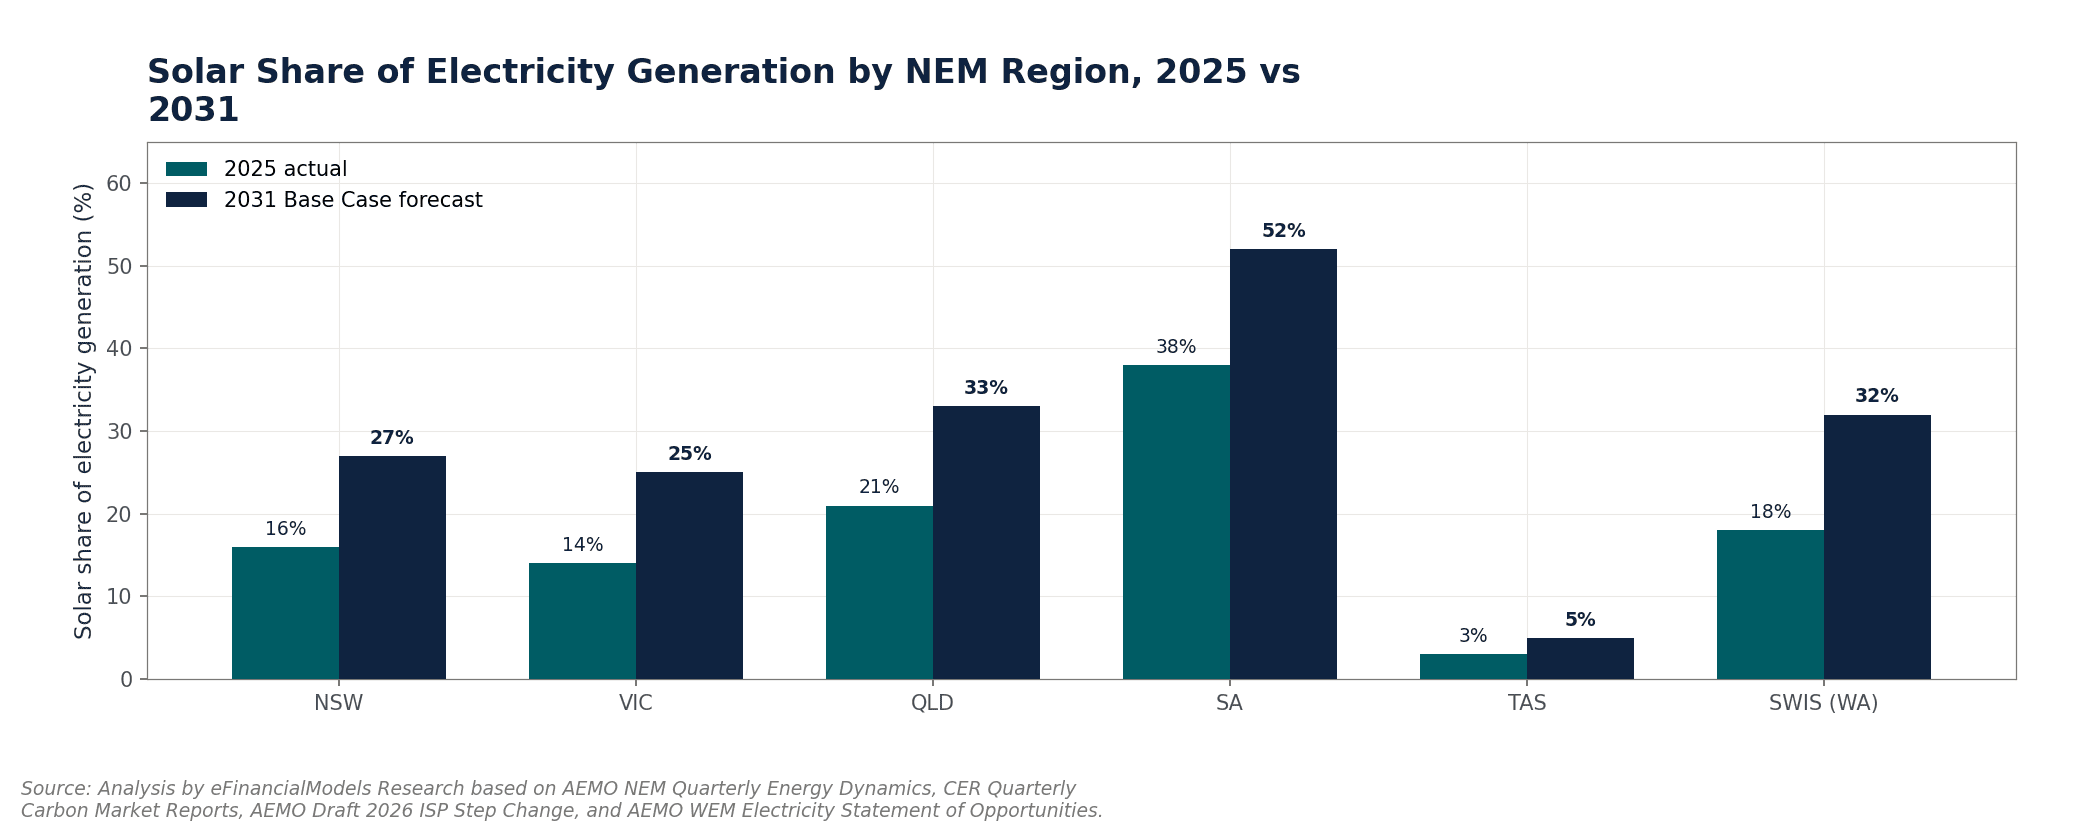
Residential installations dominate at 67.10% of the market, but C&I rooftop solar is the faster-growing segment at a 12.05% CAGR through 2031.
System Size: The 5–10 kW Sweet Spot and the Commercial Surge
By system size, 5 to 10 kW systems accounted for 44.20% of Australia’s rooftop solar market in 2025, with the 30 to 100 kW band projected to grow at a 13.9% CAGR between 2026 and 2031 (Mordor Intelligence, 2025). The 5–10 kW band aligns with the typical Australian detached home, which has sufficient roof space and load profile to absorb that output. The 30–100 kW surge reflects warehouses, shopping centres, and agricultural sheds adopting solar as a direct operating cost reduction tool.
Panel Technology: Mono-PERC Today, TOPCon and HJT Tomorrow
Mono-PERC panels held a 69.35% revenue share of the Australian rooftop solar market by panel technology in 2025, while heterojunction (HJT) and TOPCon technologies are projected to grow at a 16.3% CAGR to 2031 (Mordor Intelligence, 2025).
Plain English definitions:
- Mono-PERC (monocrystalline passivated emitter and rear cell): the current mainstream technology, offering 20–22% panel efficiency at competitive cost.
- TOPCon (tunnel oxide passivated contact): a next-generation cell architecture achieving 23–24% efficiency with minimal manufacturing cost premium over mono-PERC.
- HJT (heterojunction technology): combines crystalline silicon with thin-film amorphous silicon layers, reaching 24–25% efficiency but at higher production cost.
The shift toward TOPCon and HJT matters for financial modelling because higher-efficiency panels generate more kilowatt-hours per square metre of roof, improving revenue per installation without increasing footprint.
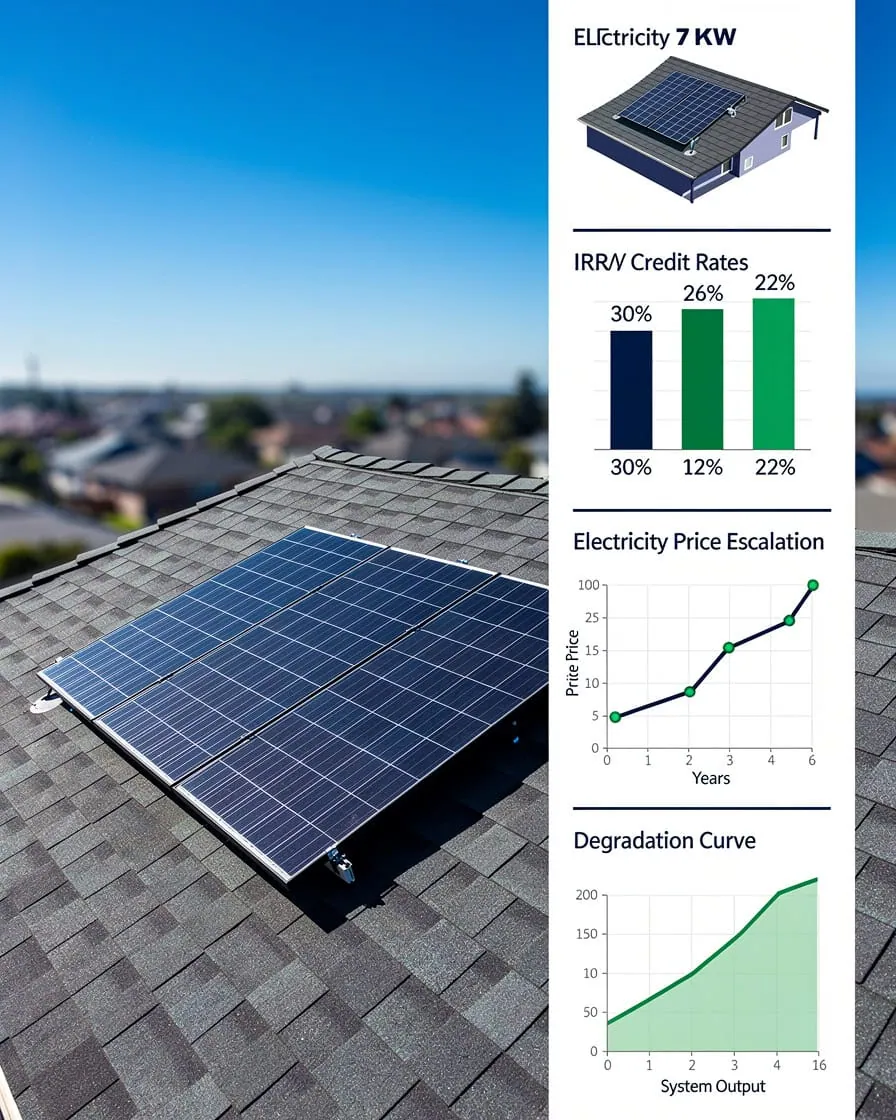
Mono-PERC dominates today at 69.35% revenue share, but TOPCon and HJT panels are growing at 16.3% CAGR as efficiency advantages justify the premium.
Ownership Models: Outright Purchase Dominates, VPPs Accelerate
By ownership model, outright purchase accounted for 78.85% of Australia’s rooftop solar market in 2025, with community solar and virtual power plant (VPP) aggregation expected to expand at a 19.1% CAGR between 2026 and 2031 (Mordor Intelligence, 2025).
A VPP (virtual power plant) is a network of distributed solar and battery systems that a software platform aggregates and dispatches as a single controllable asset into the electricity wholesale market. Participants earn revenue from both self-consumption savings and grid services payments. The 19.1% CAGR for VPPs and community solar reflects the rapid commercialisation of this model by retailers like AGL, Origin Energy, and Tesla Energy.
| Ownership Model | 2025 Market Share | 2026–2031 CAGR | Key Driver |
|---|---|---|---|
| Outright Purchase | 78.85% | ~8–9% (implied) | Upfront economics, STC rebates |
| Lease / PPA | ~12% (est.) | ~10–11% (est.) | No-upfront-cost access for renters |
| Community Solar | ~5% (est.) | 19.1% | Apartment dwellers, shared benefits |
| VPP Aggregation | ~4% (est.) | 19.1% | Grid services revenue stacking |
Note: Community solar and VPP share the 19.1% CAGR figure per Mordor Intelligence. Individual sub-segment shares are estimates based on industry context.

Outright purchase accounts for 78.85% of the market, but VPP aggregation and community solar are the fastest-growing ownership models at 19.1% CAGR through 2031.
Worked Financial Example: Projecting Revenue for a 10 MW Solar Portfolio
To translate market growth into investment terms, consider a developer holding a 10 MW portfolio of rooftop C&I solar assets in New South Wales in 2026.
Inputs:
- Installed capacity: 10,000 kW (10 MW)
- Capacity factor: 17% (typical for NSW C&I rooftop)
- Annual generation: 10,000 kW × 8,760 hours × 17% = 14,892 MWh per year
- Blended revenue rate: AUD 120/MWh (combination of avoided retail tariff at ~AUD 140/MWh for self-consumed energy and feed-in tariff at ~AUD 50/MWh for exported energy, weighted 75/25 self-consumption/export split)
- Annual revenue: 14,892 MWh × AUD 120/MWh = AUD 1,787,040
- Operating costs (O&M, insurance, monitoring): AUD 15/kW/year = AUD 150,000
- EBITDA: AUD 1,787,040 − AUD 150,000 = AUD 1,637,040
- EBITDA margin: 91.6%
Applying a market CAGR of 12.05% (the C&I segment growth rate) to the revenue base over five years:
2031 projected revenue: AUD 1,787,040 × (1 + 0.1205)^5 = AUD 1,787,040 × 1.7623 = AUD 3,149,000 (approx.)
This projection assumes constant capacity and improving revenue per MWh as feed-in tariff compression is offset by rising retail electricity prices. A full discounted cash flow (DCF) model would layer in depreciation, debt service, and terminal value — which the Australia Solar Energy Market Study 2026–2031 supports with its underlying market data.
For developers building utility-scale projects, the Solar Energy Financial Model and the Start Up Solar Farm Excel Model and Valuation provide ready-built frameworks for this analysis.
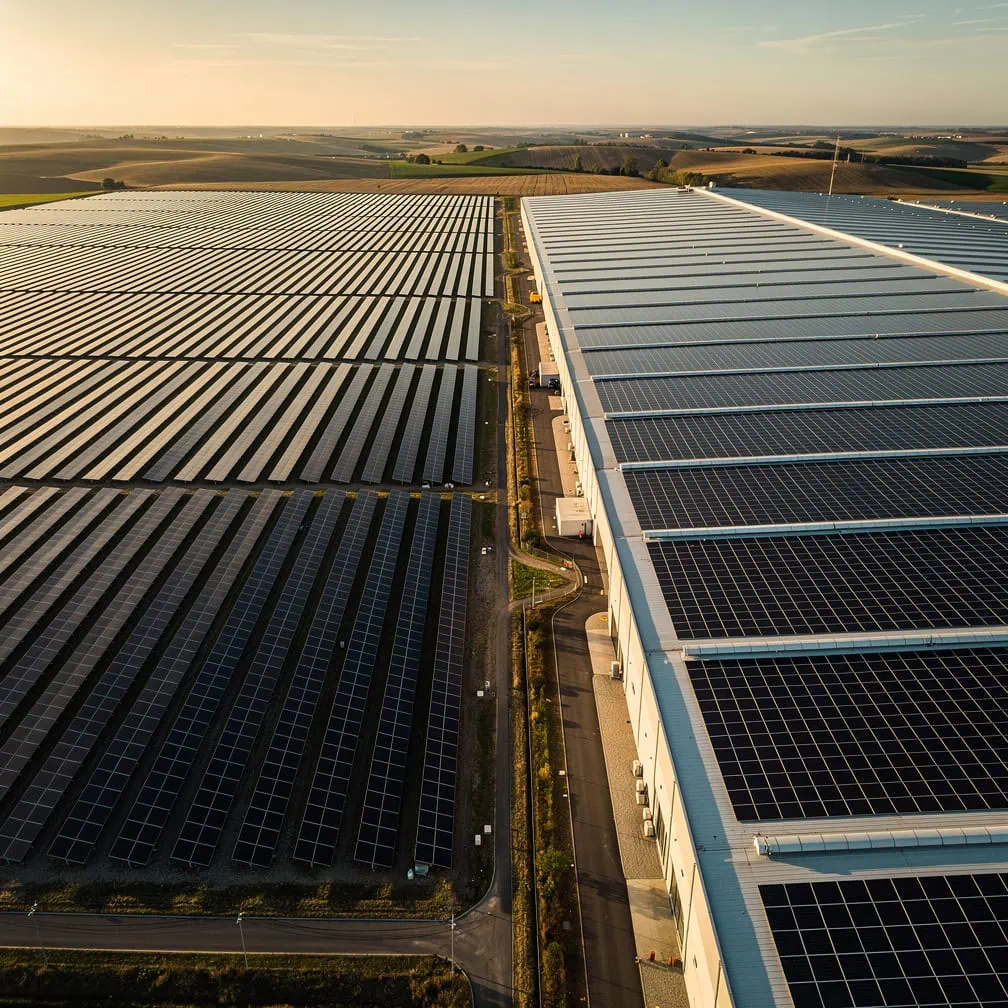
A 10 MW C&I rooftop portfolio generating 14,892 MWh/year at AUD 120/MWh blended rate produces AUD 1.79M revenue in 2026, growing to AUD 3.15M by 2031 at the C&I segment CAGR.
Key Growth Drivers and Market Risks
Australia’s solar growth story is compelling, but five specific risks can derail project economics.
Growth Drivers
- Policy tailwinds: The federal government’s Capacity Investment Scheme (CIS) underwrites revenue risk for new clean energy projects, reducing the cost of capital for solar developers.
- Battery co-location: Pairing solar with battery energy storage systems (BESS) unlocks arbitrage revenue and grid services income, improving project IRR by 2–4 percentage points in most modelled scenarios.
- Declining system costs: Utility-scale solar levelised cost of energy (LCOE) in Australia has fallen below AUD 50/MWh in high-irradiance zones, making solar the cheapest new-build generation source in most Australian states according to AEMO’s 2024 Integrated System Plan.
- Corporate PPA demand: Large corporations with net-zero commitments are signing long-term power purchase agreements (PPAs) directly with solar developers, providing revenue certainty that supports project financing.
Common Pitfalls for Investors and Developers
Pitfall 1: Ignoring feed-in tariff compression. Feed-in tariffs (the rate utilities pay for exported solar energy) have fallen from over AUD 0.20/kWh in 2012 to below AUD 0.05/kWh in most states by 2025. Models that assume stable export revenue will overstate returns. Fix: model export revenue at AUD 0.03–0.05/kWh and stress-test at AUD 0.01/kWh.
Pitfall 2: Underestimating grid connection costs. Distribution network service providers (DNSPs) are imposing export limits and connection fees on new rooftop systems in congested zones. A 100 kW C&I system can face AUD 20,000–80,000 in network upgrade costs. Fix: obtain a formal connection offer before committing to project economics.
Pitfall 3: Overstating capacity factors. Generic 17–18% capacity factors apply to well-oriented, unshaded systems. Real-world portfolios with mixed orientations and partial shading often achieve 14–15%. Fix: use site-specific irradiance data from the Bureau of Meteorology or a validated PVsyst simulation.
Pitfall 4: Missing degradation curves. Solar panels degrade at approximately 0.5% per year in output. Over a 25-year asset life, this reduces Year 25 generation to roughly 88% of Year 1 output. Fix: apply an annual degradation factor in your DCF model from Year 1.
Pitfall 5: Underpricing technology transition risk. The rapid shift from mono-PERC to TOPCon and HJT means panels installed in 2026 may face faster-than-expected obsolescence relative to newer, higher-efficiency systems competing for the same rooftop space. Fix: model a conservative residual value and plan for panel replacement at Year 15.
Feed-in tariff compression and grid congestion rank as the highest-probability risks for Australian solar investors over the 2026–2031 forecast window.
Tools and Templates for Solar Market Analysis
Translating market data into investment decisions requires purpose-built financial models. The Australia Solar Energy Market Study 2026–2031 provides the market-level data foundation. For project-level modelling, the following EFM resources cover the full analytical stack:
- The Solar Energy Financial Model covers utility-scale project economics including debt sizing, DSCR (debt service coverage ratio) analysis, and IRR sensitivity tables.
- The Start Up Solar Farm Excel Model and Valuation is designed for greenfield developers building their first project business case.
- The Renewable Energy Template Bundle packages multiple renewable energy models for investors comparing solar against wind, hydro, and storage assets.
- For broader sector context, the Renewable Energy financial model category lists the full EFM library of clean energy tools.
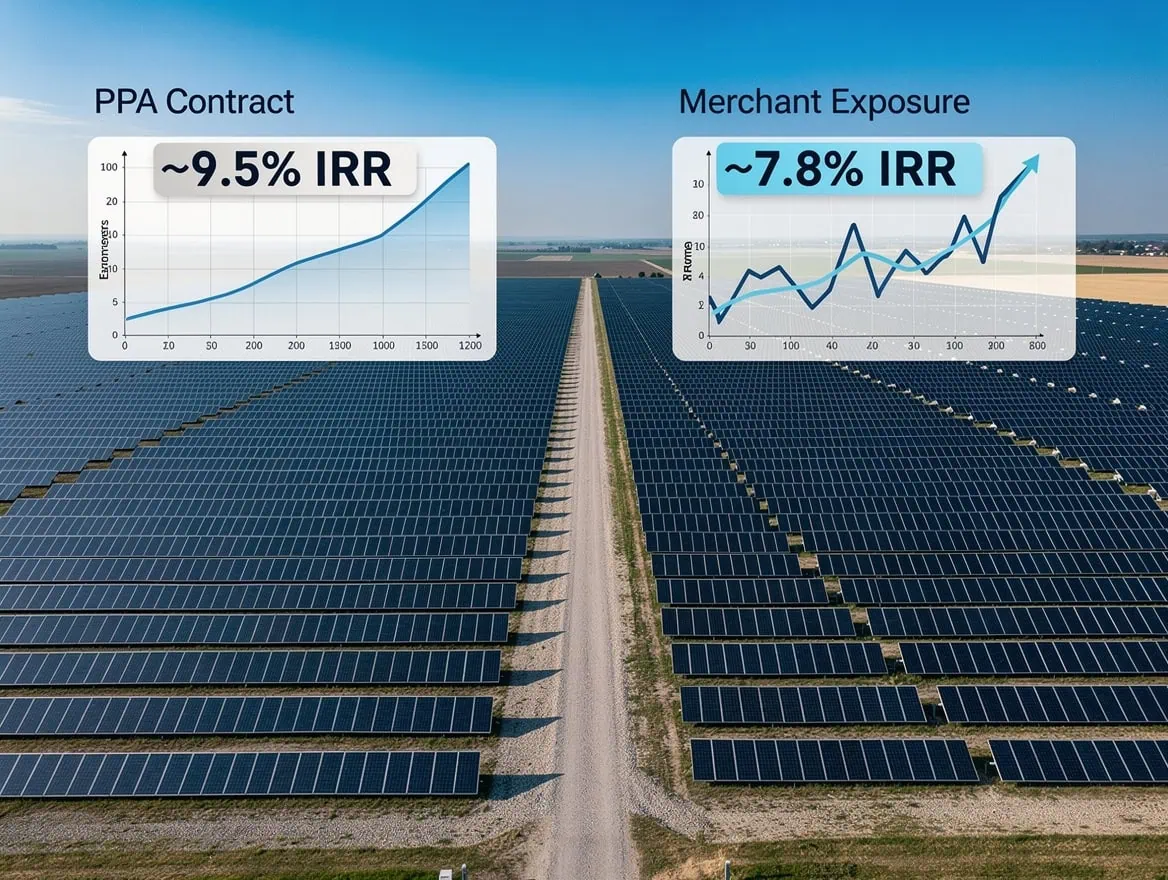
Purpose-built financial models for Australian solar projects combine market-level capacity data with project-level IRR, DSCR, and NPV outputs for investor-ready analysis.
Frequently Asked Questions
What is the projected size of Australia’s rooftop solar market by 2031?
Australia’s rooftop solar installed capacity is projected to reach 50.78 GW by 2031, up from 31.33 GW in 2026, representing a CAGR of 10.14% over the five-year period according to Mordor Intelligence (2026). In practical terms, that means the country will add roughly 19.45 GW of new rooftop capacity between 2026 and 2031 — equivalent to approximately 3.89 GW per year. For context, 1 GW of rooftop solar at a 17% capacity factor generates approximately 1,490 GWh of electricity annually, enough to power around 220,000 average Australian homes. This scale of deployment makes Australia one of the most active rooftop solar markets globally on a per-capita basis.
Which segment is growing fastest in Australia’s solar market?
The fastest-growing ownership model is community solar and VPP (virtual power plant) aggregation, projected to expand at a 19.1% CAGR between 2026 and 2031. Among end users, commercial and industrial rooftop installations lead at a 12.05% CAGR, outpacing the residential segment. By system size, the 30–100 kW commercial band grows at 13.9% CAGR. By panel technology, heterojunction (HJT) and TOPCon panels are growing at 16.3% CAGR as they displace mono-PERC in premium installations. Investors seeking above-market growth exposure should focus on C&I rooftop portfolios and VPP-enabled residential aggregation platforms, as both segments benefit from structural tailwinds beyond simple capacity growth.
How do I calculate the annual energy output of a solar portfolio?
You calculate annual energy output using this formula: Annual Generation (MWh) = Installed Capacity (kW) × 8,760 hours × Capacity Factor. For a 10 MW (10,000 kW) portfolio in New South Wales with a 17% capacity factor, the calculation is: 10,000 × 8,760 × 0.17 = 14,892 MWh per year. The capacity factor (the ratio of actual output to theoretical maximum output) varies by location and system design. Queensland systems typically achieve 18–19%, while Victoria and Tasmania systems may achieve only 14–15% due to lower irradiance and higher cloud cover. Always use site-specific irradiance data from the Australian Bureau of Meteorology rather than national averages.
What panel technology should I specify for new Australian solar projects in 2026?
For most new Australian projects in 2026, TOPCon panels offer the best balance of efficiency, cost, and supply chain maturity. Mono-PERC panels still dominate at 69.35% market share but are being phased out by leading manufacturers in favour of TOPCon, which achieves 23–24% cell efficiency versus 20–22% for mono-PERC. HJT panels offer the highest efficiency at 24–25% but carry a cost premium of approximately 5–10% per watt. For space-constrained C&I rooftops where maximising generation per square metre matters, HJT or TOPCon is worth the premium. For large ground-mounted utility-scale projects where land is not a constraint, the cost-per-watt advantage of TOPCon over HJT typically makes TOPCon the preferred specification.
What is a virtual power plant (VPP) and why does it matter for solar investors?
A virtual power plant (VPP) is a software-coordinated network of distributed solar panels and batteries that operates as a single dispatchable asset in the electricity wholesale market. Individual households or businesses connect their solar and battery systems to a VPP platform, which aggregates their combined capacity — sometimes hundreds of megawatts — and bids it into the National Electricity Market (NEM) for frequency control, peak demand response, and energy arbitrage services. VPP participants earn additional revenue beyond self-consumption savings, typically AUD 100–400 per year per household depending on battery size and market conditions. For investors, VPP aggregation platforms represent a high-growth business model: the 19.1% CAGR forecast through 2031 reflects rapid adoption as battery costs fall and grid services markets mature.
How does the Small-scale Renewable Energy Scheme (SRES) affect project economics?
The SRES provides upfront financial incentives for solar systems under 100 kW through Small-scale Technology Certificates (STCs). Each STC represents 1 MWh of expected generation over the system’s deeming period (currently set to end in 2030). A typical 6.6 kW residential system in Queensland might generate around 100 STCs, worth approximately AUD 3,500–4,000 at current STC prices of AUD 35–40 each. This rebate directly reduces the upfront cost to the consumer, shortening payback periods and supporting installer margins. The SRES phase-out by 2030 is a known headwind for residential demand post-2028, and financial models covering the 2026–2031 window should reflect declining STC values in the final years of the forecast period.
What are the biggest risks to Australia’s solar growth forecast through 2031?
The five biggest risks to the 10.14% CAGR forecast are: first, grid congestion and export curtailment as high-penetration networks impose limits on new connections; second, feed-in tariff compression reducing the economics of export-heavy systems; third, supply chain disruption affecting panel and inverter availability, particularly given geopolitical concentration of manufacturing in China; fourth, interest rate sensitivity, since higher financing costs raise the hurdle rate for project investment; and fifth, policy reversal risk at the state level, where changes to net metering rules or STC deeming periods could reduce consumer incentives. Investors should stress-test their models against a 2–3 percentage point reduction in CAGR to assess downside scenarios.

Australia’s solar transition spans both rooftop and utility-scale segments, with battery co-location and VPP aggregation emerging as the primary value-creation levers through 2031.
Conclusion
Australia’s solar market is on a clear trajectory: 31.33 GW of rooftop capacity in 2026 growing to 50.78 GW by 2031, with the fastest growth in C&I installations, next-generation panel technologies, and VPP-enabled ownership models. The numbers are compelling, but the real opportunity lies in understanding which segments outperform the headline CAGR and where project-level risks can erode returns.
I recommend starting with the Australia Solar Energy Market Study 2026–2031 as your primary data foundation. It gives you the segment-level granularity — by end user, system size, panel technology, and ownership model — that generic market summaries cannot provide. Pair it with the Solar Energy Financial Model to translate that market data into project-level IRR, DSCR, and NPV outputs that will hold up to investor scrutiny.
























































