
0 ITEMS

Physiotherapy Financial Model Excel Template
The Physiotherapy Clinic Financial Model helps founders, clinic owners, consultants, analysts, and business plan writers turn a physiotherapy clinic concept into a structured five-year financial forecast. Instead of starting from a blank spreadsheet, users can work from a ready-to-use model built around the realities of a physical therapy practice, including therapist capacity, treatment session pricing, patient utilization, clinic staffing, startup costs, operating expenses, cash flow, and profitability. It is designed to help users understand whether the clinic can support its cost structure, how much funding may be required, and when the business may become financially sustainable. This template is especially useful for entrepreneurs preparing to open a new clinic, existing physiotherapy practices planning expansion, advisors building client forecasts, and teams preparing lender or investor documents. It allows users to adjust revenue assumptions, therapist hiring timelines, treatment volumes, pricing, payroll, rent, medical supplies, billing costs, and other clinic-specific inputs. The model then connects those assumptions to financial outputs such as projected revenue, profit and loss, cash flow, balance sheet movement, return metrics, and funding needs, giving users a clearer view of the financial implications behind each operating decision. The Physiotherapy Clinic Financial Model also supports practical decision-making by showing how performance may change under different assumptions. Users can test conservative, base, and upside scenarios, review the effect of patient volume and reimbursement changes, and evaluate whether the clinic has enough cash to operate through the early ramp-up period. This is important for physiotherapy clinics because profitability often depends on gradually increasing therapist utilization while managing fixed costs such as salaries, rent, equipment, insurance, and administrative overhead. Built for planning, budgeting, funding preparation, and internal review, the template helps users organize key assumptions in one place and present the financial story in a professional format. It can support break-even analysis, operating expense planning, payroll forecasting, revenue stream evaluation, and profitability assessment without requiring advanced spreadsheet-building skills. Whether used for a startup clinic, a new branch, a bank loan application, or an investor presentation, this financial model template provides a practical framework for evaluating feasibility, tracking expected performance, and making better financial decisions.



Financial Model Overview
The Physiotherapy Clinic Financial Model is a ready-to-use financial model template designed to help entrepreneurs, clinic owners, consultants, analysts, and business plan writers forecast the financial performance of a physiotherapy or physical therapy practice. It brings together the main drivers of a clinic business, including therapist capacity, patient utilization, treatment pricing, revenue streams, payroll, startup investment, operating expenses, cash flow, profitability, and funding needs. For a physiotherapy clinic, the financial plan must show more than basic sales growth. It must explain how many patients can be treated, how much revenue each practitioner can generate, how staff hiring affects margins, how long the clinic can operate before reaching profitability, and how much capital is needed to survive the early ramp-up period. This template gives users a structured framework for building those projections over a multi-year period while keeping the assumptions editable and transparent. It is useful for preparing business plans, loan applications, investor discussions, internal budgets, expansion plans, and operational reviews. By linking inputs to automated outputs, the model helps users move from rough estimates to a more disciplined planning process, making it easier to evaluate feasibility, compare scenarios, and present a professional financial case to stakeholders.
All-in-One Dashboard
The all-in-one dashboard gives users a central place to review the core assumptions and headline financial outputs of the Physiotherapy Clinic Financial Model. Instead of searching through multiple tabs to understand the status of the plan, the dashboard summarizes the most important information in a format that is practical for decision-making and stakeholder review. It may include key inputs such as treatment pricing, utilization assumptions, therapist capacity, staffing levels, startup investment, revenue growth, operating cost assumptions, and funding requirements, then connect those inputs to outputs such as revenue, EBITDA, profit, cash flow, cash balance, and return metrics. For a physiotherapy clinic, this is especially useful because the business depends on a close relationship between patient volume, practitioner availability, salaries, and fixed clinic overhead. The dashboard helps users quickly see whether the clinic is financially viable under the current assumptions, whether more funding is needed, and whether the projected profitability timeline is realistic. It also makes the model easier to use for non-financial users because the most important results are organized in one place. For founders preparing a business plan, consultants presenting a client forecast, or clinic owners reviewing expansion options, the dashboard serves as the financial control center of the model and provides a concise summary of the business case.
Low, Base, and High Scenario Analysis
The low, base, and high scenario analysis component allows users to test how the physiotherapy clinic may perform under different operating conditions. A clinic forecast can change significantly when assumptions such as patient volume, utilization rate, treatment pricing, reimbursement levels, therapist productivity, payroll costs, rent, or staff turnover move in a different direction than expected. This section gives users a practical way to build a conservative case, a realistic base case, and an upside case without rebuilding the model from scratch. In the low scenario, users can stress-test the clinic against slower patient acquisition, lower session volume, higher expenses, or delayed hiring efficiency. In the base scenario, the forecast can reflect the most likely operating plan. In the high scenario, users can model stronger referral performance, higher utilization, expanded services, or improved pricing. The outputs can show how each scenario affects revenue, gross margin, operating profit, cash flow, cash runway, funding needs, and return metrics. This is useful for lenders and investors because it demonstrates that the financial plan has been tested against uncertainty. It is also valuable for internal planning because it helps the user identify which assumptions have the greatest effect on performance and which risks need to be managed before and after launch.
Professional Charts
The professional charts component translates the financial model into visual reports that are easier to understand and present. Physiotherapy clinic financial planning often involves many moving parts, including monthly revenue growth, therapist productivity, payroll expansion, fixed overhead, cash burn, profitability improvement, and balance sheet changes. Charts help simplify these projections by showing trends and relationships visually. This section may include charts for revenue growth, operating expenses, EBITDA, net profit, cash balance, cumulative cash flow, funding needs, revenue by service line, or year-over-year performance. For business planning and funding preparation, visual outputs are important because stakeholders often need to understand the financial story quickly. A lender may want to see whether cash remains positive after debt service. An investor may focus on profitability, payback, and return potential. A clinic owner may want to track whether growth is driven by more therapists, higher utilization, or improved pricing. Professional charts support those conversations by turning spreadsheet outputs into presentation-ready visuals. They also help users spot issues that may be less obvious in rows of numbers, such as a cash shortage before break-even, expense growth that outpaces revenue, or a service line that is not contributing enough margin. This makes the model more useful for both analysis and communication.
ROE Components and DuPont Analysis
The ROE components and DuPont analysis section helps users evaluate the clinic’s return on equity by breaking performance into underlying financial drivers. Rather than looking only at a single return figure, this component can separate profitability, asset efficiency, and leverage to show what is actually influencing shareholder or owner returns. For a physiotherapy clinic, return on equity may be affected by factors such as net profit margin, the level of equipment and build-out investment, working capital needs, debt financing, retained earnings, and the pace at which the clinic reaches stable operating performance. DuPont analysis is useful because it helps users understand whether returns are being improved by stronger margins, more efficient use of assets, or increased financial leverage. A clinic with expensive renovation costs and therapeutic equipment may require a meaningful initial investment, so owners and investors need to know whether that capital can generate acceptable returns over time. This section may use financial statement outputs such as net income, revenue, total assets, equity, debt, and margins to calculate return metrics and show the factors behind them. It is valuable for investor discussions, owner planning, and expansion decisions because it connects operational performance with capital efficiency. Users can see whether the clinic’s return profile is driven by sustainable business performance or by assumptions that may need closer review.
Revenue Inputs
The revenue inputs component is where users define the assumptions that drive the clinic’s income forecast. In a physiotherapy clinic, revenue is typically built from treatment session volume, practitioner capacity, utilization rates, pricing per session, service mix, and the timing of staff additions. This section may allow users to enter the number and type of clinical staff, such as lead physiotherapists, staff physiotherapists, assistants, or specialized practitioners, along with the maximum monthly treatments each role can deliver, expected utilization, average session price, and changes over time. It can also support assumptions for additional revenue streams, such as wellness programs, injury prevention services, cash-based therapies, rehabilitation packages, corporate programs, or other clinic offerings. The value of this section is that it ties revenue to operational capacity instead of using a broad top-down sales estimate. Users can test whether projected sales are realistic based on how many practitioners are available, how many patient sessions they can handle, and how quickly the clinic is expected to build demand. This is critical for planning a physiotherapy clinic because revenue growth is often limited by appointment availability, referral flow, therapist hiring, and patient retention. By editing the revenue inputs, users can model different business strategies and immediately see how changes flow through profitability, cash flow, and funding requirements.
Bank-Ready Financial Reports
The bank-ready financial reports component provides structured financial outputs that can be used for lender discussions, investor presentations, business plans, and internal review. This section may include a projected profit and loss statement, cash flow statement, balance sheet, and supporting summaries for revenue, expenses, profitability, working capital, and funding needs. For a physiotherapy clinic seeking a loan or investment, professional financial statements are essential because stakeholders need to understand how the business expects to generate revenue, manage costs, service obligations, and maintain liquidity. The profit and loss statement helps show whether the clinic can become profitable after covering payroll, rent, supplies, insurance, billing fees, marketing, software, and administrative expenses. The cash flow statement shows whether the business has enough cash during the early period when operating losses and startup costs may be high. The balance sheet helps present assets such as equipment and improvements, liabilities such as loans, and owner equity. These reports are useful because they organize the clinic forecast into formats familiar to banks, investors, accountants, and advisors. They also reduce the time needed to prepare polished financial documents from scratch. By using automated links from the assumptions, the reports can update as the user revises pricing, staffing, expenses, capital investment, and financing assumptions.
Revenue Breakdown
The revenue breakdown component gives users a detailed view of how total clinic revenue is built across different drivers, practitioners, and service categories. A physiotherapy clinic may earn revenue from standard treatment sessions, assessments, follow-up visits, specialized rehabilitation, sports injury programs, post-surgical recovery, wellness services, or other offerings. It may also have multiple practitioners with different productivity levels, pricing assumptions, and hiring dates. This section helps separate those sources so users can understand which areas contribute the most revenue and how the mix changes over time. Inputs may include session price, number of sessions, utilization rates, therapist role, capacity per practitioner, service category, and growth assumptions. Outputs may show monthly and annual revenue by stream, contribution by staff type, total treatment volume, average revenue per session, and changes in revenue composition as the clinic scales. This is useful for planning because it allows users to test specific operating decisions, such as adding another physiotherapist, increasing assistant-supported sessions, introducing cash-pay services, or improving utilization through referral partnerships. It also helps identify concentration risk if too much revenue depends on one service type or one practitioner group. For funding documents, a detailed revenue breakdown makes the forecast more credible because stakeholders can see the assumptions behind the top-line projection rather than only a single revenue number.
KPI Dashboard
The KPI dashboard component helps users track performance metrics that are especially relevant to a physiotherapy clinic. Financial statements show the overall results, but key performance indicators explain how the clinic is operating. This section may include metrics such as revenue per therapist, treatments per month, utilization rate, average revenue per treatment, gross margin, EBITDA margin, payroll as a percentage of revenue, rent as a percentage of revenue, patient volume growth, cash balance, burn rate, payback period, return on equity, and break-even timing. It may also incorporate benchmark-style comparisons so users can evaluate whether the projected clinic performance appears reasonable compared with industry expectations. For example, if payroll costs are too high relative to revenue, the model can highlight pressure on margins. If utilization is too low, the user can see that marketing, referral development, or scheduling efficiency may need attention. If revenue per practitioner is improving, the clinic may be moving toward stronger operating leverage. The KPI dashboard is useful for founders and clinic managers because it turns the financial forecast into a performance management tool. It is also useful for consultants and analysts because it supports a clearer discussion of strengths, weaknesses, and improvement opportunities. By monitoring KPIs, users can make more informed decisions about pricing, staffing, patient acquisition, cost control, and expansion timing.
Startup Cost and Capital Expenditure Plan
The startup cost and capital expenditure plan helps users estimate the initial investment required to launch or expand a physiotherapy clinic. Opening a clinic often requires significant upfront spending before the business begins generating stable revenue. This section may include clinic build-out and renovation, therapeutic equipment, treatment tables, exercise equipment, office furniture, technology, practice management software, deposits, licenses, insurance setup, initial supplies, signage, pre-launch marketing, legal and professional fees, and working capital reserves. Users can adjust the cost categories and timing to reflect their specific location, clinic size, lease terms, equipment strategy, and launch plan. The outputs may show total initial capital required, capital expenditure by category, pre-opening expenses, and the amount of funding needed before the clinic reaches positive cash flow. This is useful for business planning because underestimating startup costs can create cash pressure before the clinic has had time to build a patient base. It is also important for lenders and investors because they want to see a clear use of funds and understand how the requested capital will be spent. By organizing startup costs in detail, the model helps users make better decisions about buying versus leasing equipment, phasing renovations, delaying non-essential purchases, and setting aside enough working capital for the early operating period.
Similar ProductsOther customers were also interested in...



 HenrySheykin
Outpatient Clinic Financial Model Excel Template
The Outpatient Clinic Financial Model helps users turn a clinic business concept into a structured, ... Read more

 Giorgos
Hospice & Home Care Agency – 5 Year Financia...
Financial Model providing an advanced 5-year financial plan for a startup or operating Hospice and H... Read more
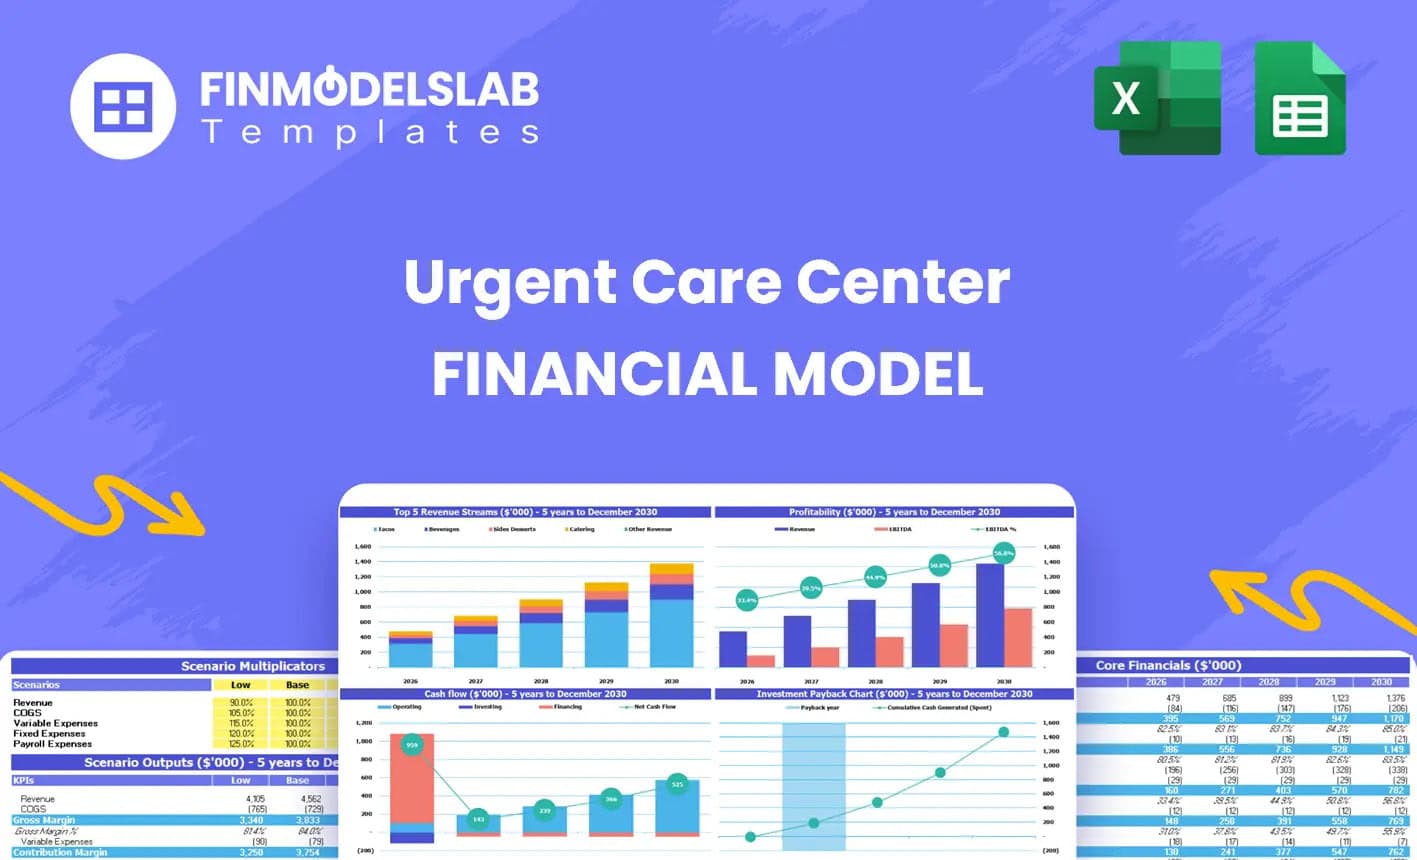
Urgent Care Center Financial Model Excel Template
The Urgent Care Center Financial Model helps users turn a walk-in clinic concept into a structured f... Read more

Medical Practice Financial Model Excel Template
The Medical Practice Financial Model helps users turn a clinic concept, expansion plan, or healthcar... Read more

Ophthalmology Financial Model Excel Template
The Ophthalmology Clinic Financial Model is a ready-to-use financial model template designed to help... Read more

Dental Practice Financial Model Excel Template
The Dental Clinic Financial Model helps users turn a dental practice concept, launch plan, or expans... Read more

Veterinary Financial Model Excel Template
The Veterinary Clinic Financial Model Financial Model Template helps entrepreneurs, clinic owners, c... Read more

Gynecology Financial Model Excel Template
The Gynecology Clinic Financial Model Financial Model Template helps entrepreneurs, clinic founders,... Read more

Clinic Financial Model Excel Template
The Healthcare Clinic Financial Model helps founders, clinic owners, consultants, analysts, and busi... Read more

Nutritionist Financial Model Excel Template
The Nutritionist Financial Model Financial Model Template helps turn a nutrition practice, dietitian... Read more
You must log in to submit a review.