
0 ITEMS

Restaurant & Multi-Location Financial Model Excel – 60-Month Forecast, 30 Locations, Debt & Cash Flow
A premium 60-month restaurant group financial model with 30 prepared location slots, 15 fictional examples, restaurant-level revenue and costs, expansion planning, debt and equity, three integrated monthly financial statements, store rankings, break-even analysis, Base/Upside/Downside scenarios and eight native dashboard charts. Includes 30 Excel worksheets and a 33-page English PDF guide.

RESTAURANT & MULTI-LOCATION FINANCIAL MODEL – 60-MONTH SIGNATURE EDITION
Build a connected five-year financial plan for a growing restaurant group — from guest demand and unit economics to restaurant openings, consolidated cash flow and funding requirements.
The Restaurant & Multi-Location Financial Model by SheetworksStudio is a fully editable Excel planning system designed for restaurant owners, hospitality operators, finance teams, consultants and analysts.
It connects 30 prepared restaurant slots to a consolidated 60-month financial forecast, including 15 fictional example locations and 15 blank expansion positions.
The complete package includes 30 interconnected worksheets, eight native Excel dashboard charts, three operating scenarios, three integrated financial statements and a detailed 33-page English user guide.
📊 1. EXECUTIVE DASHBOARD & GROUP PERFORMANCE
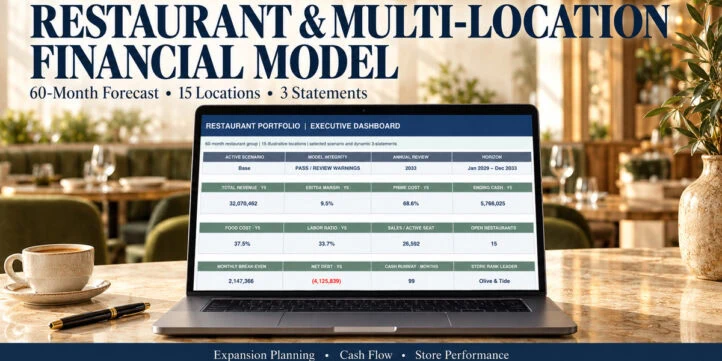
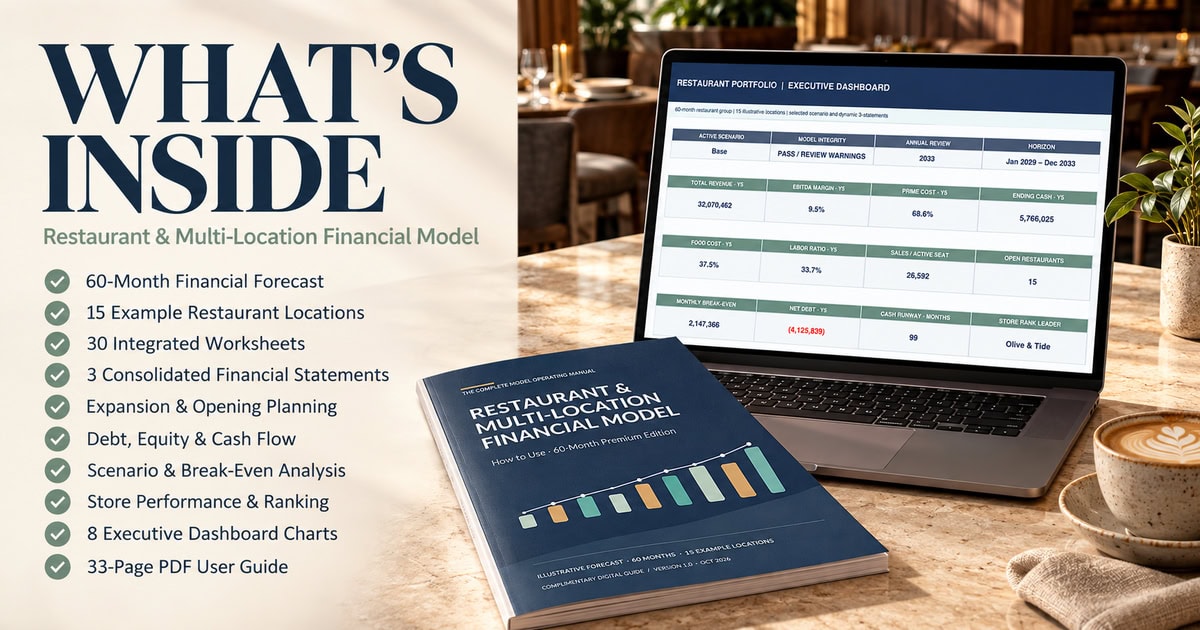
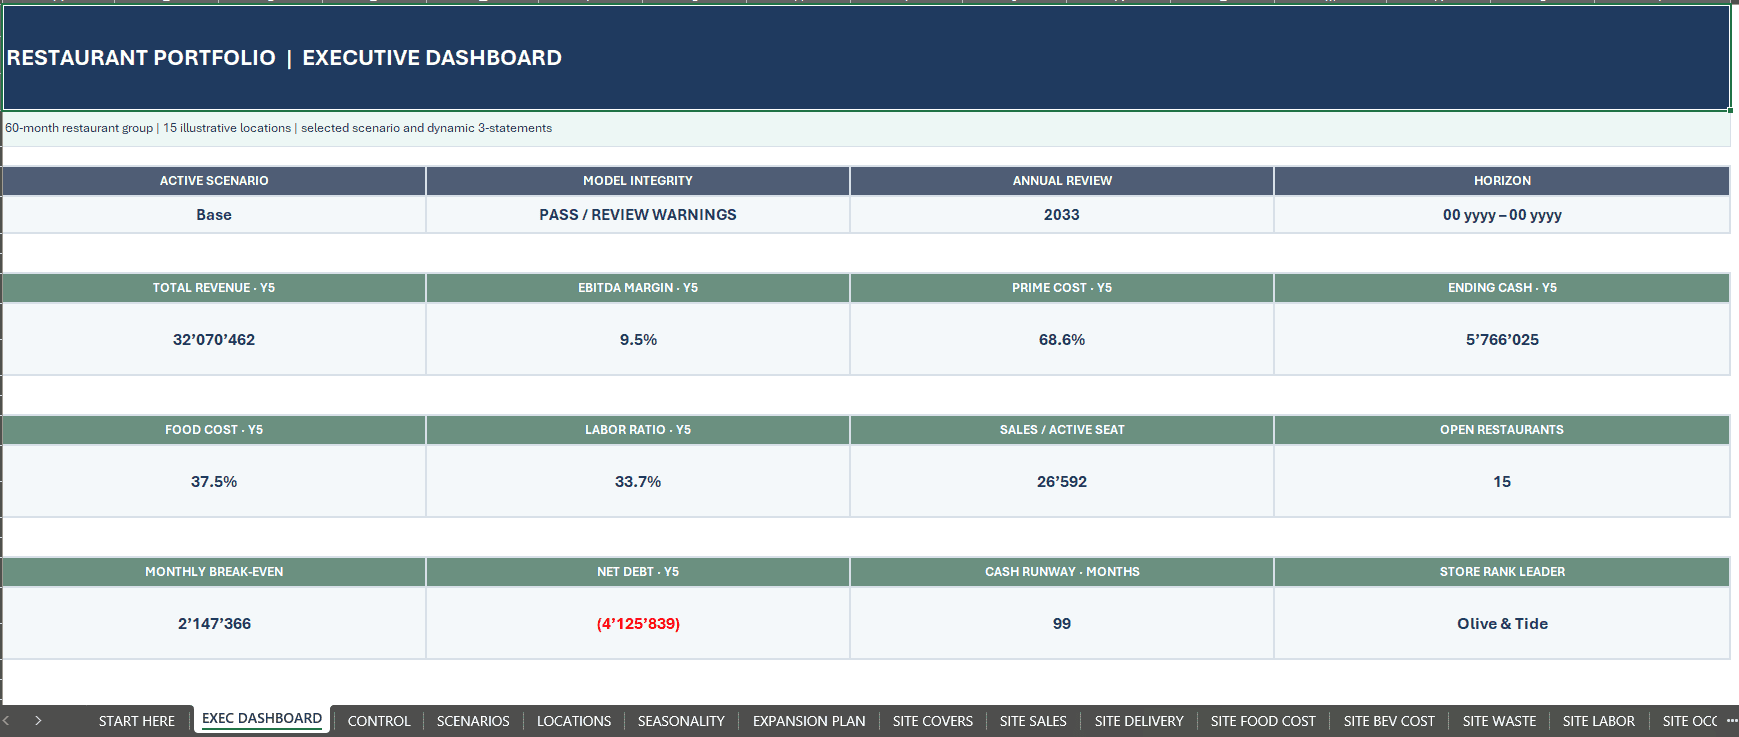
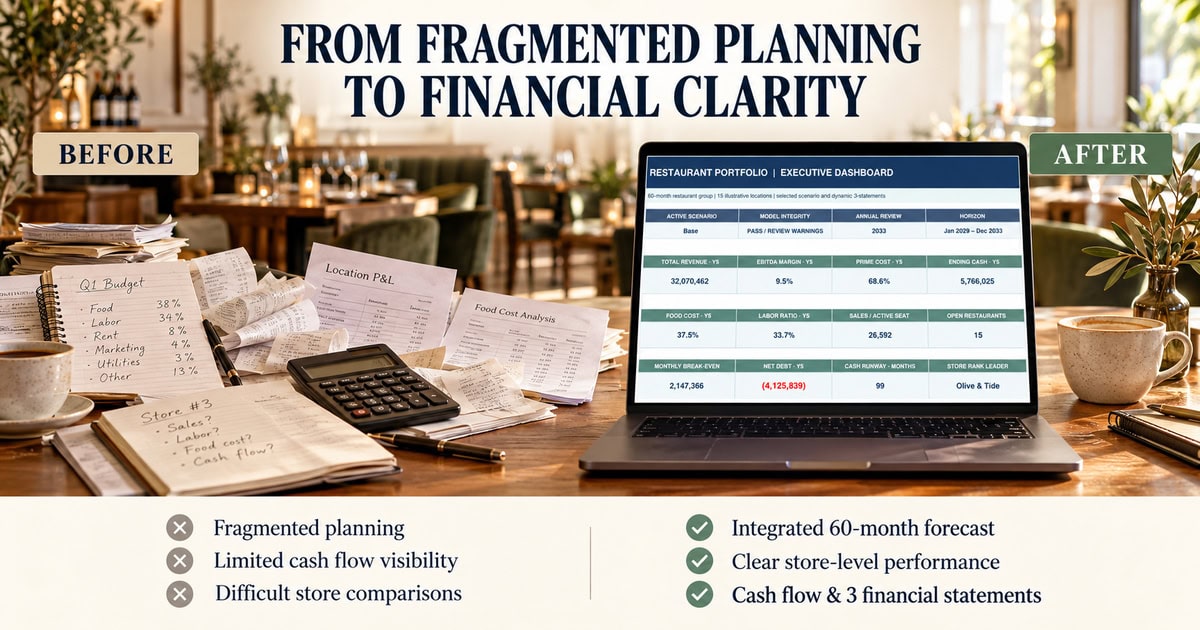
Review the operating and financial health of your restaurant portfolio through linked KPI cards and eight native Excel charts.
Dashboard indicators include:
✓ Year-5 Revenue and EBITDA Margin
✓ Prime-Cost Ratio and Food-Cost Ratio
✓ Labor Ratio
✓ Ending Cash
✓ Open Restaurant Count
✓ Sales per Active Seat
✓ Monthly Break-Even Revenue
✓ Net Debt
✓ Simplified Cash Runway
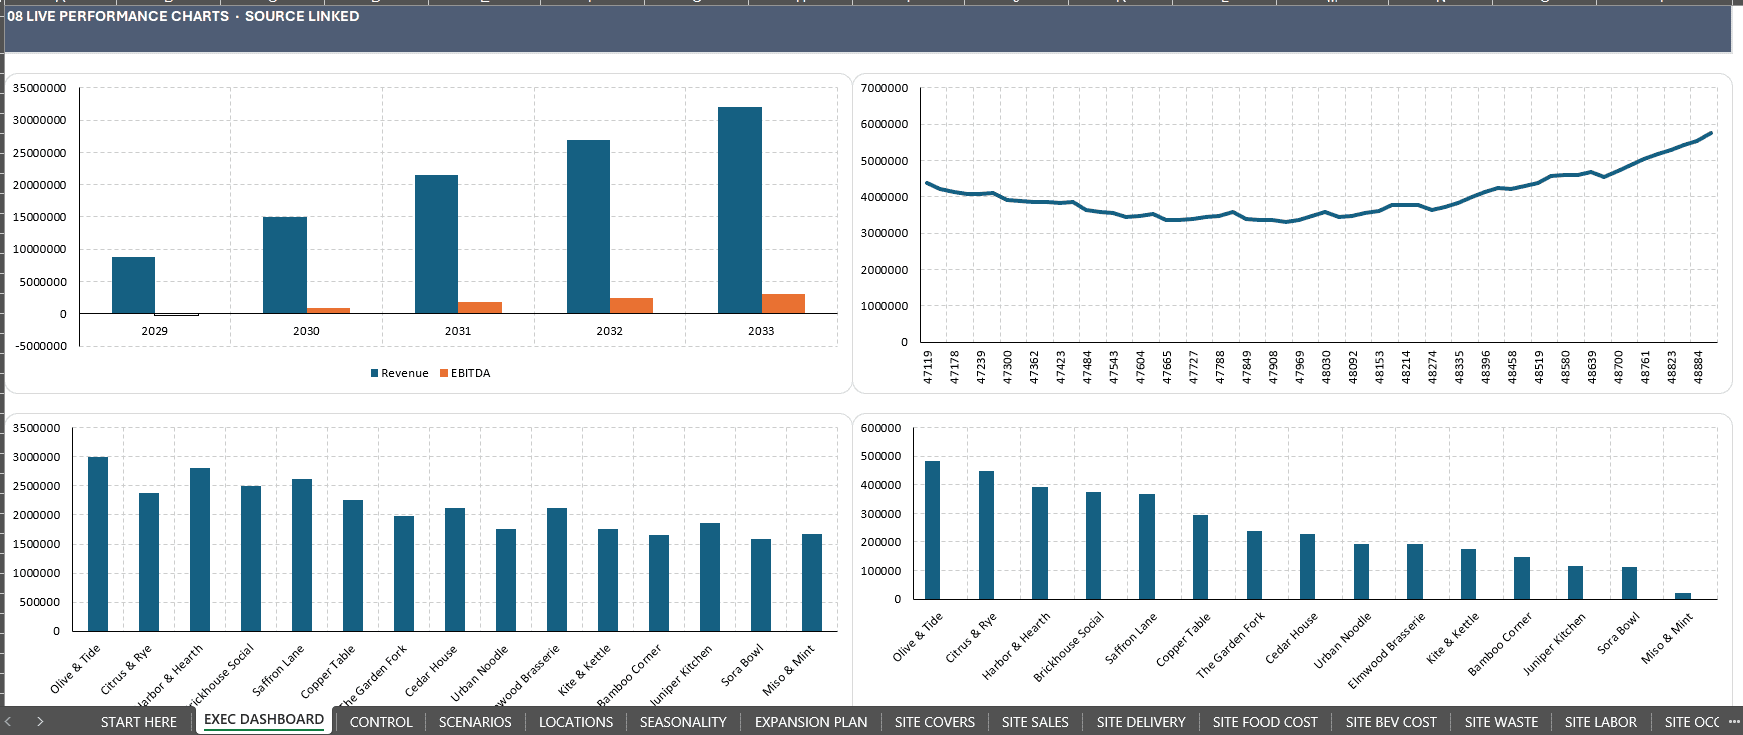
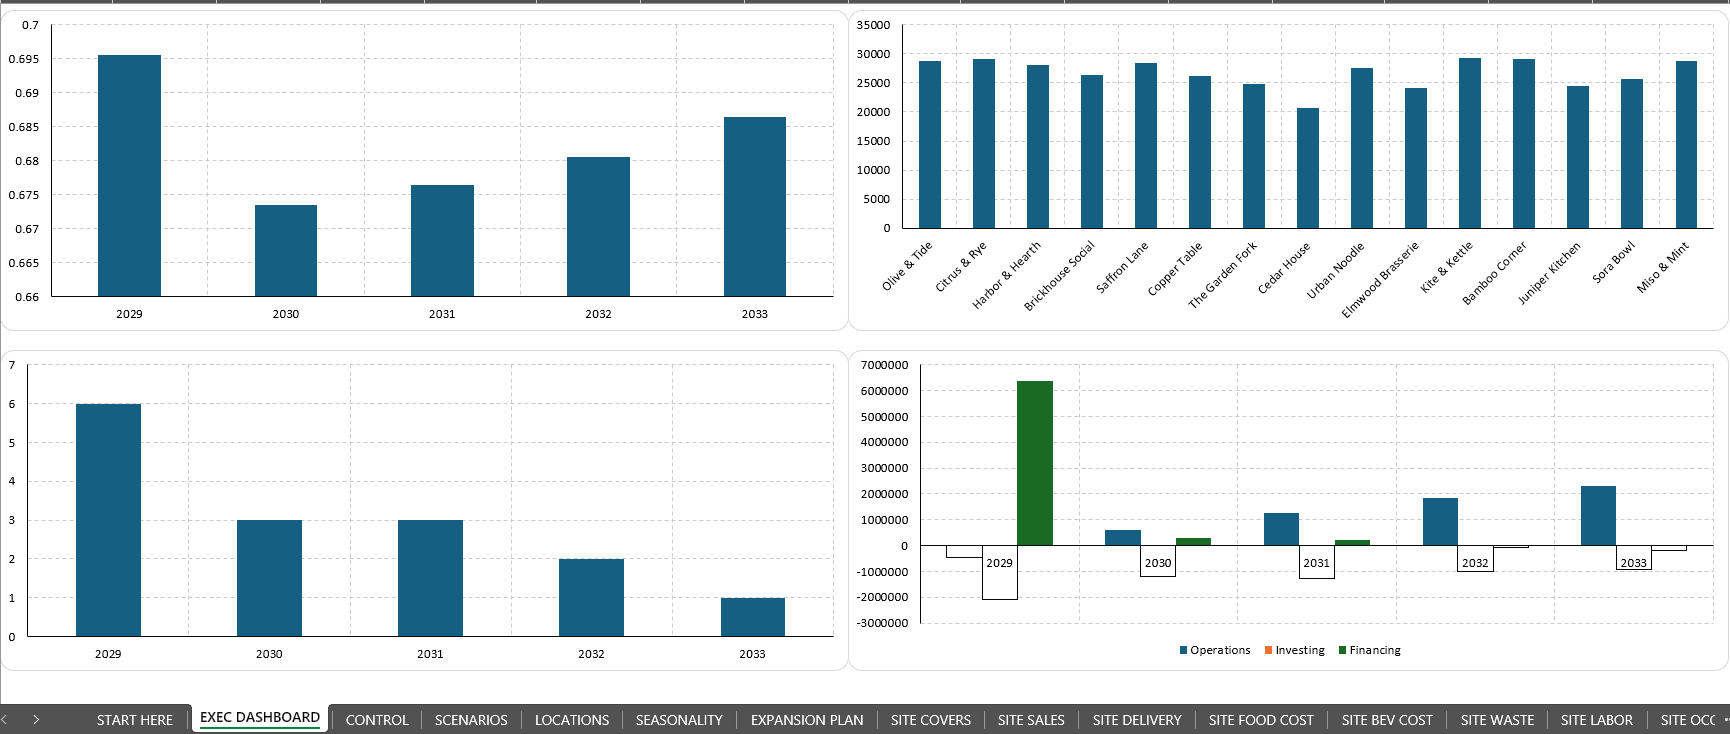
The eight dashboard charts visualize five-year revenue and EBITDA, monthly closing cash, store sales rankings, positive and negative restaurant EBITDA, prime-cost trends, sales per seat, restaurant openings and operating, investing and financing cash flow.
A dedicated STORE REPORT provides restaurant-level comparisons, rankings, sales and profitability metrics.
🏘️ 2. 30-LOCATION RESTAURANT OPERATING MODEL
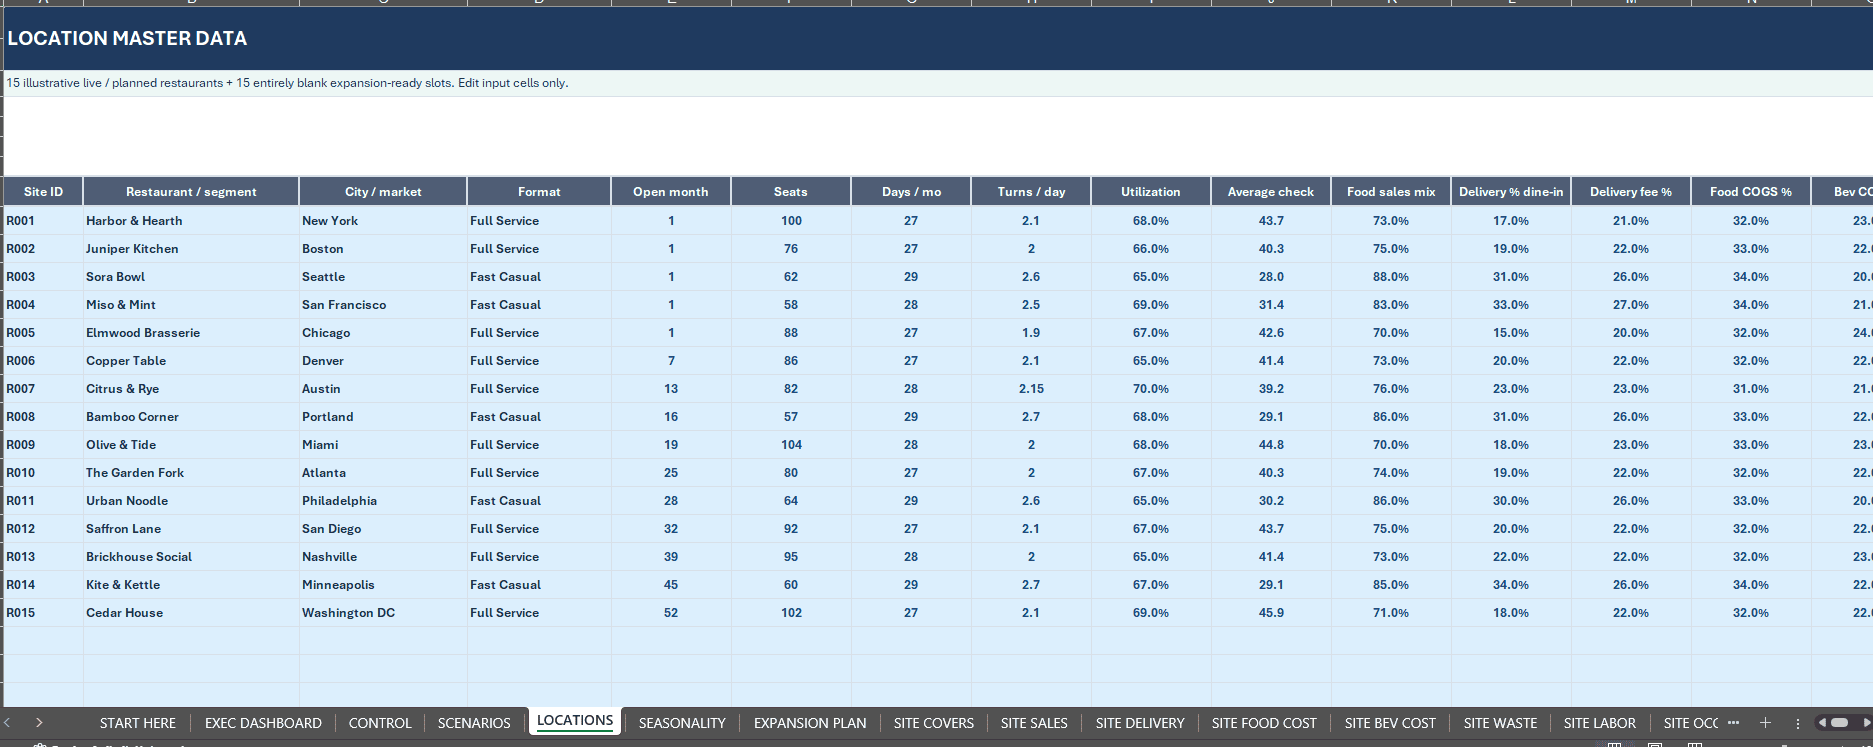
Configure up to 30 restaurants using the prepared LOCATIONS register.
Fifteen fictional sample restaurants demonstrate established and newly opening operations, with fifteen additional slots ready for expansion.
Editable operating drivers include:
✓ Seating Capacity and Table Turns
✓ Operating Days per Month
✓ Customer Utilization
✓ Guest Demand Seasonality
✓ New Restaurant Ramp-Up
✓ Average Guest Check
✓ Food and Beverage Mix
✓ Delivery Sales
✓ Same-Store Growth Assumptions
Linked operating schedules calculate restaurant demand, dine-in revenue, delivery revenue, ingredient costs, food waste, payroll, rent, local operating expenses and store-level EBITDA.
The forecast start date is editable and supports five annual reporting periods.
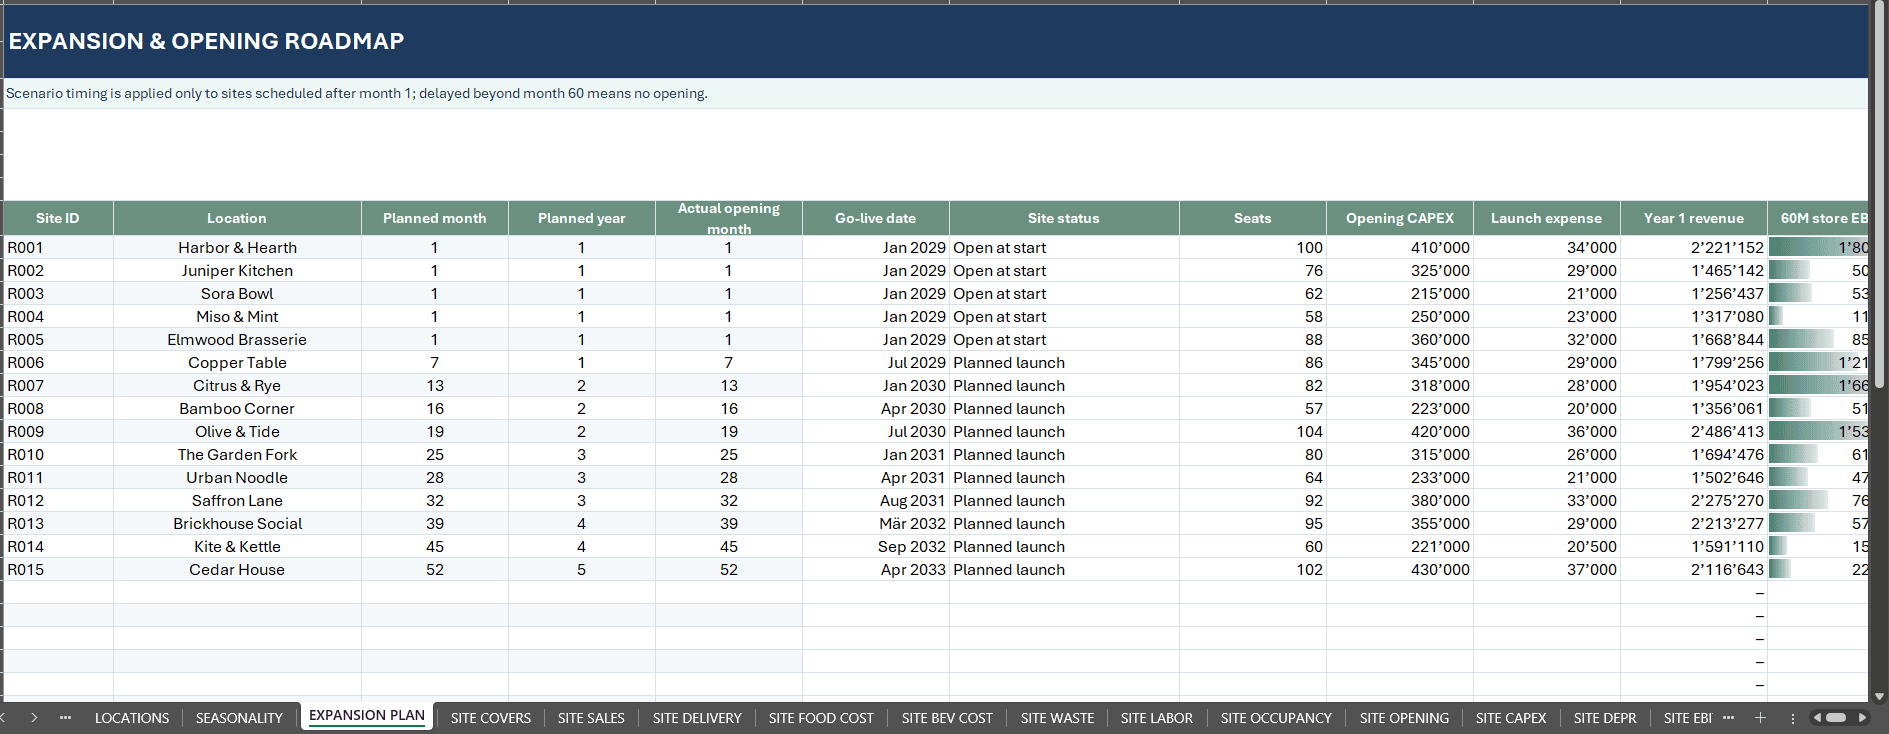
🏗️ 3. RESTAURANT EXPANSION & CAPITAL PLANNING
Plan new restaurant openings and understand their effects on the overall group.
Features include:
✓ Restaurant Opening Months
✓ New-Location Ramp-Up Assumptions
✓ Opening Capital Expenditure
✓ Launch Expenses
✓ Sustaining Investments
✓ Development and Expansion Timing
✓ New-Site Financing Requirements
✓ Group Cash Flow Effects
The EXPANSION PLAN connects opening assumptions with monthly financial performance and funding.
Evaluate the implications of opening new restaurants sooner or later under different operating conditions.
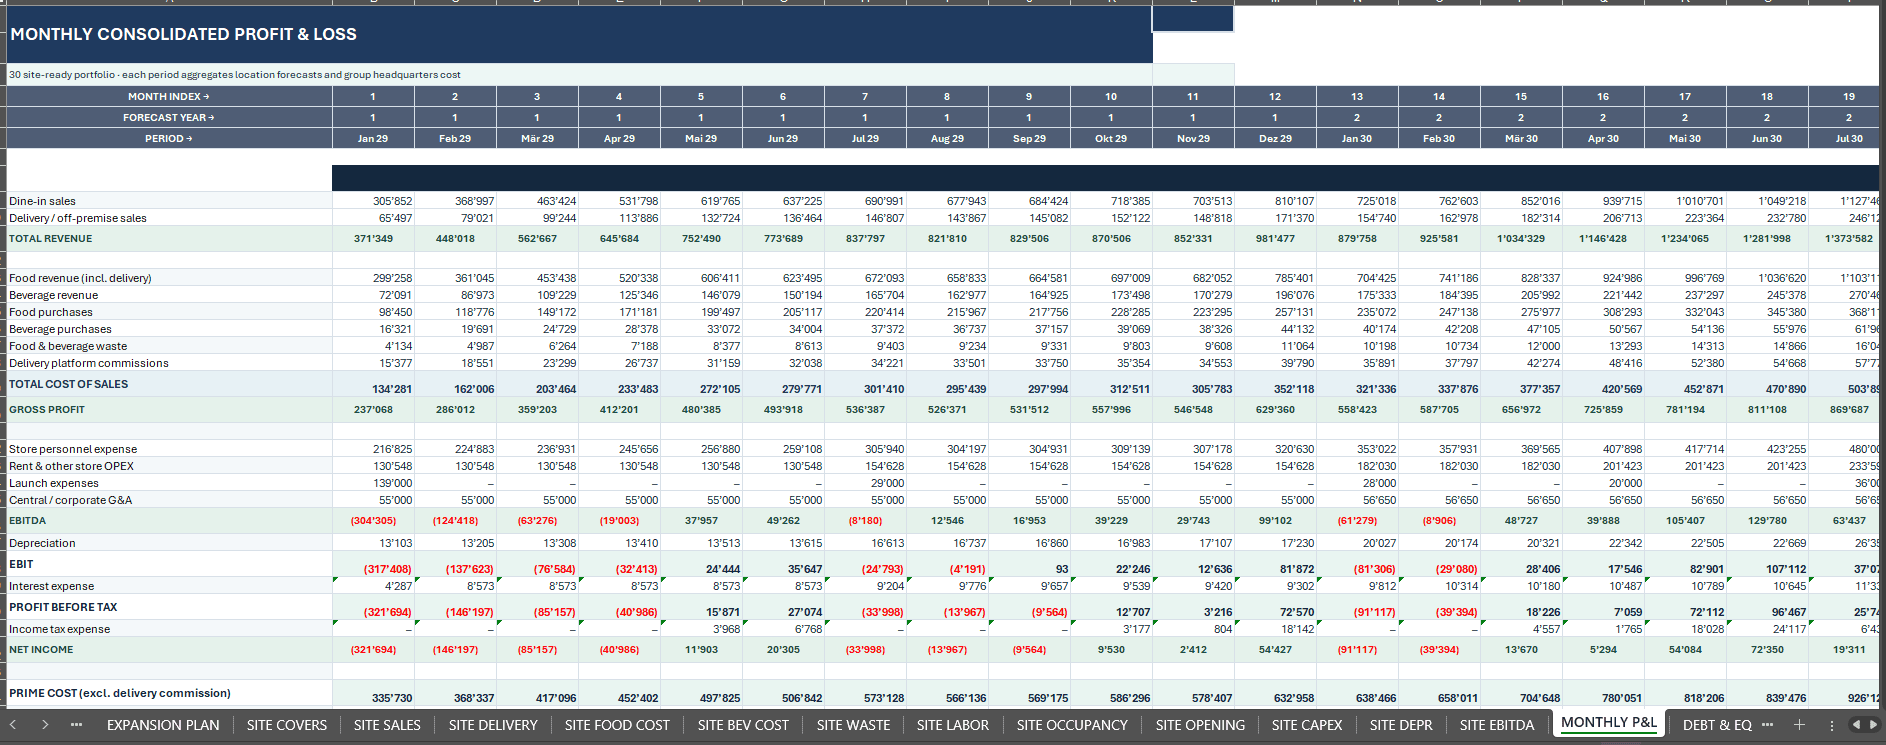
💼 4. THREE INTEGRATED FINANCIAL STATEMENTS
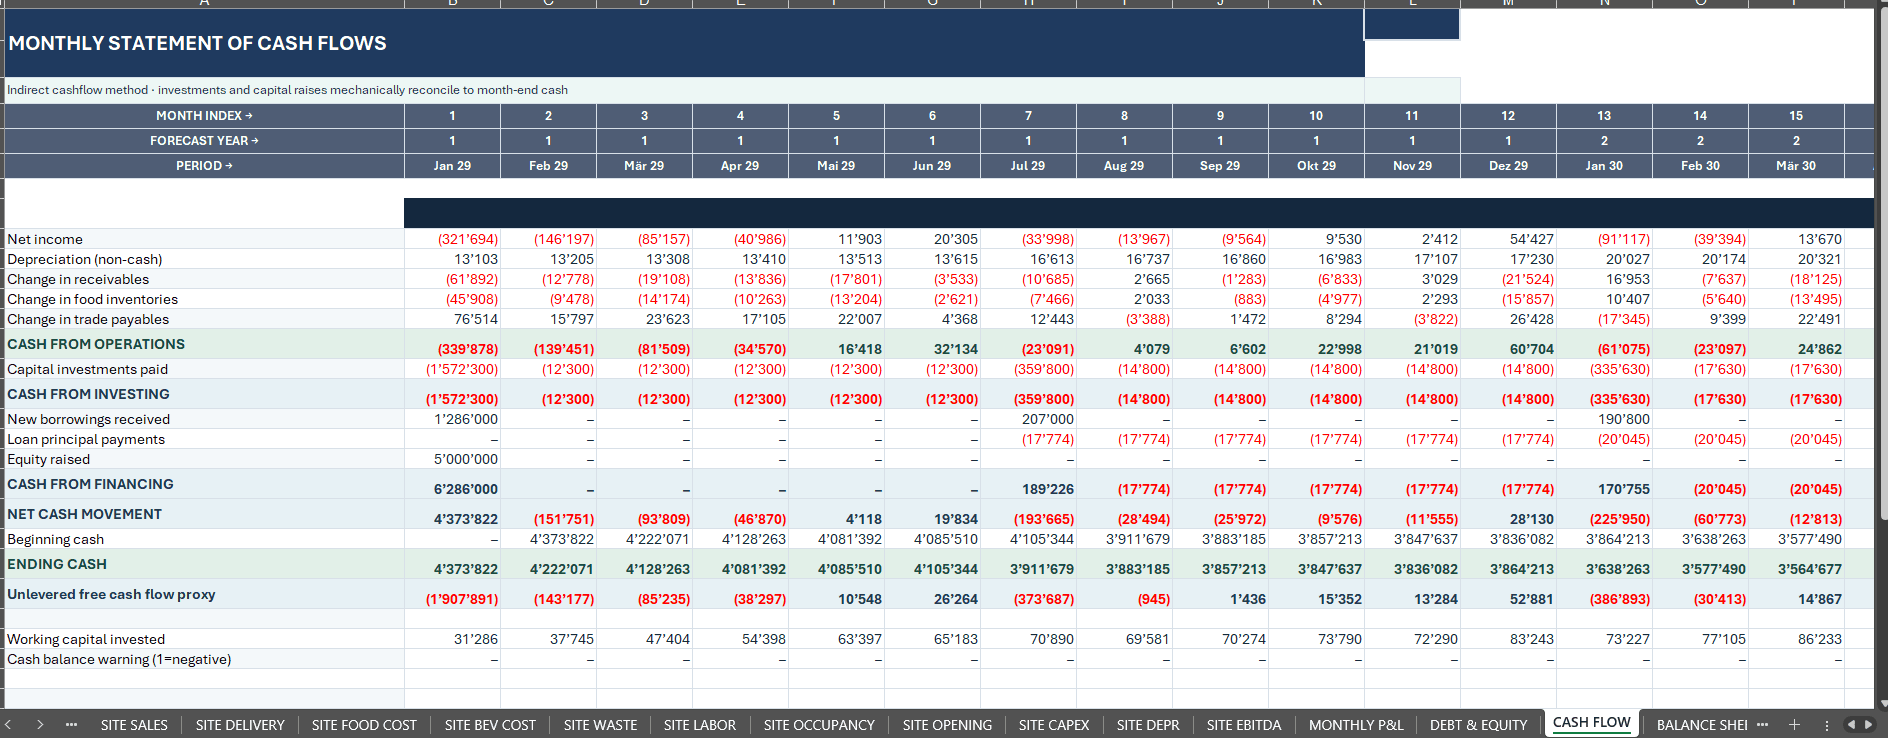
Review the financial implications of restaurant operations through three connected monthly financial statements:
✓ Income Statement / Profit & Loss
✓ Cash Flow Statement
✓ Balance Sheet
Supporting schedules connect:
✓ Restaurant Sales and Operating Expenses
✓ Corporate Overhead
✓ Food and Beverage Costs
✓ Payroll
✓ Working Capital
✓ Capital Expenditure
✓ Depreciation
✓ Debt and Interest
✓ Equity Funding
✓ Simplified Corporate Income Tax
✓ Closing Cash and Net Debt
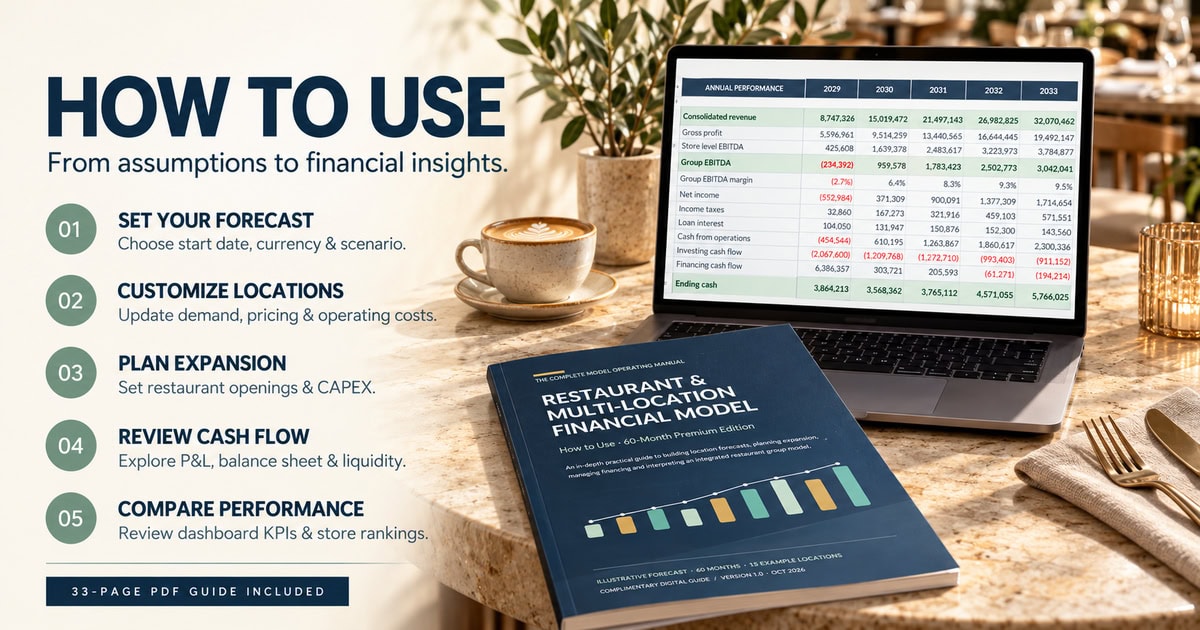
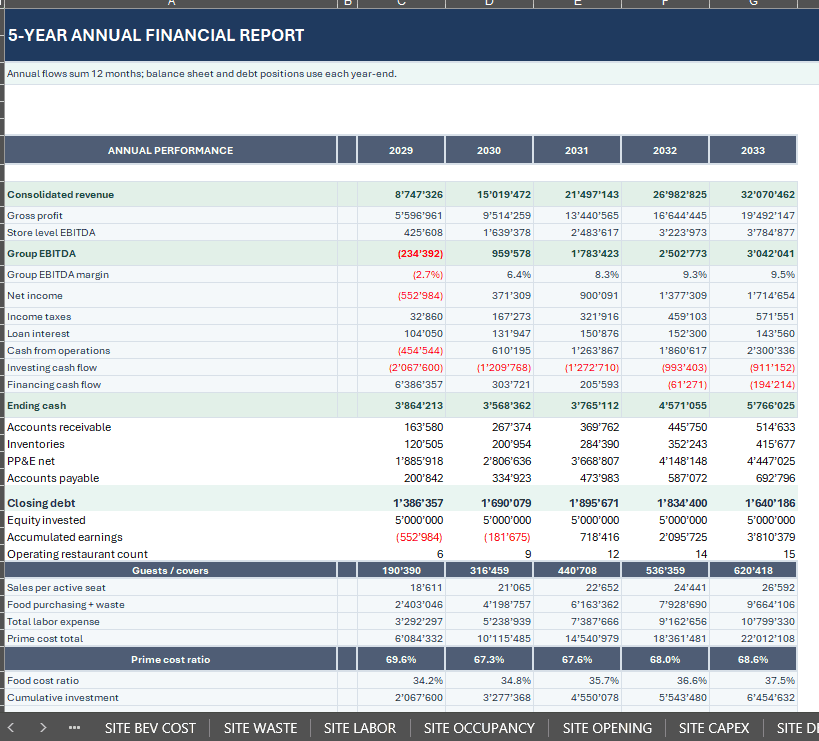
The ANNUAL SUMMARY consolidates monthly calculations into five annual financial and operating periods.
This provides a connected view of growth, profitability, investment requirements and liquidity.
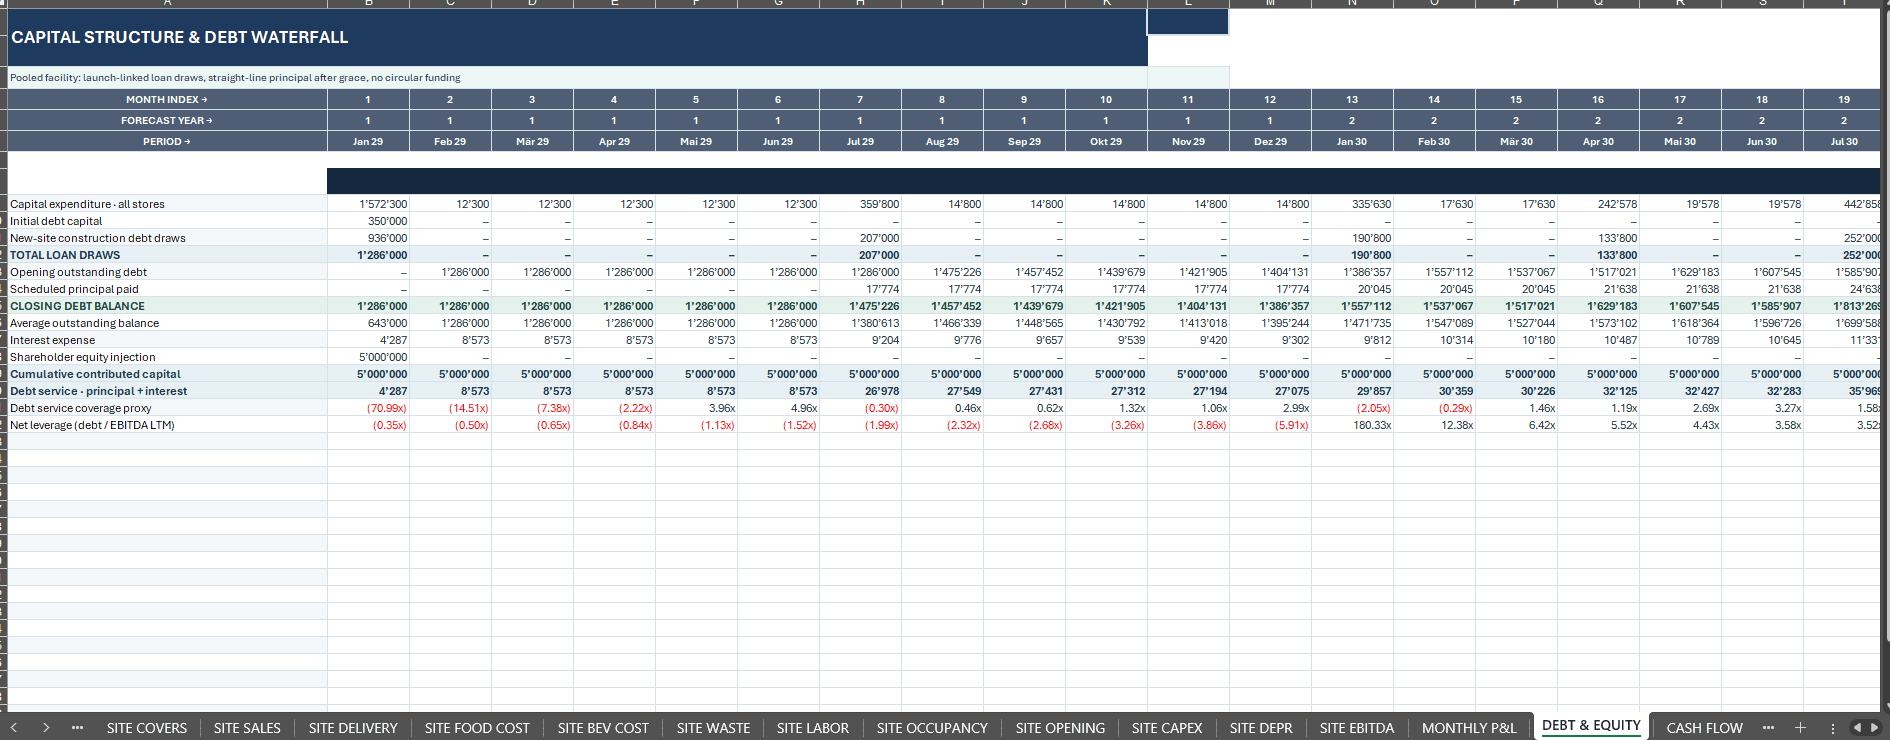
🏦 5. DEBT, EQUITY & LIQUIDITY PLANNING
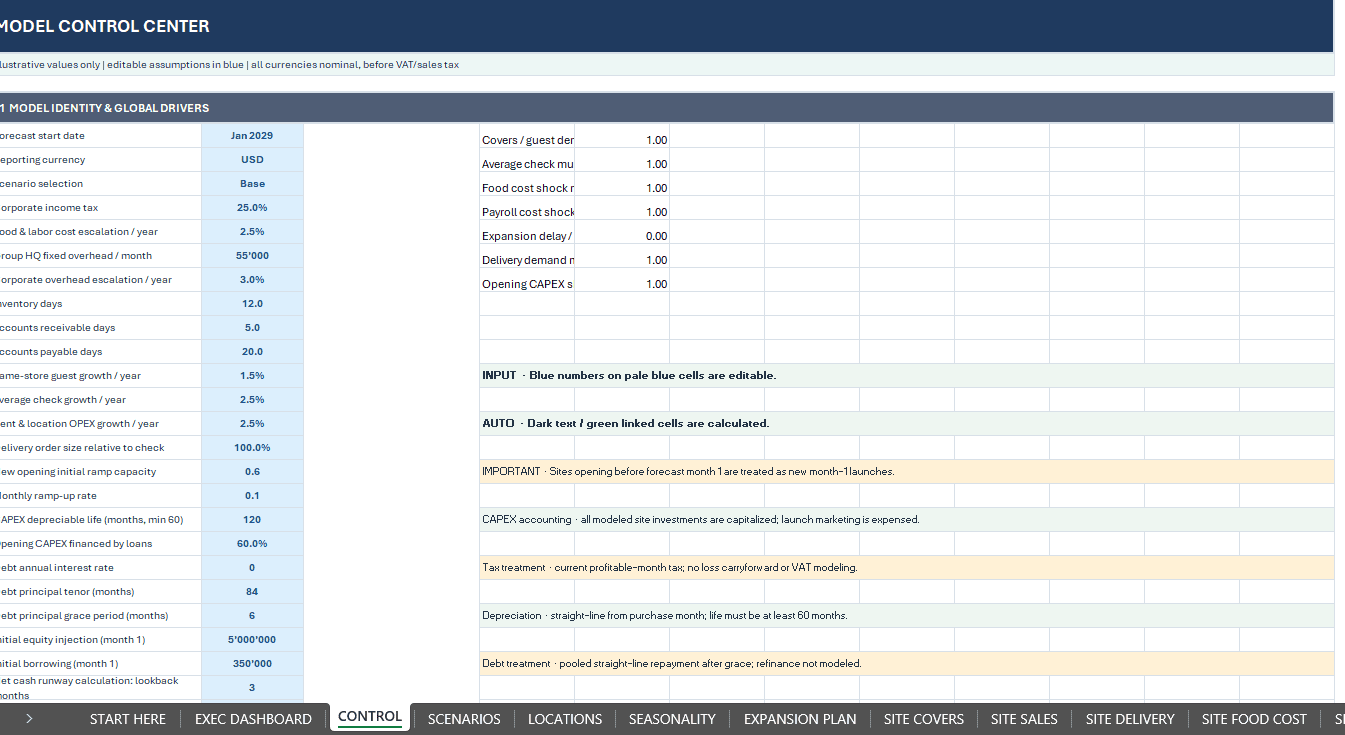
Link restaurant expansion assumptions to business financing requirements.
Configure:
✓ Opening Equity
✓ Initial Borrowing
✓ Debt-Funded Opening CAPEX
✓ Annual Debt Interest
✓ Loan Repayment Tenor
✓ Principal Grace Period
✓ Debt Balances
✓ Equity Contributions
The DEBT & EQUITY worksheet connects financing to the operating forecast, cash flow and balance sheet.
Review closing cash balances, debt obligations and financial warning indicators.
Financing gaps and liquidity risks remain visible rather than being concealed through artificial financial assumptions.
🔄 6. BASE, UPSIDE & DOWNSIDE SCENARIOS
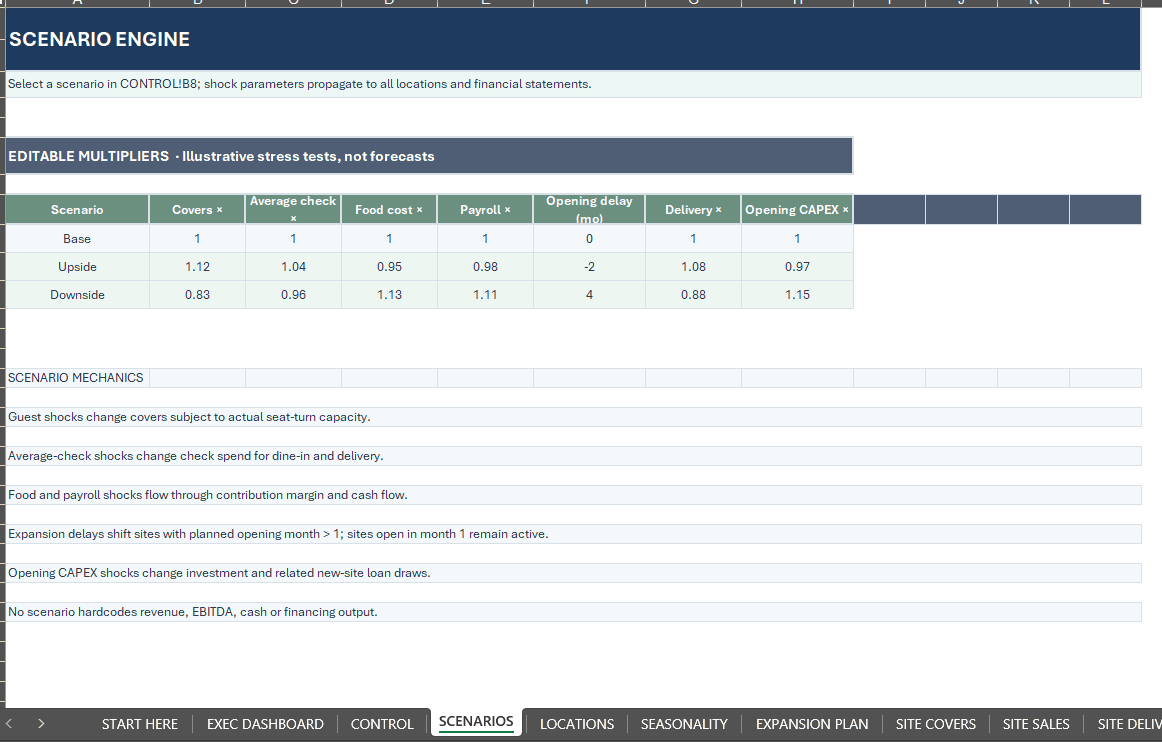
Analyze alternative restaurant operating conditions using three selectable scenarios.
BASE — Central financial assumptions.
UPSIDE — More favorable operating assumptions.
DOWNSIDE — Reduced demand, increased costs and potential delays.
Editable scenario factors include:
✓ Customer Demand
✓ Average Guest Checks
✓ Food Costs
✓ Payroll Expenses
✓ Restaurant Opening Delays
✓ Delivery Demand
✓ Opening Capital Expenditure
Scenario changes flow through the restaurant schedules, financial statements and group performance calculations.
Use these scenarios to compare the effects of expansion timing, operating profitability and financing pressure.
📈 7. BREAK-EVEN & SENSITIVITY ANALYSIS
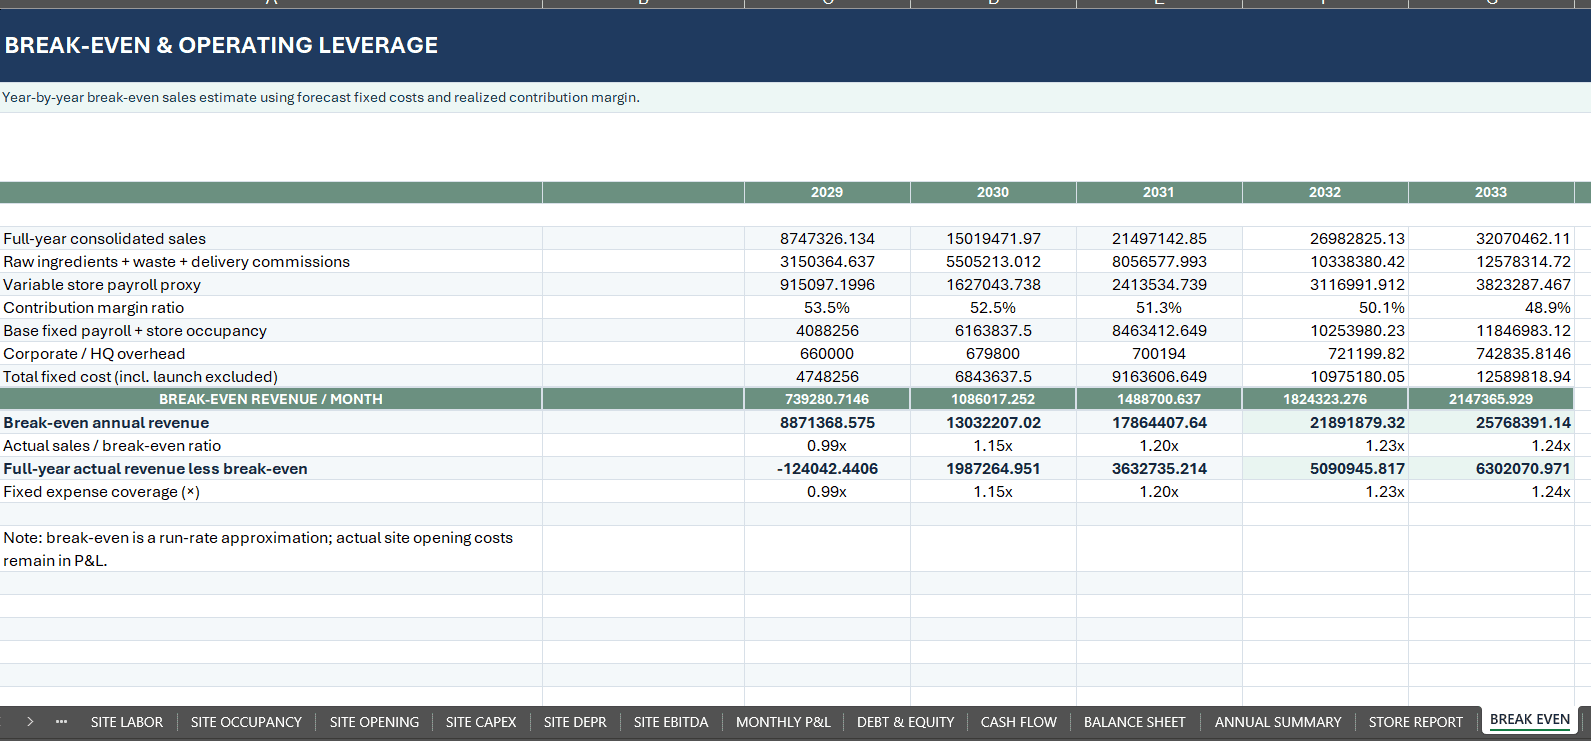
The BREAK EVEN worksheet provides estimated revenue thresholds using forecast contribution margins and fixed operating costs.
Review:
✓ Monthly Break-Even Revenue
✓ Annual Break-Even Revenue
✓ Contribution Margin
✓ Fixed-Cost Coverage
✓ Actual Sales Versus Break-Even
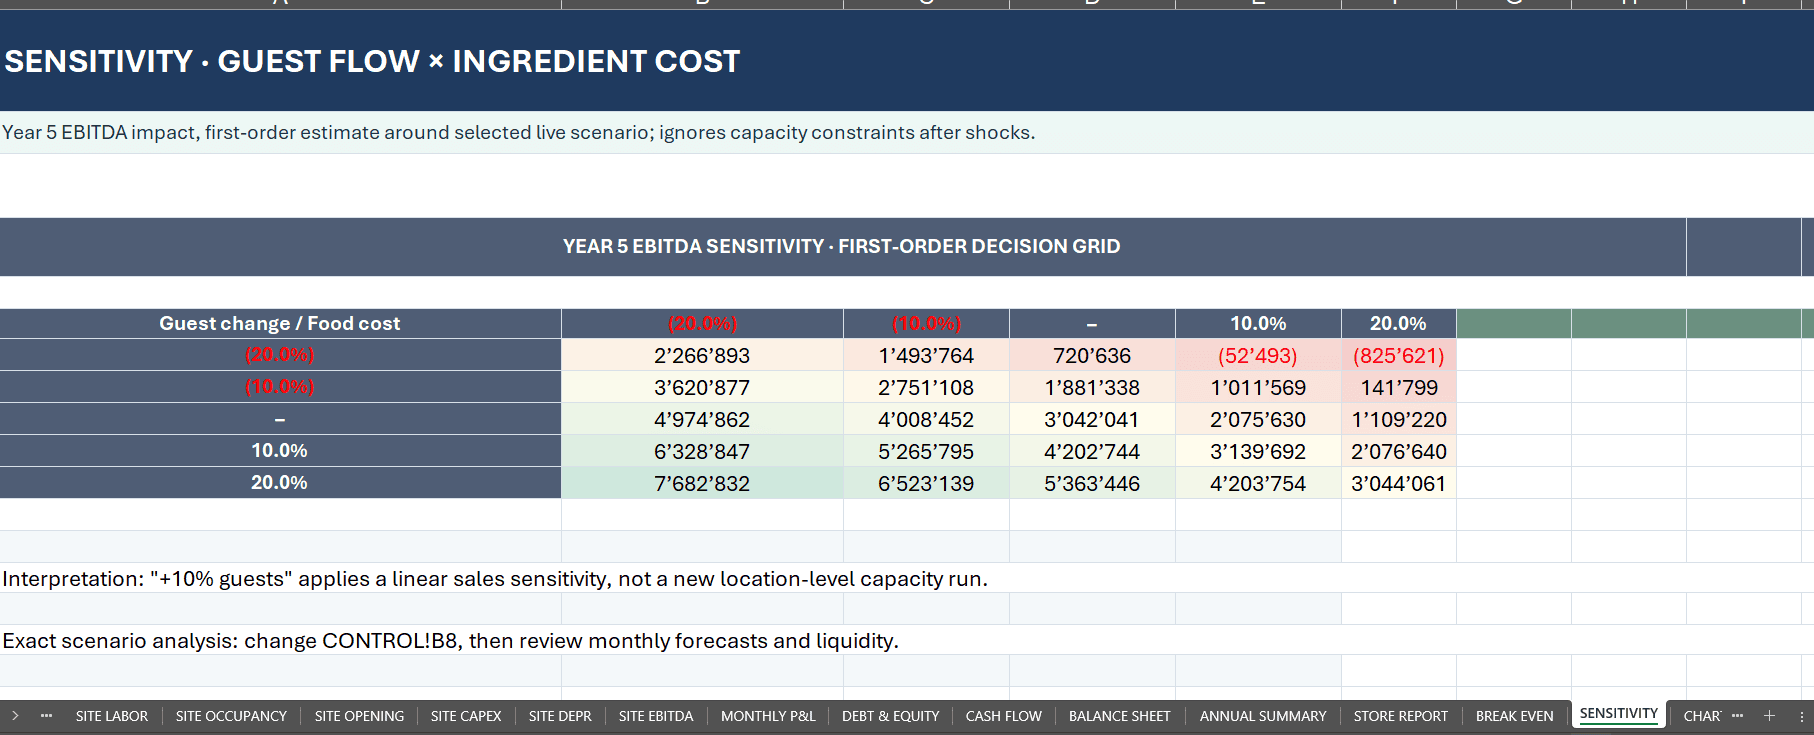
A two-way sensitivity grid estimates the directional effect of customer-demand and ingredient-cost changes on Year-5 EBITDA.
The sensitivity grid is an approximation rather than a full recalculation of every restaurant under each combination of assumptions.
For integrated financial analysis, use the main scenario engine.
📋 8. STORE COMPARISON & RESTAURANT RANKING
Compare individual restaurants through the STORE REPORT.
Select the reporting year and review:
✓ Annual Restaurant Revenue
✓ Delivery Sales
✓ Food and Beverage Costs
✓ Labor Expenses
✓ Occupancy Expenses
✓ Opening Costs
✓ Restaurant-Level EBITDA
✓ EBITDA Margins
✓ Restaurant Rankings
This allows managers and financial analysts to identify high-performing and underperforming restaurants using a consistent reporting framework.
✅ 9. MODEL CONTROLS & FINANCIAL WARNING INDICATORS
The dedicated MODEL CHECKS worksheet provides monthly financial reconciliation and operating warning indicators.
Control areas cover:
✓ Balance Sheet Reconciliation
✓ Monthly Cash Continuity
✓ Debt Balance Roll-Forward
✓ Restaurant Revenue Consolidation
✓ Group EBITDA Reconciliation
✓ Food and Beverage Revenue Bridges
✓ Store Operating Cost Allocation
✓ Opening Investment Reconciliation
✓ Negative Borrowing Balance Detection
Additional commercial warnings help highlight negative EBITDA, liquidity pressure, elevated prime costs and high labor ratios.
A passing mathematical control confirms that the relevant calculation relationships reconcile. It does not guarantee commercial profitability, adequate funding or acceptable business risk.
📦 10. WHAT’S INCLUDED
FILE 1 — RESTAURANT & MULTI-LOCATION FINANCIAL MODEL (.XLSX)
One fully editable Excel workbook containing:
✓ 30 Interconnected Worksheets
✓ 60 Monthly Forecast Periods
✓ Five Annual Financial Summaries
✓ 30 Prepared Restaurant Positions
✓ 15 Fictional Example Restaurants
✓ 15 Blank Expansion Slots
✓ Eight Native Excel Dashboard Charts
✓ Three Operating Scenarios
✓ Restaurant-Level Revenue and Cost Calculations
✓ Store-Level EBITDA
✓ Expansion and Capital Planning
✓ Debt and Equity Financing
✓ Three Financial Statements
✓ Break-Even Analysis
✓ Sensitivity Analysis
✓ Store Ranking and Performance Reporting
✓ Financial Model Checks
✓ Internal Navigation and Guidance
FILE 2 — COMPLETE HOW-TO-USE GUIDE (.PDF)
A detailed 33-page English user manual covering:
✓ Initial Workbook Setup
✓ Navigation and Editable Inputs
✓ Restaurant Operating Assumptions
✓ Guest Demand and Seasonality
✓ Restaurant Expansion
✓ Operating Costs and CAPEX
✓ Financing
✓ Financial Statements
✓ Dashboard and KPI Interpretation
✓ Scenario and Sensitivity Analysis
✓ Break-Even Calculations
✓ Model Controls
✓ Troubleshooting
✓ Modeling Conventions and Limitations
Both purchased files are supplied in one downloadable ZIP package.
The PDF guide may also be offered separately as a complimentary reference document without the paid Excel workbook.
👥 11. WHO IS THIS FINANCIAL MODEL FOR?
Designed for:
✓ Restaurant Group Owners
✓ Multi-Location Operators
✓ Restaurant Expansion Teams
✓ Hospitality CFOs and Finance Managers
✓ Financial Planning & Analysis Professionals
✓ Regional Restaurant Chains
✓ Financial Consultants
✓ Business Advisers
✓ Restaurant Investment Analysts
🧭 12. HOW TO USE
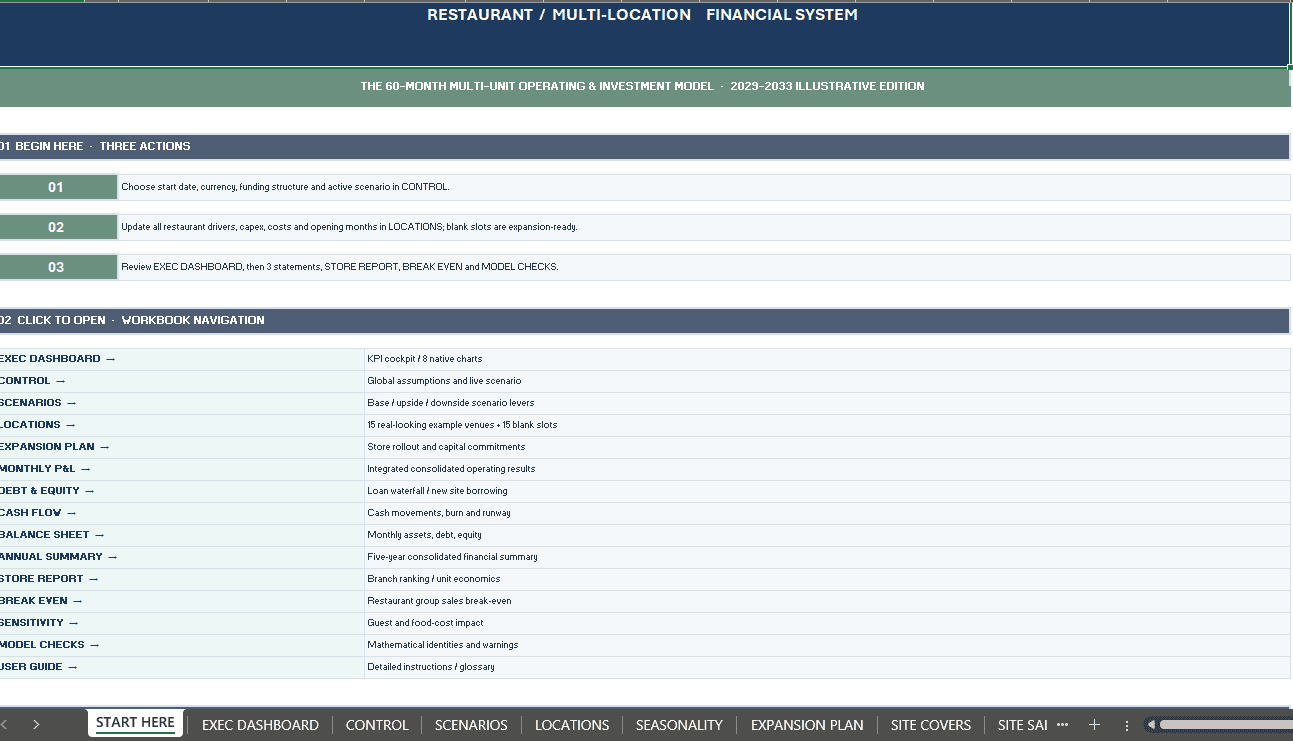
STEP 1 — Review START HERE and the included PDF guide.
STEP 2 — Configure dates, currency, financing and scenario settings in CONTROL.
STEP 3 — Customize LOCATIONS and SEASONALITY with company-specific assumptions.
STEP 4 — Update restaurant openings, operating costs and capital investments.
STEP 5 — Review the Executive Dashboard, financial statements, annual summary, break-even and store rankings.
STEP 6 — Investigate the mathematical model checks and commercial warnings before relying on projected results.
⚙️ 13. TECHNICAL SPECIFICATIONS
Forecast: 60 Months / Five Years
Worksheets: 30
Restaurant Capacity: 30 Prepared Locations
Illustrative Restaurants: 15
Blank Expansion Positions: 15
Scenarios: Base, Upside, Downside
Financial Reporting: Three Monthly Statements
Native Dashboard Charts: Eight
Documentation: 33-Page English PDF Guide
File Formats: XLSX + PDF
Recommended Software: Microsoft Excel Desktop
Macros / VBA: Not Required
External Data Connections: Not Required
Delivery: Digital ZIP Download
Google Sheets import has not been functionally validated. Chart rendering, dropdowns, formulas and formatting should be reviewed after conversion.
The reporting currency changes the displayed currency label and does not perform automatic foreign-exchange conversion.
🛡️ 14. IMPORTANT MODEL LIMITATIONS & DISCLAIMER
The workbook contains fictional restaurant records and illustrative financial assumptions for demonstration, financial planning and educational analysis.
The financial model uses simplified working-capital, debt, depreciation and corporate taxation conventions.
It does not include live POS integrations, automated bank feeds, detailed lease accounting, franchise royalties, tax-loss carryforwards, refinancing, complex group eliminations or jurisdiction-specific tax compliance.
Break-even and cash-runway outputs are financial-model estimates and should not be interpreted as guaranteed operational thresholds.
Illustrative scenario results may include negative EBITDA or cash balances. These outcomes do not establish that a business is sufficiently financed or commercially viable.
This is an independent, unofficial SheetworksStudio template, not accounting, financial, investment, legal or tax advice.
Users should independently verify source data, financial assumptions, calculations and warnings before using the model for material financial decisions.
PLAN OPERATIONS. COMPARE LOCATIONS. MODEL EXPANSION. UNDERSTAND CASH.
One Connected Excel Framework for Professional Restaurant Group Financial Planning.
SheetworksStudio | Premium Financial Modeling Templates
Similar ProductsOther customers were also interested in...



 eFinancialModels
Electric Vehicle (EV) Charging Station Financial M...
With this comprehensive 5- or 10-year monthly tool, investors can assess the viability of setting up... Read more

Financial Model for Mobile App | Mobile App Busine...
The Mobile App Financial Plan Template in Excel allows you to develop financial projections when lau... Read more

 HenrySheykin
Food Truck Financial Model Excel Template
The Food Truck Financial Model helps entrepreneurs, founders, business owners, consultants, and anal... Read more

Green Hydrogen Production from Wind Energy Financi...
The Green Hydrogen from Wind Financial Model aims to comprehensively forecast a horizon of 40 years ... Read more

Simple Mutual Non-Disclosure Agreement Template
Protect your business secrets with ease using our Simple Mutual Non-Disclosure Agreement Template. S... Read more

Solar Energy Financial Model
The Solar Energy Financial Model Spreadsheet Template in Excel assists you in preparing a sophistica... Read more

 Peter Graf
The Customer-Centric Financial Model for Restauran...
Starting a restaurant without a financial plan is like driving a car blindfolded. You wouldn´t do i... Read more
You must log in to submit a review.