
0 ITEMS

Commercial Real Estate Valuation & DCF Model Excel – 10-Year Rent Roll, NOI, Debt, IRR & DSCR
10-year commercial property underwriting model with 500-row rent roll, lease rollover, NOI, mortgage financing, DCF valuation, equity IRR, DSCR, 3 scenarios, 4 sensitivity matrices and 8 dashboard charts. Includes a 21-page PDF guide.
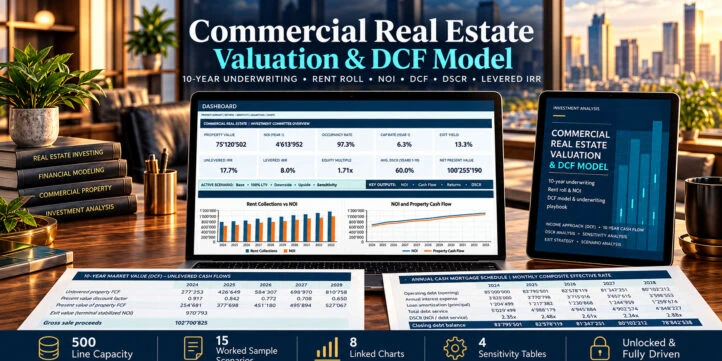
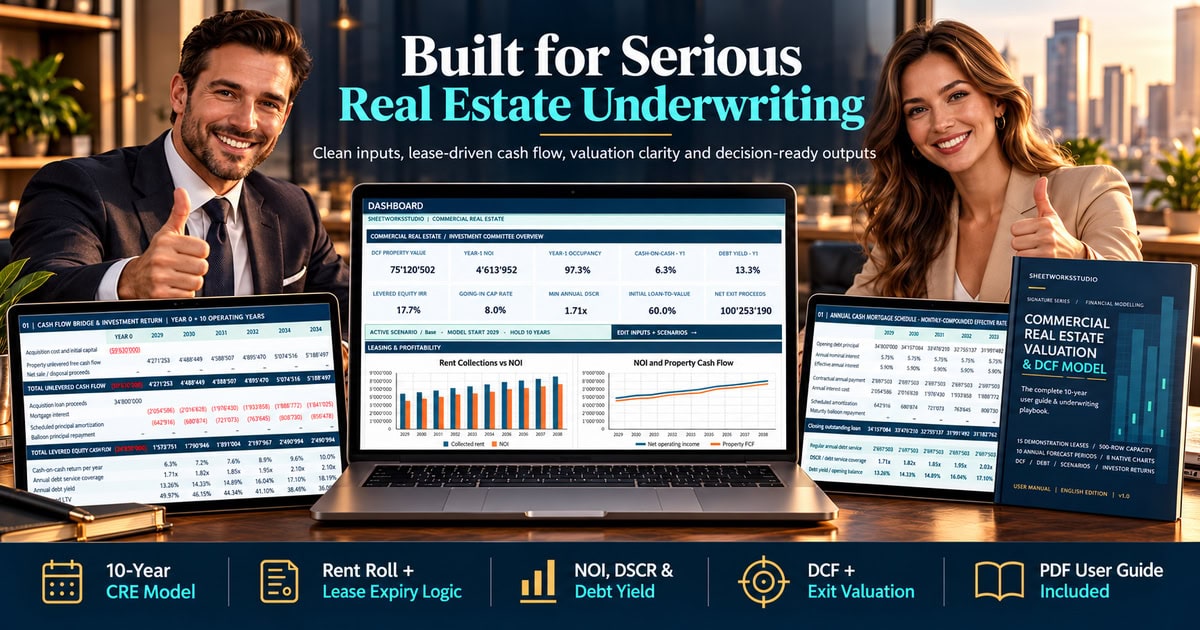
10-Year SIGNATURE Edition | Rent Roll | NOI | Mortgage Financing | Investment Returns
Underwrite commercial investment properties with a structured, fully editable Excel financial model connecting tenant-level leases, operating cash flow, mortgage financing and discounted property valuation.
The Commercial Real Estate Valuation & DCF Model – SIGNATURE Edition by SheetworksStudio is a professional commercial property investment analysis system designed for real estate investors, acquisition analysts, asset managers, lenders, investment consultants and property owners.
Rather than relying on a single rental growth assumption, the model incorporates individual tenant agreements, contractual lease expiry dates, expected renewals, reletting assumptions and market rents into a comprehensive 10-year annual property forecast.
The workbook includes 15 integrated worksheets, 500 prepared lease records, 8 dynamic dashboard charts, 4 sensitivity matrices, 3 underwriting scenarios and a professional 21-page PDF guide.
📊 EXECUTIVE DASHBOARD & INVESTMENT PERFORMANCE
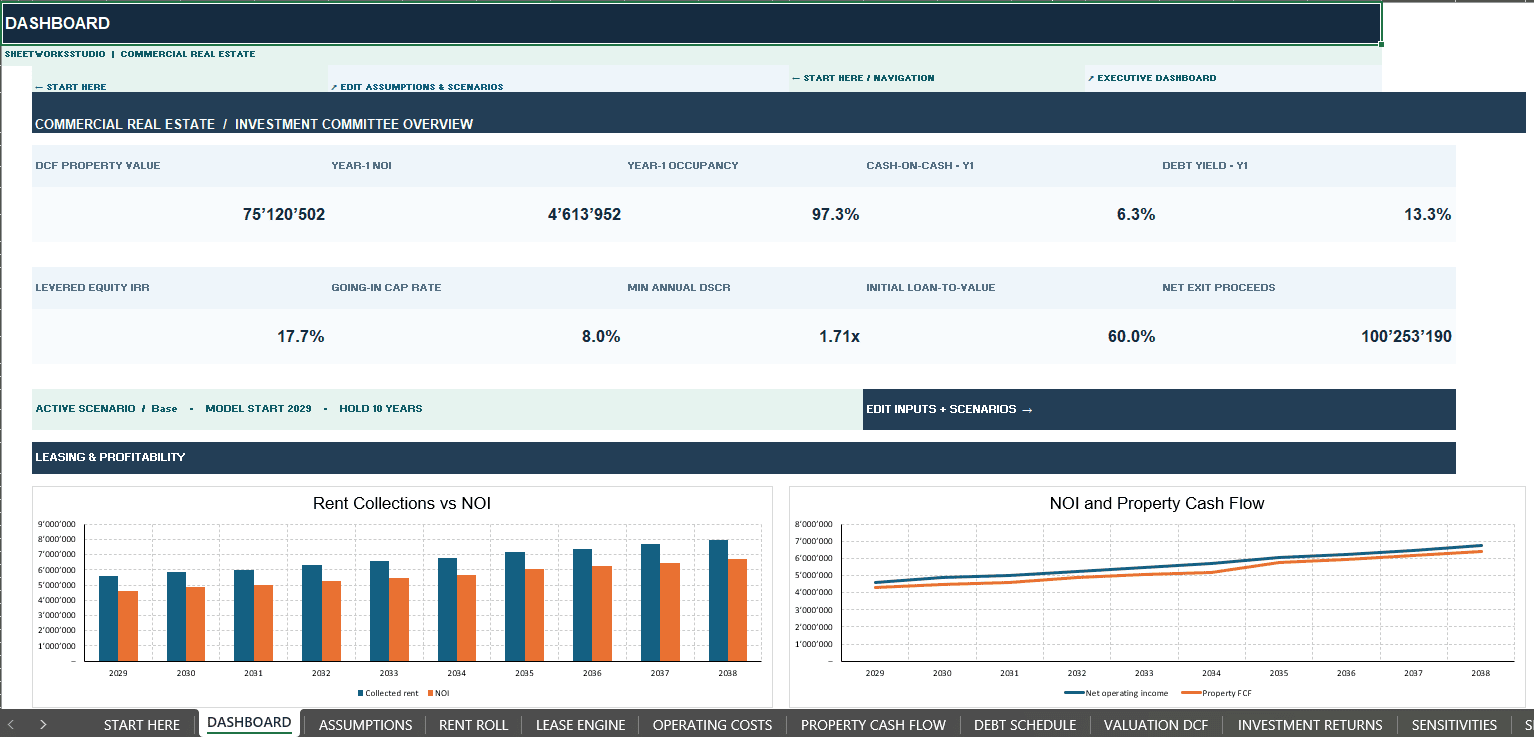
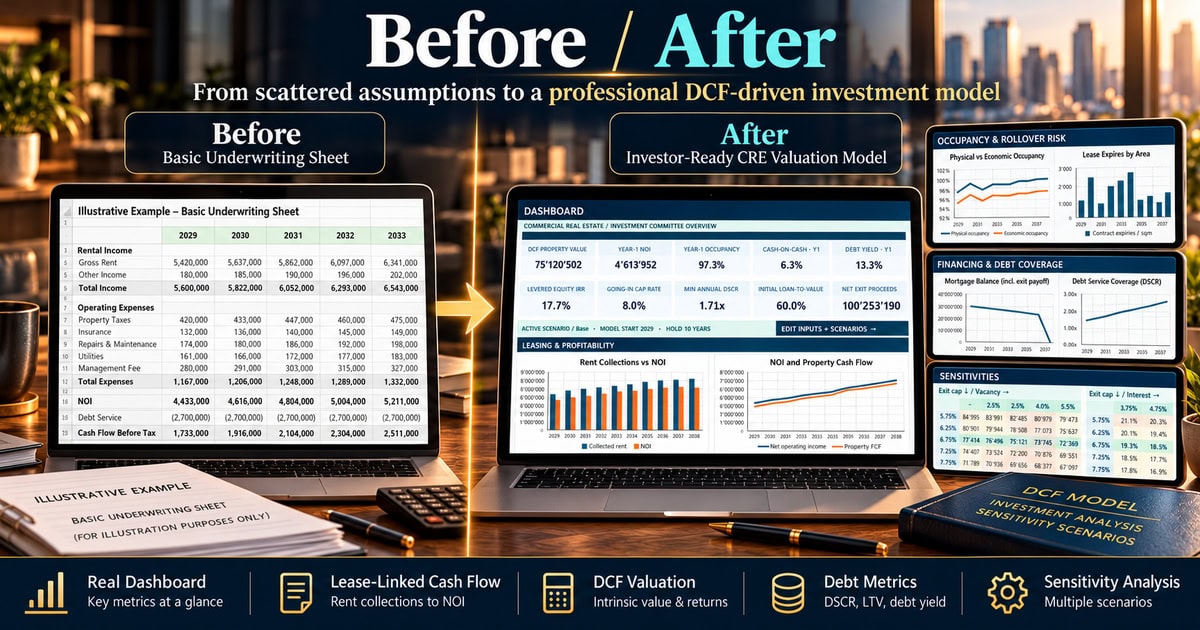
Review essential commercial property performance indicators through a professionally designed Executive Dashboard.
Key investment metrics include:
- DCF Property Value
- Year-1 Net Operating Income (NOI)
- Physical Occupancy
- Cash-on-Cash Return
- Debt Yield
- Levered Equity IRR
- Going-In Capitalization Rate
- Minimum Debt Service Coverage Ratio (DSCR)
- Initial Loan-to-Value Ratio (LTV)
- Net Exit Proceeds
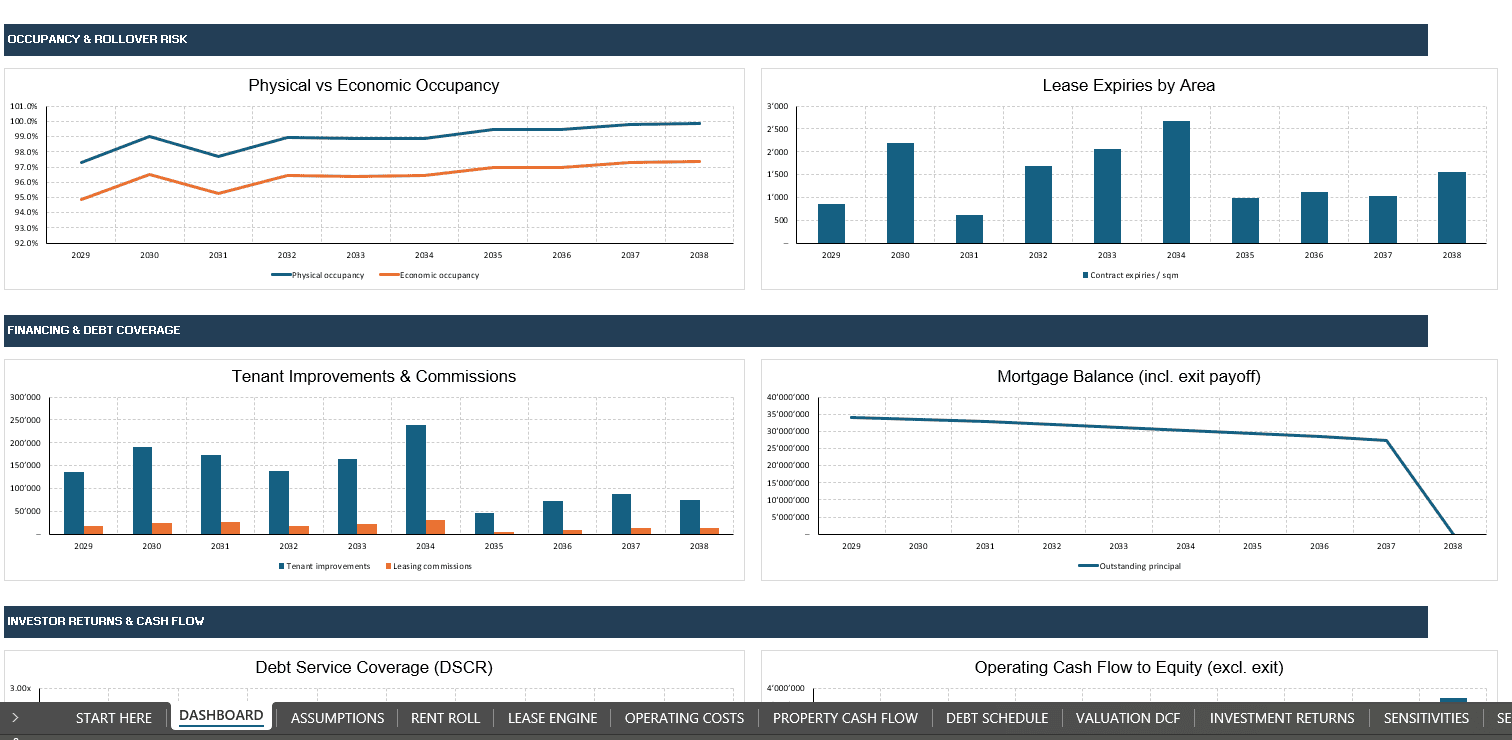
Eight native Excel charts visualize:
- Rental Collections versus NOI
- NOI and Property Cash Flow
- Physical versus Economic Occupancy
- Lease Expiries by Area
- Tenant Improvements and Leasing Commissions
- Mortgage Debt Balance
- Debt Service Coverage Ratio
- Operating Cash Flow to Equity
Dashboard outputs are linked to the underlying financial model and update when assumptions and scenarios change.
🏢 500-ROW RENT ROLL & TENANT-LEVEL UNDERWRITING
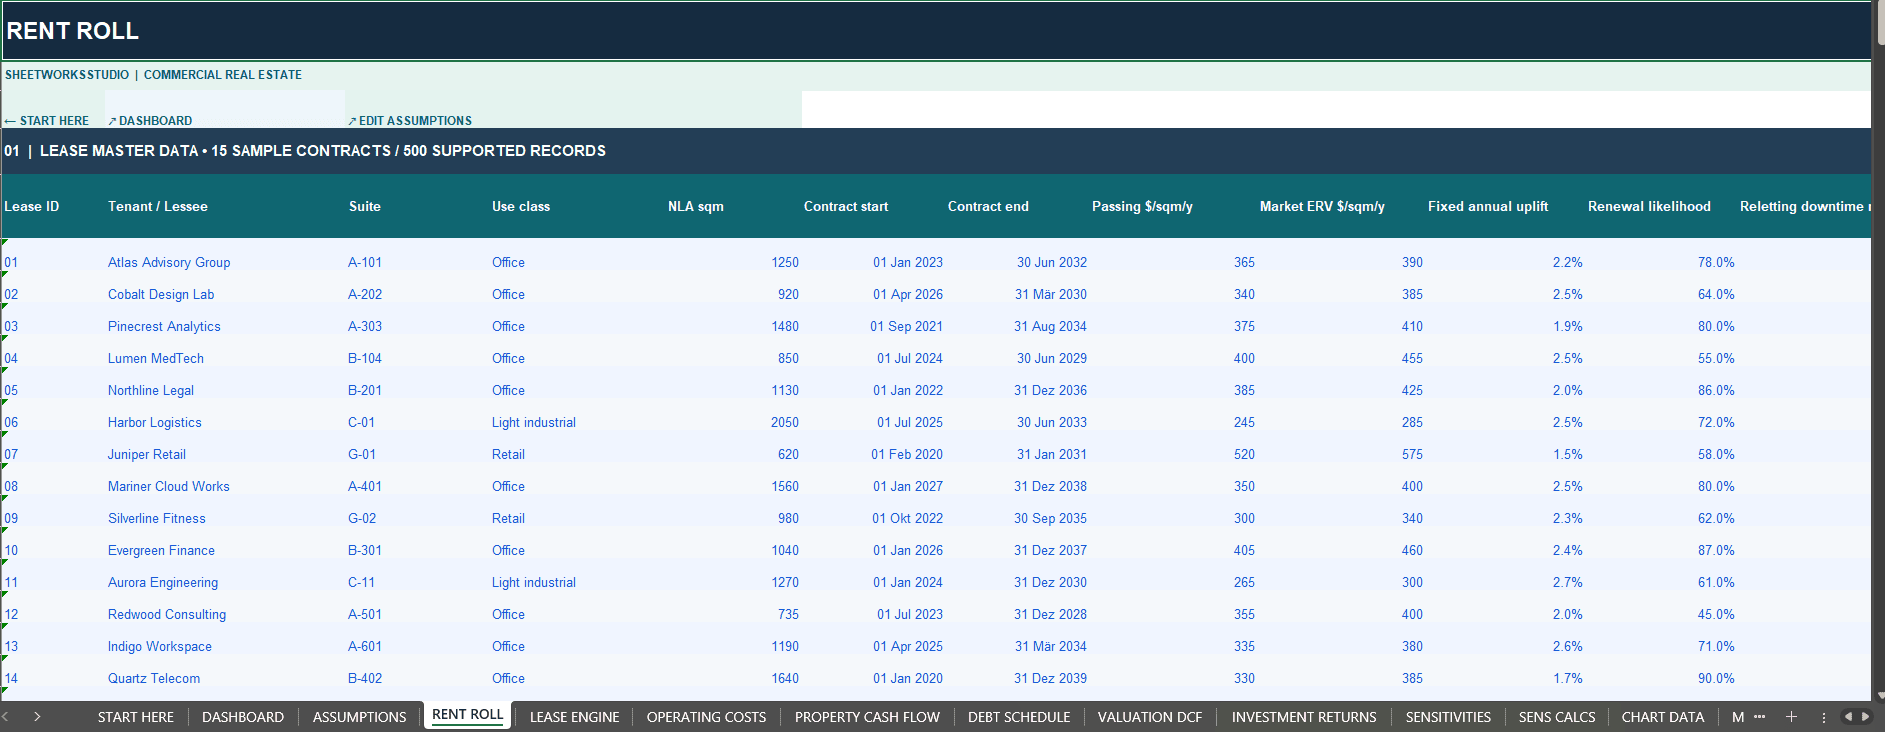
The RENT ROLL worksheet supports up to 500 individual tenant and lease records.
Fifteen fictional commercial lease agreements are included to demonstrate the workbook’s functionality.
Users can configure:
- Tenant and Lease Identification
- Property Use Classification
- Unit References
- Net Lettable Area
- Lease Commencement and Expiry Dates
- Contractual Passing Rent
- Estimated Rental Value (ERV)
- Annual Contractual Rent Increases
- Renewal Probabilities
- Reletting Downtime
- Rent-Free Periods
- Tenant Improvements
- Leasing Commission Assumptions
Unlike a simplified rental income calculator, this approach connects individual lease terms to the property’s projected occupancy, rental income and cash flow.
Lease Expiry & Rollover Engine
The integrated LEASE ENGINE evaluates the expected consequences of lease expirations and future leasing activity.
The model applies probability-weighted assumptions for tenant renewals, expected reletting, market rental values, downtime and related leasing expenditures.
Review how tenancy changes influence expected rental receipts, physical and economic occupancy, tenant improvement spending, leasing commissions and property cash flow.
Model convention: Lease rollover is calculated using annual expected-value assumptions. It is not a monthly stochastic lease simulation.
💰 OPERATING EXPENSES, NOI & PROPERTY CASH FLOW
Evaluate the relationship between property income, operating costs and investment cash generation.
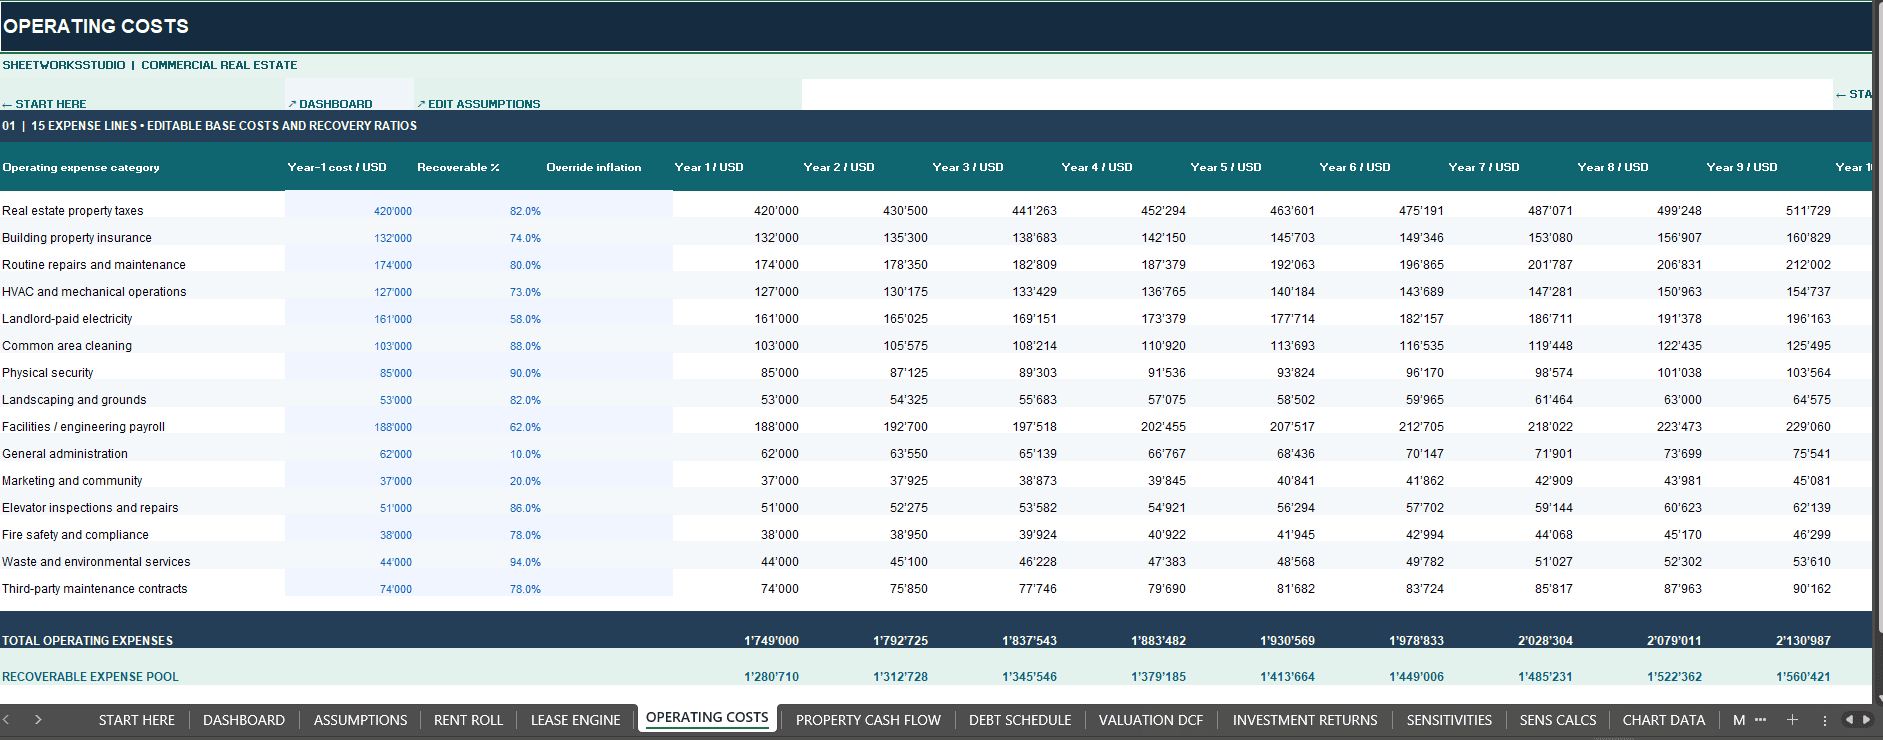
The model includes 15 configurable operating expense categories, covering property taxes, insurance, maintenance, utilities, security, administration and other property operating costs.
Expense assumptions can be adjusted for category-specific inflation and tenant recoverability.
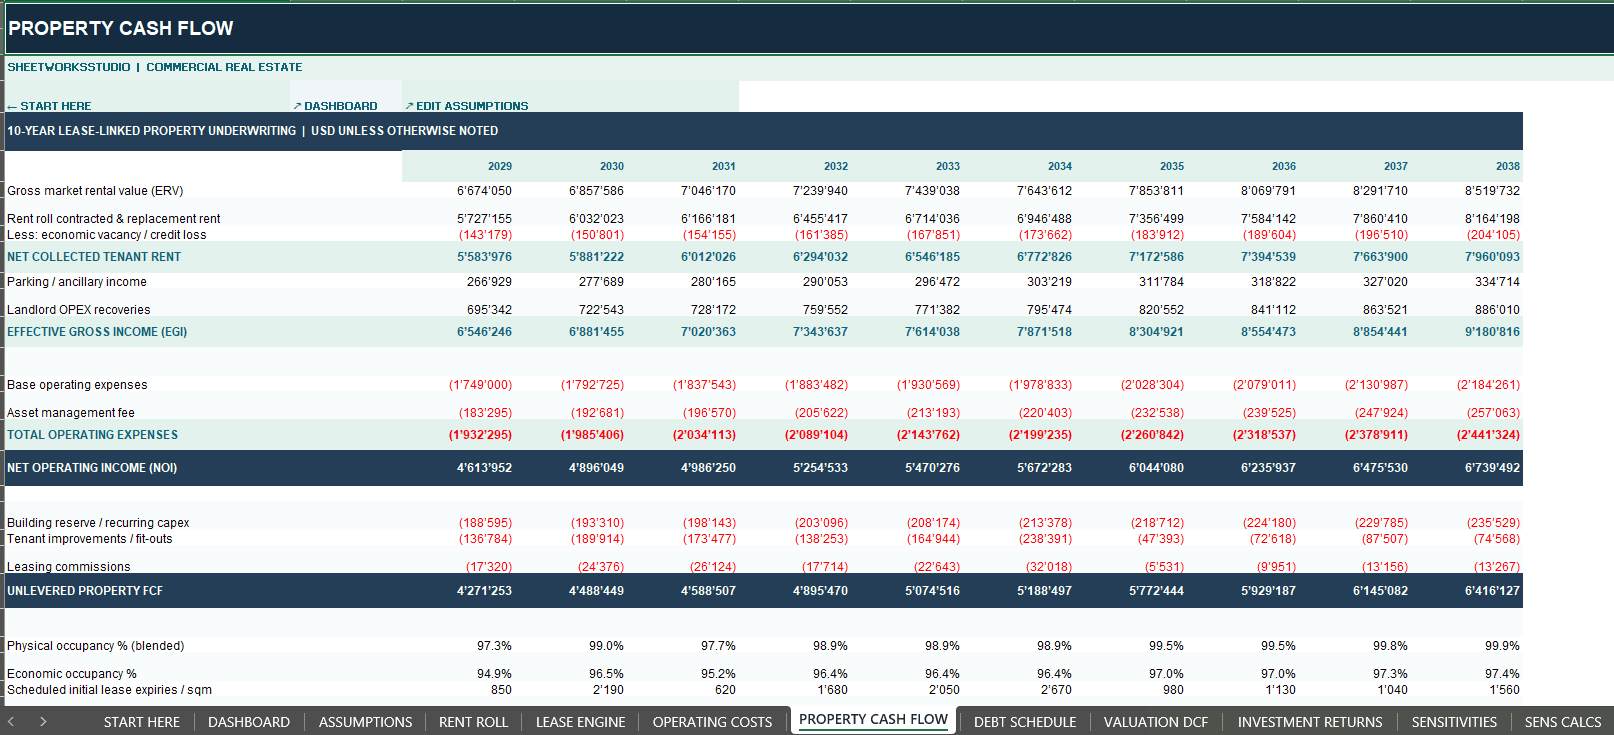
The PROPERTY CASH FLOW module calculates:
- Gross Market Rental Value
- Expected Tenant Rental Income
- Vacancy and Collection Losses
- Ancillary Property Income
- Operating Expense Recoveries
- Effective Gross Income (EGI)
- Operating Expenses
- Net Operating Income (NOI)
- Recurring Capital Reserves
- Tenant Improvements
- Leasing Commissions
- Unlevered Property Free Cash Flow
These calculations provide a transparent financial bridge from tenant-level income assumptions to investment cash flows.
🏦 MORTGAGE FINANCING, LOAN AMORTIZATION & DSCR
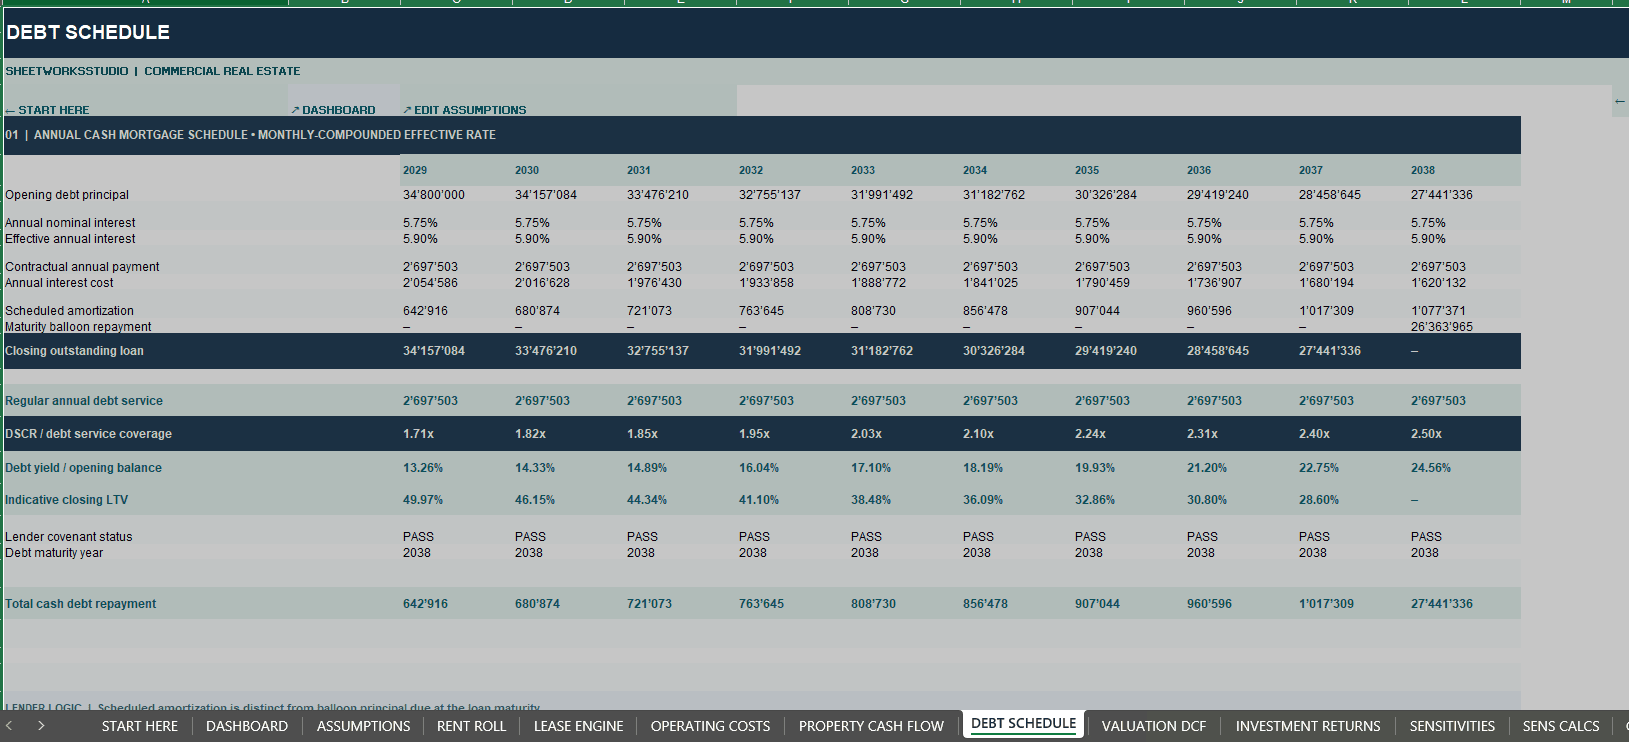
The DEBT SCHEDULE connects acquisition assumptions with annual financing and investor cash flows.
Financing functionality includes:
- Acquisition Loan Amount
- Initial Loan-to-Value Ratio (LTV)
- Interest Rate Assumptions
- Effective Annual Interest
- Scheduled Principal Amortization
- Mortgage Maturity
- Balloon Repayment
- Opening and Closing Debt Balances
- Annual Debt Service
- Debt Service Coverage Ratio (DSCR)
- Debt Yield
- Indicative LTV Monitoring
- Selected Lending Covenant Indicators
The model applies a simplified fixed-payment mortgage structure with annual cash flow reporting.
Debt financing outputs are linked directly to the investment-return calculations.
📈 10-YEAR DCF VALUATION & INVESTOR RETURNS
Discounted Cash Flow Valuation
Estimate an indicative property value using the discounted cash flow methodology.
The model calculates the present value of projected annual unlevered property cash flows and the estimated terminal disposal proceeds.
The valuation framework incorporates:
- Annual Unlevered Free Cash Flow
- Discount Rate
- Forward Stabilized Exit NOI
- Exit Capitalization Rate
- Gross Terminal Property Value
- Disposal Costs
- Net Terminal Sale Proceeds
- Indicative DCF Property Value
- Property Value per Square Meter
- Going-In Capitalization Rate
- Premium or Discount to Acquisition Price
The model distinguishes the actual assumed acquisition price from the calculated DCF valuation.
Levered & Unlevered Investment Returns
Evaluate the investment before and after mortgage financing.
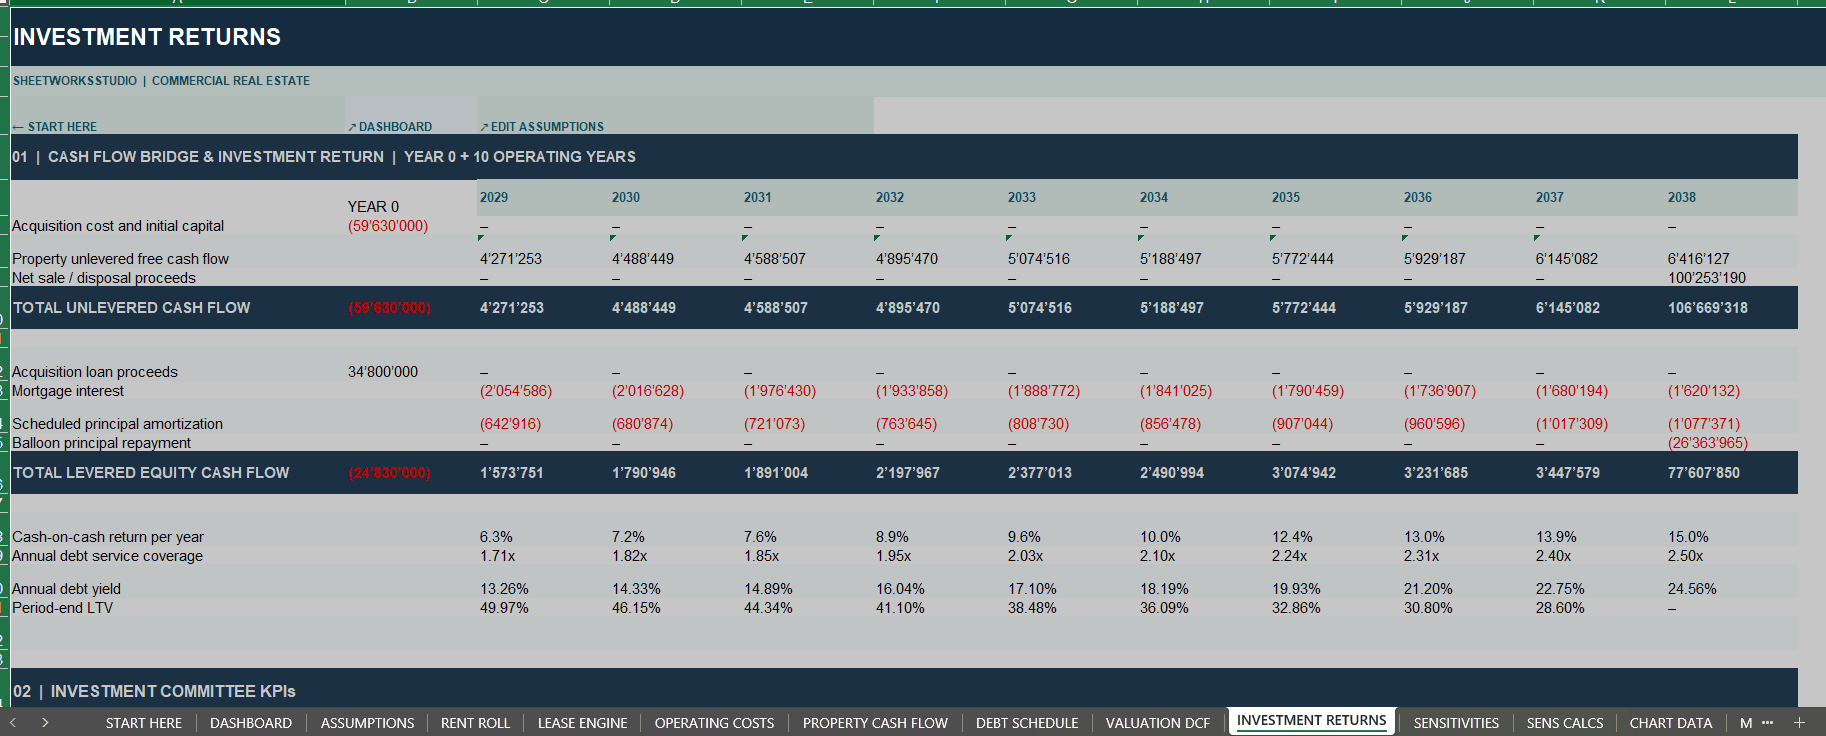
The INVESTMENT RETURNS worksheet includes:
- Initial Acquisition Cash Flows
- Annual Property Investment Cash Flows
- Unlevered Project IRR
- Levered Equity IRR
- Equity Investment Multiples
- Cash-on-Cash Returns
- Investor Equity Contributions
- Annual Debt Service
- Investor Proceeds at Exit
Financial returns are calculated on a before-income-tax basis, using the modeled operating, financing and exit assumptions.
🔄 THREE SCENARIOS & FOUR SENSITIVITY MATRICES
Compare alternative commercial property market conditions.
BASE CASE
Central assumptions for contractual rent, vacancy, operating costs, financing and terminal capitalization rates.
UPSIDE CASE
More favorable leasing, rental income, expense and valuation assumptions.
DOWNSIDE CASE
More conservative assumptions incorporating weaker rental performance, higher operating expenses, financing pressure or lower exit valuation.
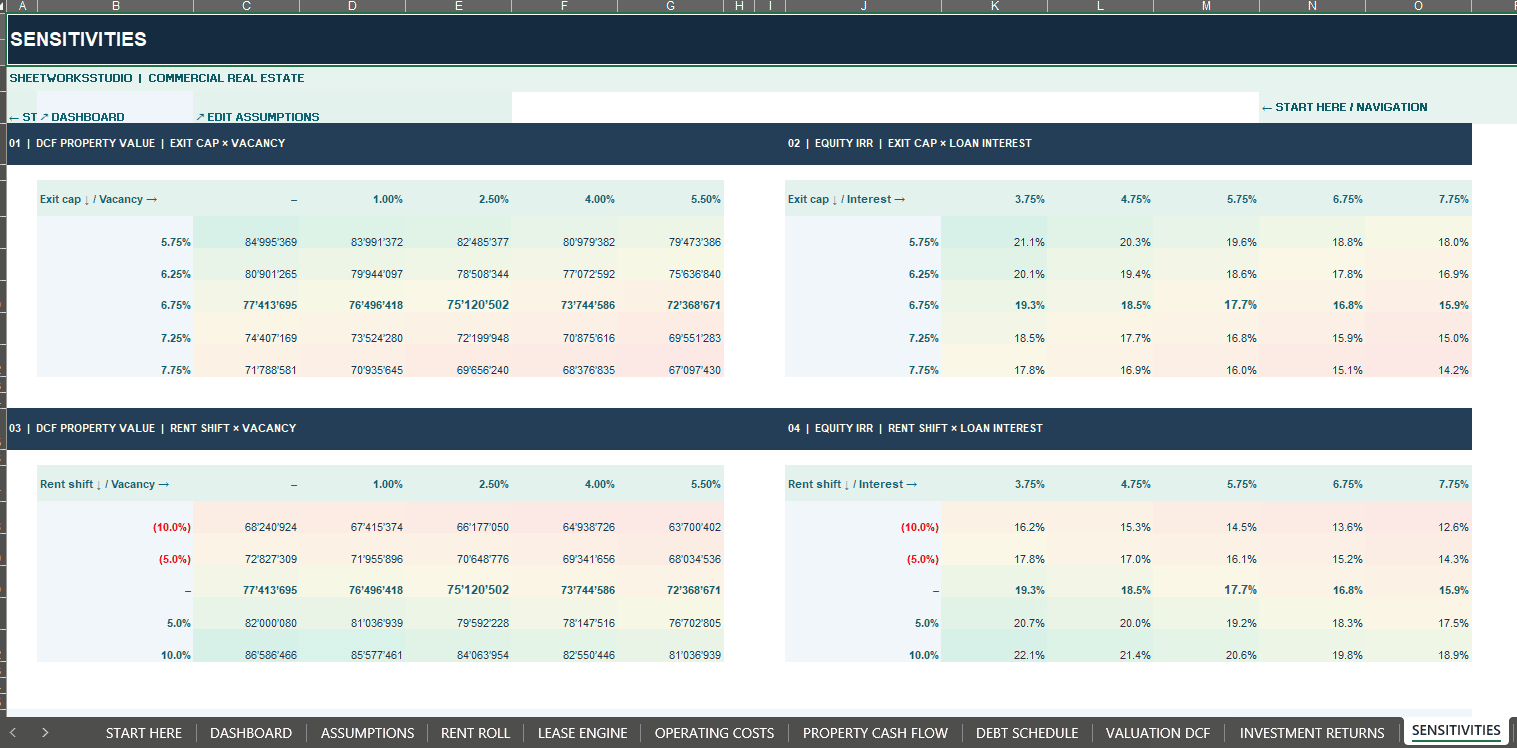
The workbook also provides four formula-driven sensitivity matrices:
1. DCF Property Value – Exit Cap Rate × Vacancy
Understand how terminal capitalization rates and vacancy assumptions influence indicative property valuation.
2. Equity IRR – Exit Cap Rate × Loan Interest
Evaluate the combined effects of exit valuation and financing interest rates on equity returns.
3. DCF Property Value – Rent Shift × Vacancy
Explore changes in property value resulting from rental pricing and expected vacancy.
4. Equity IRR – Rent Shift × Loan Interest
Examine the relationship between rental economics, financing costs and levered investor performance.
Scenario selection and the central underwriting assumptions feed into the integrated financial calculations.
⚙️ PROFESSIONAL WORKBOOK STRUCTURE
The Excel financial model contains 15 organized worksheets:
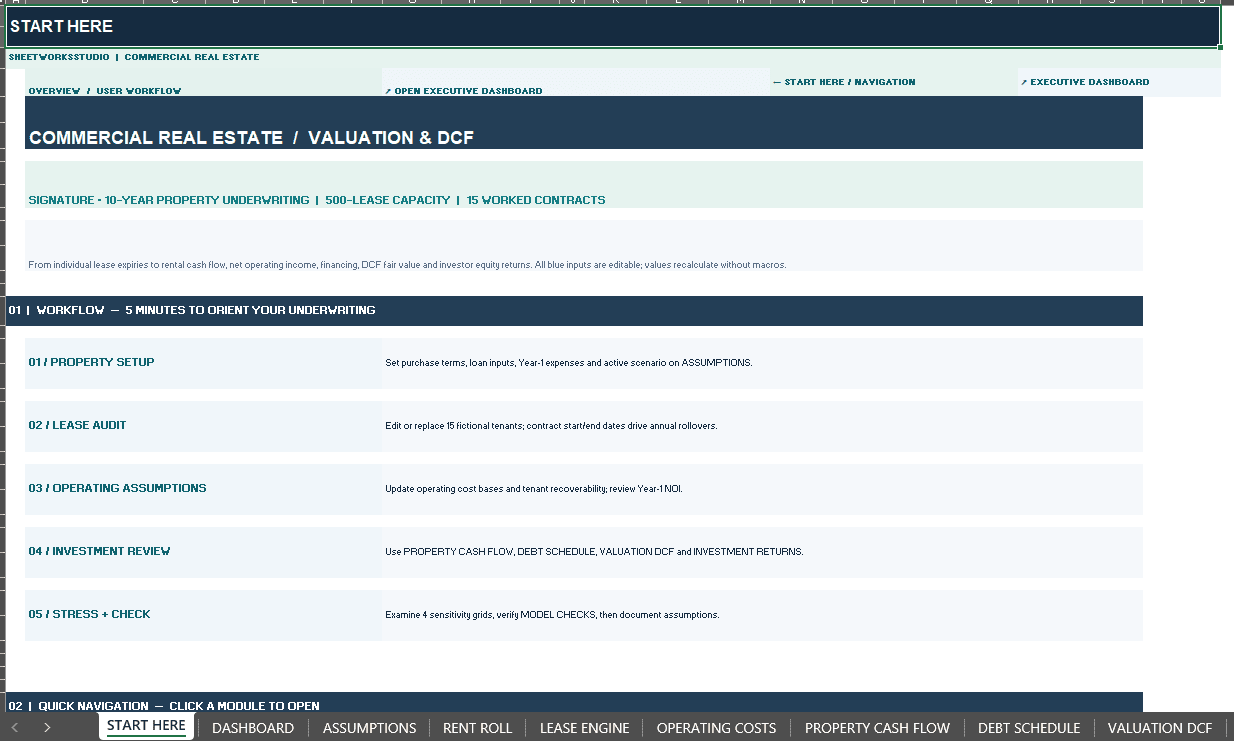
- START HERE – Overview and workbook navigation
- DASHBOARD – Executive KPIs and eight charts
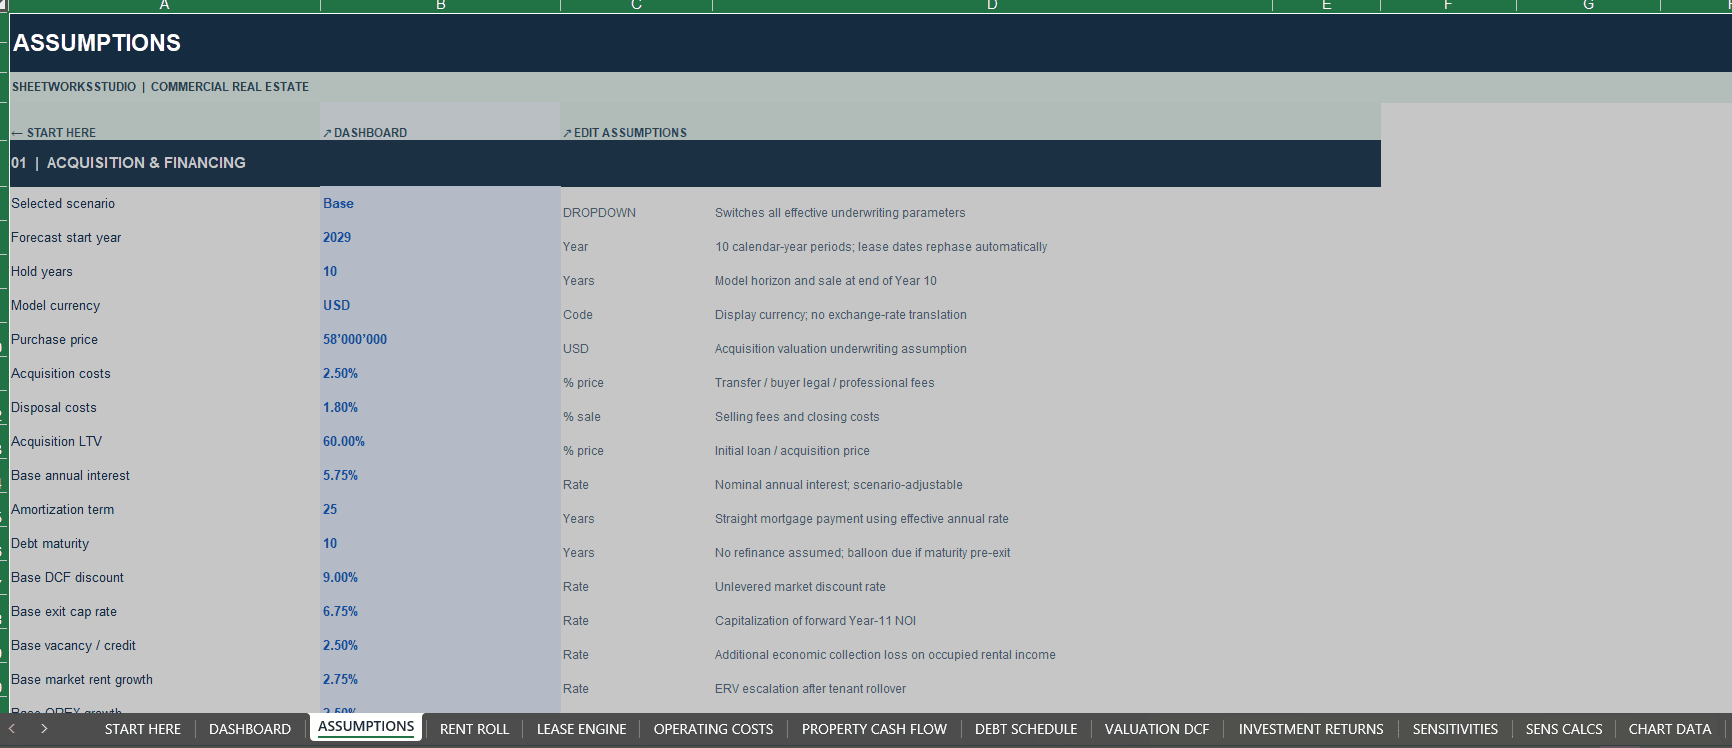
- ASSUMPTIONS – Acquisition, financing and scenario inputs
- RENT ROLL – Tenant and lease database
- LEASE ENGINE – Expiry, renewal and rollover calculations
- OPERATING COSTS – Property operating expenses
- PROPERTY CASH FLOW – NOI and unlevered cash flow
- DEBT SCHEDULE – Mortgage financing and amortization
- VALUATION DCF – Discounted cash flow property valuation
- INVESTMENT RETURNS – Levered and unlevered returns
- SENSITIVITIES – Four investment sensitivity matrices
- SENS CALCS – Supporting sensitivity calculations
- CHART DATA – Dashboard data sources
- MODEL CHECKS – Model reconciliation and validation
- USER GUIDE – In-workbook instructions
Built-In Quality Controls
The MODEL CHECKS worksheet provides 22 model integrity and financing indicators, including selected checks for lease-data completeness, occupancy, income calculations, debt balances, financial reconciliations and terminal valuation.
The workbook features clearly distinguished input cells, formula-driven outputs and internal navigation.
No macros, external data connections or paid integrations are required.
📦 WHAT YOU RECEIVE
1. Premium Commercial Real Estate Valuation & DCF Model (.xlsx)
- 15 Integrated Worksheets
- 10 Annual Forecast Periods
- 500 Prepared Lease Records
- 15 Fictional Sample Leases
- 15 Operating Expense Categories
- Eight Native Dashboard Charts
- Three Underwriting Scenarios
- Four Sensitivity Matrices
- Tenant-Level Lease Rollover Analysis
- Net Operating Income and Property Cash Flow
- Mortgage Financing and Debt Service
- DCF Valuation and Terminal Exit Analysis
- Levered and Unlevered IRR
- Cash-on-Cash Returns and DSCR
- Twenty-Two Model Checks
- Editable Assumptions and Visible Formulas
2. Professional How-to-Use Guide – 21-Page PDF
A detailed English-language user guide explaining workbook setup, navigation, rent roll assumptions, lease expiries, operating expenses, property cash flow, mortgage amortization, DCF valuation, financial returns, sensitivity analysis, model checks and troubleshooting.
3. Illustrative Sample Data
The workbook includes fictional lease agreements and financial assumptions to demonstrate the complete underwriting workflow.
IDEAL FOR
- Commercial Real Estate Investors
- Property Owners and Acquisition Teams
- Real Estate Asset Managers
- Commercial Lending and Credit Analysts
- Investment Committees
- Property Investment Consultants
- Real Estate Financial Analysts
- Family Offices Evaluating Individual Properties
- Financial Modeling Professionals
Suitable for underwriting selected office, retail, light-industrial and other income-producing commercial properties.
HOW TO GET STARTED
Step 1 – Configure the Investment
Open START HERE and ASSUMPTIONS. Enter the acquisition price, forecast year, financing terms and selected scenario.
Step 2 – Enter Tenant Agreements
Replace the fictional RENT ROLL entries with actual property-specific lease information.
Step 3 – Customize Operating Expenses
Review expense categories, inflation and recoverable operating costs.
Step 4 – Review Property Performance
Analyze the LEASE ENGINE and PROPERTY CASH FLOW worksheets to understand future rental income, occupancy, NOI and capital requirements.
Step 5 – Evaluate Debt and Returns
Review DEBT SCHEDULE, VALUATION DCF and INVESTMENT RETURNS.
Step 6 – Compare Investment Conditions
Use SENSITIVITIES to understand the effect of alternative cap rates, rents, vacancy and interest rates.
Step 7 – Validate the Model
Review MODEL CHECKS and investigate any issues before relying on the outputs.
TECHNICAL SPECIFICATIONS
- File Format: Microsoft Excel (.xlsx)
- Forecast Horizon: 10 Years
- Forecast Frequency: Annual
- Illustrative Forecast: 2029–2038
- Excel Worksheets: 15
- Formula Cells: Approximately 26,231
- Dashboard Charts: 8
- Prepared Lease Rows: 500
- Example Leases: 15
- Underwriting Scenarios: Base, Upside, Downside
- Sensitivity Matrices: 4
- Model Checks: 22
- Area Measurement: Square Meters
- Currency Label: USD by Default
- Macros: None
- External Data Feeds: None
- PDF User Guide: 21 Pages
Microsoft Excel Desktop is recommended.
Google Sheets import and functional compatibility have not been independently verified. Equivalent formulas, charts, dropdowns, navigation and formatting are therefore not guaranteed.
IMPORTANT MODEL LIMITATIONS & DISCLAIMER
This workbook is an illustrative commercial real estate underwriting and valuation model, not a certified property appraisal, statutory accounting system, development financial model or multi-property portfolio consolidation platform.
The model uses annual financial periods, simplified probability-weighted lease renewals, expected reletting assumptions and before-income-tax investment returns.
The workbook does not include detailed monthly rent collection accounting, jurisdiction-specific property taxation, complex loan refinancing arrangements or complete stochastic tenant default modeling.
All sample tenants, property assumptions, financial values and investment results are fictional and provided for demonstration purposes.
Users are responsible for independently reviewing lease documents, market rental evidence, operating expenses, financing conditions, discount rates and financial calculations before making investment decisions.
Passing the model’s built-in checks does not guarantee commercial feasibility, lender approval, investment profitability or the accuracy of user-entered assumptions.
This product does not constitute investment, financial, accounting, tax, legal, real estate appraisal or professional business advice.
No physical product will be shipped.
Developed by SheetworksStudio – Professional Financial Models & Investment Decision Tools.
Similar ProductsOther customers were also interested in...



 eFinancialModels
Electric Vehicle (EV) Charging Station Financial M...
With this comprehensive 5- or 10-year monthly tool, investors can assess the viability of setting up... Read more

Financial Model for Mobile App | Mobile App Busine...
The Mobile App Financial Plan Template in Excel allows you to develop financial projections when lau... Read more

 HenrySheykin
Food Truck Financial Model Excel Template
The Food Truck Financial Model helps entrepreneurs, founders, business owners, consultants, and anal... Read more

Green Hydrogen Production from Wind Energy Financi...
The Green Hydrogen from Wind Financial Model aims to comprehensively forecast a horizon of 40 years ... Read more

Simple Mutual Non-Disclosure Agreement Template
Protect your business secrets with ease using our Simple Mutual Non-Disclosure Agreement Template. S... Read more

Solar Energy Financial Model
The Solar Energy Financial Model Spreadsheet Template in Excel assists you in preparing a sophistica... Read more

 Peter Graf
The Customer-Centric Financial Model for Restauran...
Starting a restaurant without a financial plan is like driving a car blindfolded. You wouldn´t do i... Read more
You must log in to submit a review.