
0 ITEMS

DTC Brand Finances: Capital, CAC, and Cash Flow
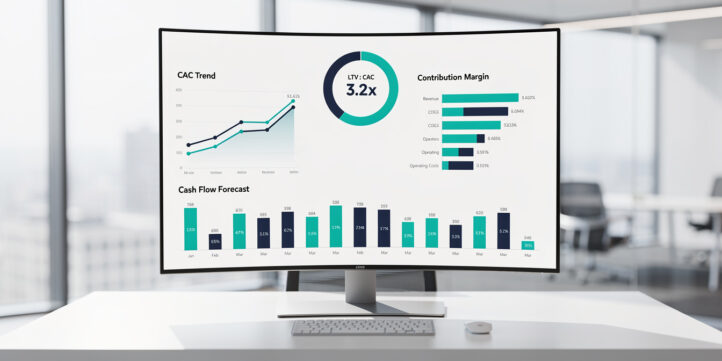
Most DTC brands don’t fail because the product is bad. They fail because the founder runs out of cash before unit economics turn positive.
Key Takeaways
- Starting a DTC brand realistically requires $50,000 to $250,000 in total capital, depending on product category and growth ambition.
- Customer acquisition cost (CAC) in paid social has risen 60-70% since iOS 14.5 launched in April 2021, making pre-launch financial modeling non-negotiable.
- A healthy DTC business targets a lifetime value to CAC ratio (LTV:CAC) of at least 3:1 before scaling ad spend.
- Apparel brands should model 8-15% returns and refunds into every contribution margin calculation; CPG brands typically see 5-8%.
- Bootstrapped DTC brands need at least 12-18 months of cash runway before reaching positive operating cash flow.
- The cash conversion cycle in DTC often runs 60-90 days negative, meaning you pay suppliers long before customers pay you.
- Revenue-based financing (RBF) has emerged as a DTC-native funding option, typically advancing 1-3 months of revenue at a factor rate of 1.06-1.12.
Understanding True DTC Startup Costs: Beyond the Shopify Subscription
Launching a DTC brand costs far more than most founders budget. The Shopify subscription is the smallest line item.
Here’s a realistic capital breakdown for two common scenarios: a low-ticket consumable (average order value under $50) and a premium product (AOV above $120).
| Cost Category | Low-Ticket DTC | Premium DTC | % of Total Budget |
|---|---|---|---|
| Inventory (first run) | $15,000-$30,000 | $40,000-$80,000 | 30-40% |
| Website and tech stack | $3,000-$8,000 | $8,000-$20,000 | 8-12% |
| Paid marketing (launch) | $10,000-$25,000 | $20,000-$50,000 | 20-25% |
| Branding and creative | $5,000-$15,000 | $15,000-$40,000 | 10-15% |
| Operations and logistics | $3,000-$8,000 | $5,000-$15,000 | 5-8% |
| Working capital buffer | $10,000-$20,000 | $20,000-$50,000 | 15-20% |
| Total | $46,000-$106,000 | $108,000-$255,000 | 100% |
Inventory is almost always the largest single cost. Most manufacturers require a minimum order quantity (MOQ), the smallest batch they’ll produce, that forces founders to commit capital months before the first sale. Plan for your first inventory run to represent 30-40% of your total startup budget.
Your tech stack deserves a realistic monthly budget too. A functional early-stage DTC stack, including Shopify ($79-$299/month), an email platform like Klaviyo ($150-$400/month), a returns management tool, and basic analytics, runs $500-$1,500 per month before any paid media.
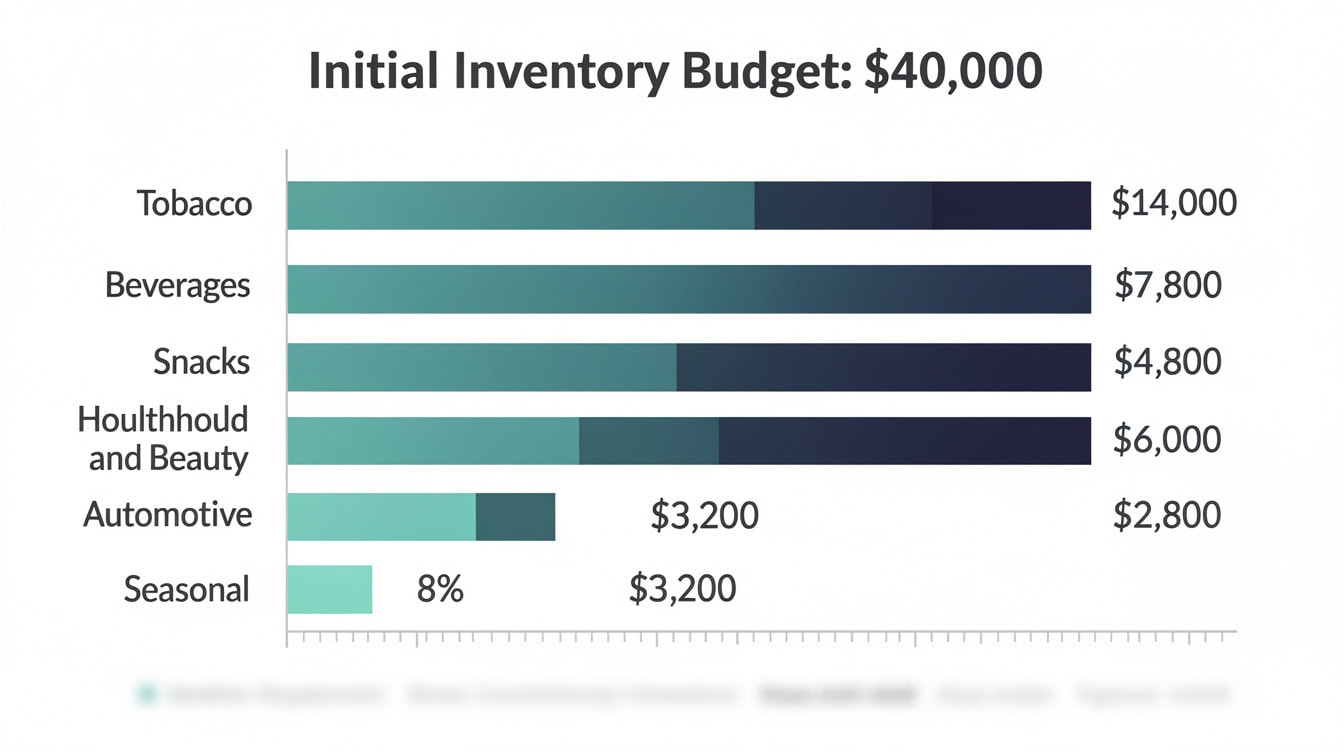
Inventory consistently represents 30-40% of total DTC startup capital, dwarfing the tech stack costs most founders fixate on.
Building Your Pre-Launch Financial Model: The Essential Projections
A pre-launch financial model is your single most important planning document. It forces you to stress-test assumptions before you spend a dollar on inventory.
Your 3-year DTC financial model must include five core components:
- Revenue model: Monthly units sold, driven by traffic assumptions and conversion rate (typically 1.5-3.5% for DTC e-commerce).
- CAC assumptions: What you expect to pay to acquire one customer through each channel, broken out by paid social, search, influencer, and organic.
- LTV model: Projected repeat purchase rate, average order frequency, and gross margin per order over a 12-24 month customer window.
- Contribution margin analysis: Revenue minus COGS, fulfillment, payment processing, and variable marketing costs, expressed per order.
- Cash flow forecast: Month-by-month cash in and out, including inventory purchases timed to your supplier payment terms.
Poor financial planning is among the top reasons early-stage businesses fail to reach profitability.
Build your model before you build your brand.
A complete DTC financial model connects five interdependent projections — missing any one creates blind spots that compound at scale.
DTC Unit Economics 101: CAC, LTV, and Contribution Margin
Unit economics are the financial building blocks that determine whether your DTC brand is a business or an expensive hobby. Get these right and everything else follows.
Customer Acquisition Cost (CAC) is the total marketing and sales spend divided by the number of new customers acquired in a period. If you spend $10,000 on paid social in March and acquire 200 new customers, your blended CAC is $50.
Lifetime Value (LTV) is the total gross profit you expect to earn from a customer over their relationship with your brand. A simple LTV formula: LTV = (Average Order Value x Gross Margin %) x Average Number of Orders.
Contribution Margin per Order is what remains after subtracting all variable costs from revenue. The formula: Contribution Margin = Revenue – COGS – Fulfillment – Payment Processing Fees – Returns Allowance.
Worked Example: Skincare Brand Unit Economics
Assume a skincare brand with these inputs:
- Average Order Value (AOV): $85
- COGS (product cost): $22
- Fulfillment (pick, pack, ship): $9
- Payment processing (2.9% + $0.30): $2.77
- Returns allowance (6% of AOV): $5.10
- Blended CAC: $38
Here’s the math:
Contribution Margin per Order = $85 – $22 – $9 – $2.77 – $5.10 = $46.13
Contribution Margin % = $46.13 / $85 = 54.3%
Now model LTV. If 35% of customers reorder twice more within 12 months:
- First order contribution: $46.13
- Two repeat orders (no CAC): $46.13 x 2 = $92.26
- Weighted LTV = $46.13 + (0.35 x $92.26) = $46.13 + $32.29 = $78.42
LTV:CAC ratio = $78.42 / $38 = 2.06:1
This ratio is below the 3:1 threshold most investors and operators use as a minimum for scaling. The founder needs to either reduce CAC (improve creative efficiency, invest in SEO) or increase LTV (subscription model, bundle upsells, loyalty program) before aggressively scaling ad spend.
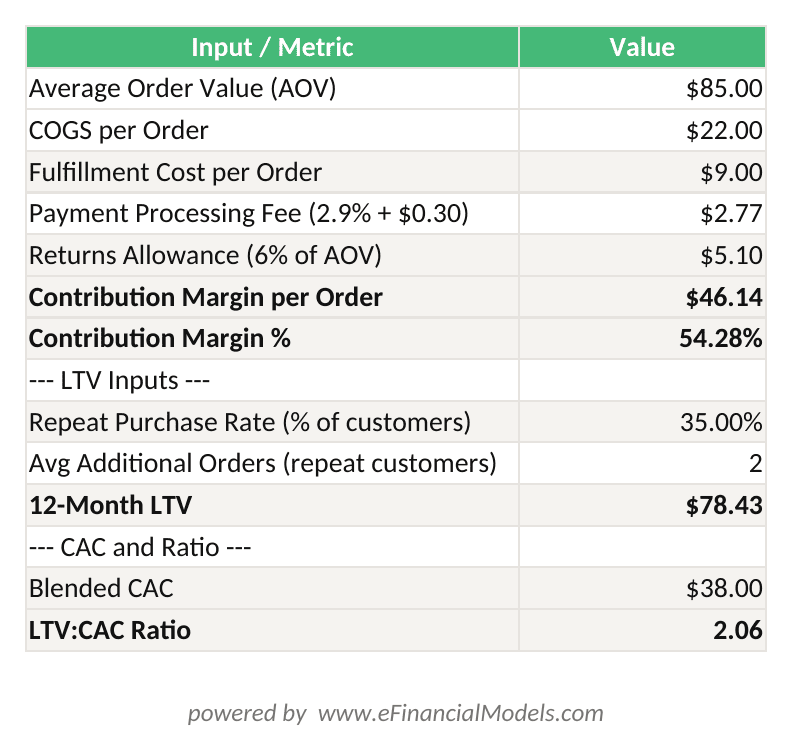
LTV:CAC = 2.06:1 — below the 3:1 threshold, signaling the brand must reduce CAC or increase repeat purchase rate before scaling ad spend.
Post-iOS 14.5, average CAC across DTC categories has increased substantially. Blended CAC for apparel brands on Meta now commonly runs $45-$85 for a first purchase, compared to $25-$45 in 2019.
Model conservatively.
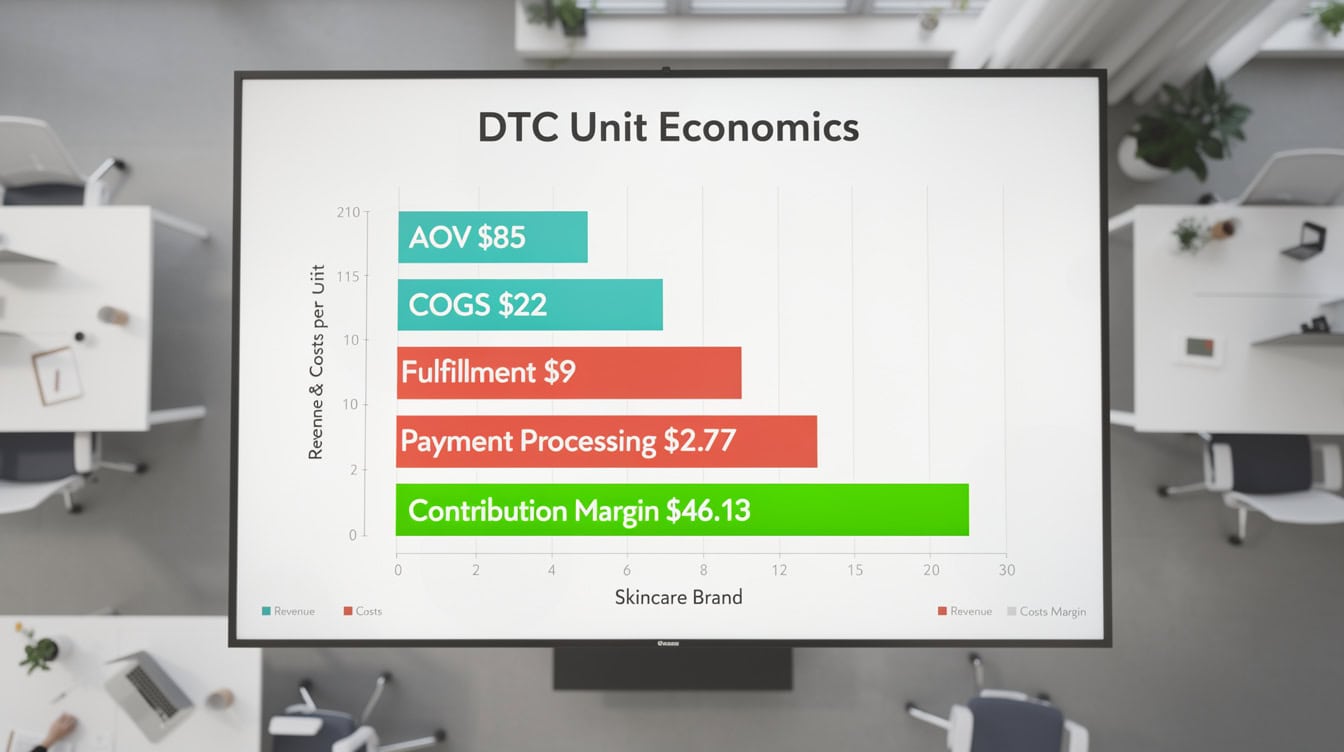
Every dollar of AOV passes through 4 cost deductions before becoming contribution margin — the order matters for pricing decisions.
Funding Your DTC Brand: Choosing the Right Capital Structure
The right funding path depends on your product category, growth rate, and how much equity you’re willing to give up. There’s no universal answer.
| Funding Type | Best For | Typical Terms | Dilution |
|---|---|---|---|
| Bootstrapping | Profitable niche, low CAC | Personal savings | 0% |
| Friends and family | Pre-revenue, trusted network | Convertible note | 5-15% |
| Revenue-based financing | Post-revenue, proven CAC | 1.06-1.12x factor rate | 0% |
| Inventory financing | High-SKU, seasonal brands | 15-25% APR | 0% |
| Angel / seed VC | High-growth, large TAM | $500K-$3M, 15-25% equity | 15-25% |
Revenue-based financing (RBF) deserves special attention for DTC founders. Providers like Clearco and Capchase advance capital against your projected revenue, repaid as a percentage of daily sales (typically 2-8%). There’s no equity dilution and no fixed monthly payment, which suits the lumpy cash flows of a DTC brand. The cost, however, is real: a 1.10x factor rate on a $100,000 advance means you repay $110,000.
Inventory financing, where a lender advances against your purchase orders or existing stock, solves the specific problem of paying suppliers before you’ve sold product. Terms typically run 15-25% APR, which sounds high until you compare it to the cost of a stockout.
Most small business loans require at least 2 years of operating history, which makes traditional bank debt inaccessible for most DTC startups in their first two years.
Source: U.S. Small Business Administration
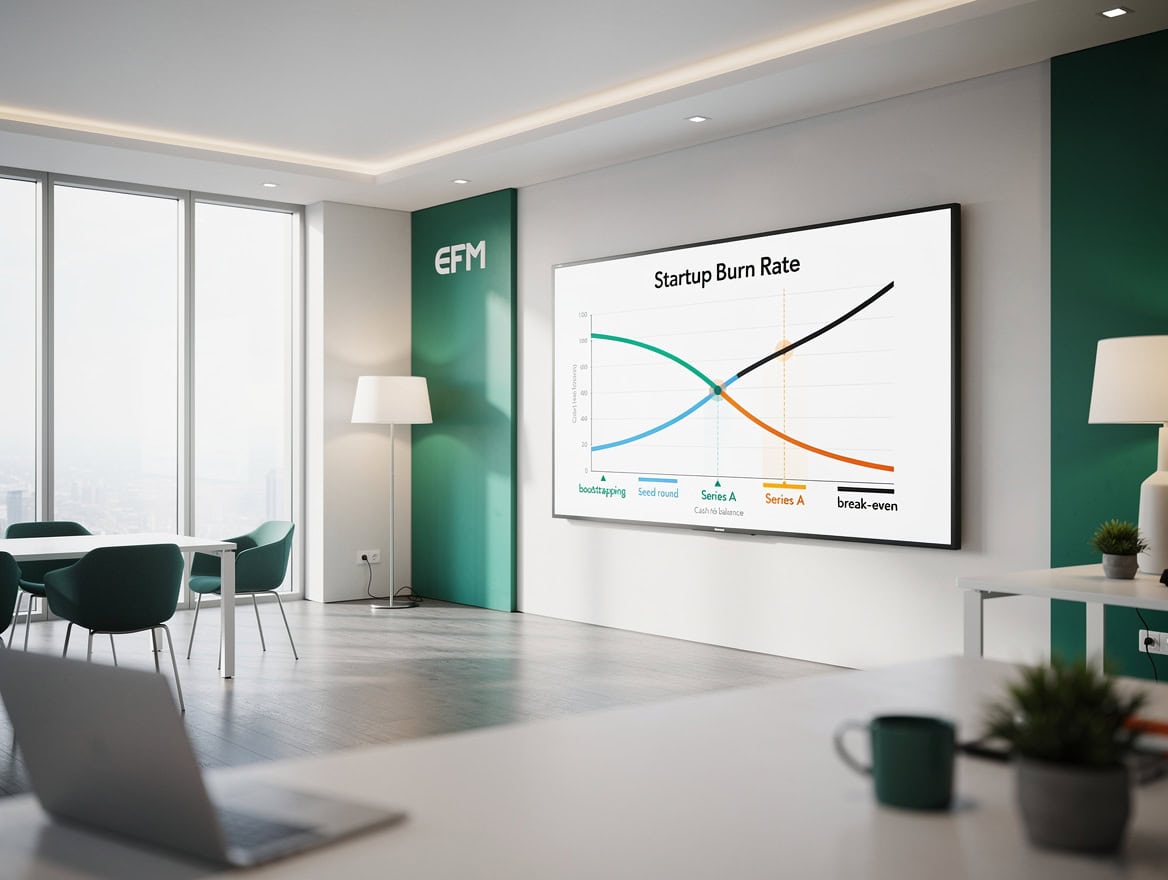
Revenue-based financing offers zero dilution but real cost — a 1.10x factor rate on $100K means repaying $110K regardless of growth.
Cash Flow Management: Navigating the DTC Working Capital Cycle
Cash flow is where DTC brands most often get into trouble, even profitable ones. The core problem is timing.
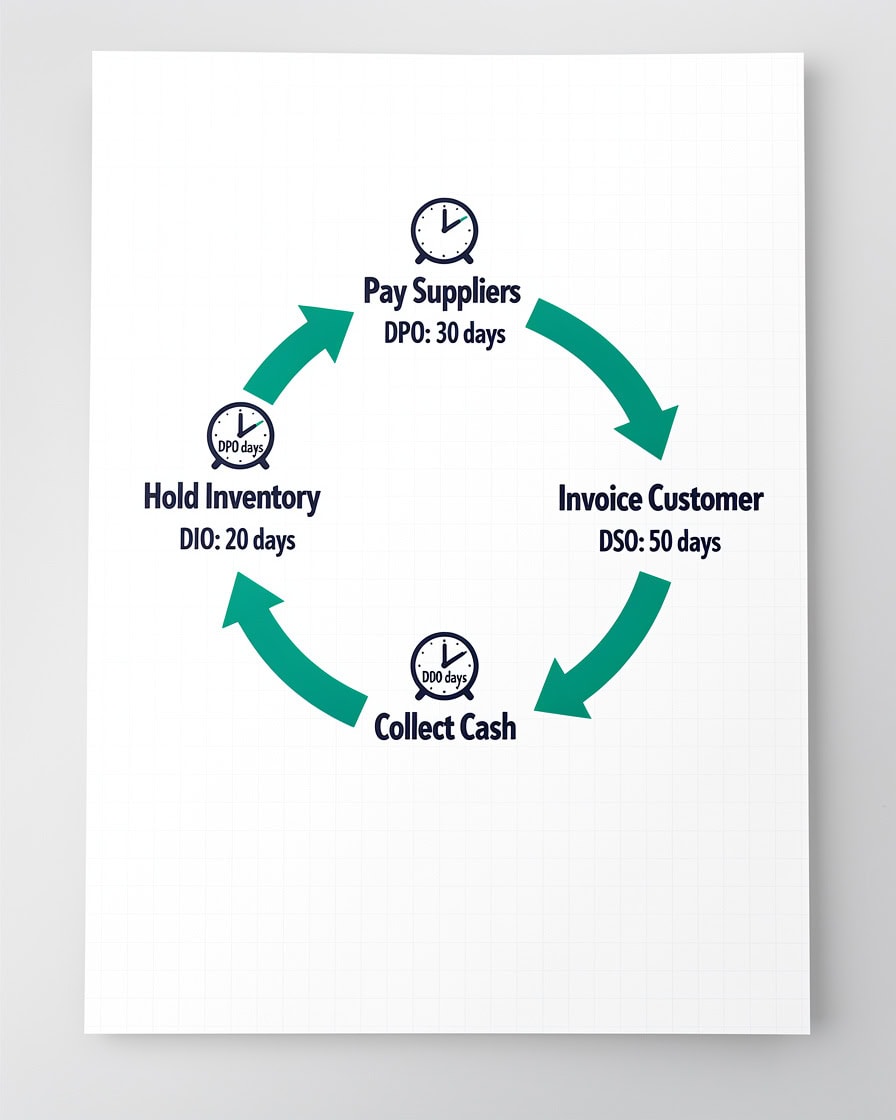
The cash conversion cycle (CCC) measures how long cash is tied up between paying for inventory and collecting from customers. In DTC, this cycle commonly runs 60-90 days negative. You wire payment to your manufacturer in China, wait 45-60 days for production, pay freight, receive goods, then sell and collect payment within 1-3 days of the order. But you’ve already been cash-negative for 2-3 months.
At a $50,000 monthly revenue run rate growing 15% month-over-month, your working capital requirement grows faster than your revenue. A brand growing from $50K to $200K monthly revenue in 12 months may need 2-3x monthly revenue in working capital at peak inventory build.
Three rules for DTC cash flow management:
- Negotiate supplier terms aggressively. Even moving from 100% upfront to 50% deposit / 50% on shipment meaningfully improves your CCC.
- Build a 13-week cash flow forecast. Update it weekly. Know your minimum cash balance 90 days out at all times.
- Treat inventory as cash. Every unit you overstock is cash you can’t use for marketing or operations. Use sell-through rate targets (aim for 80%+ within 90 days of receipt) to discipline your buys.
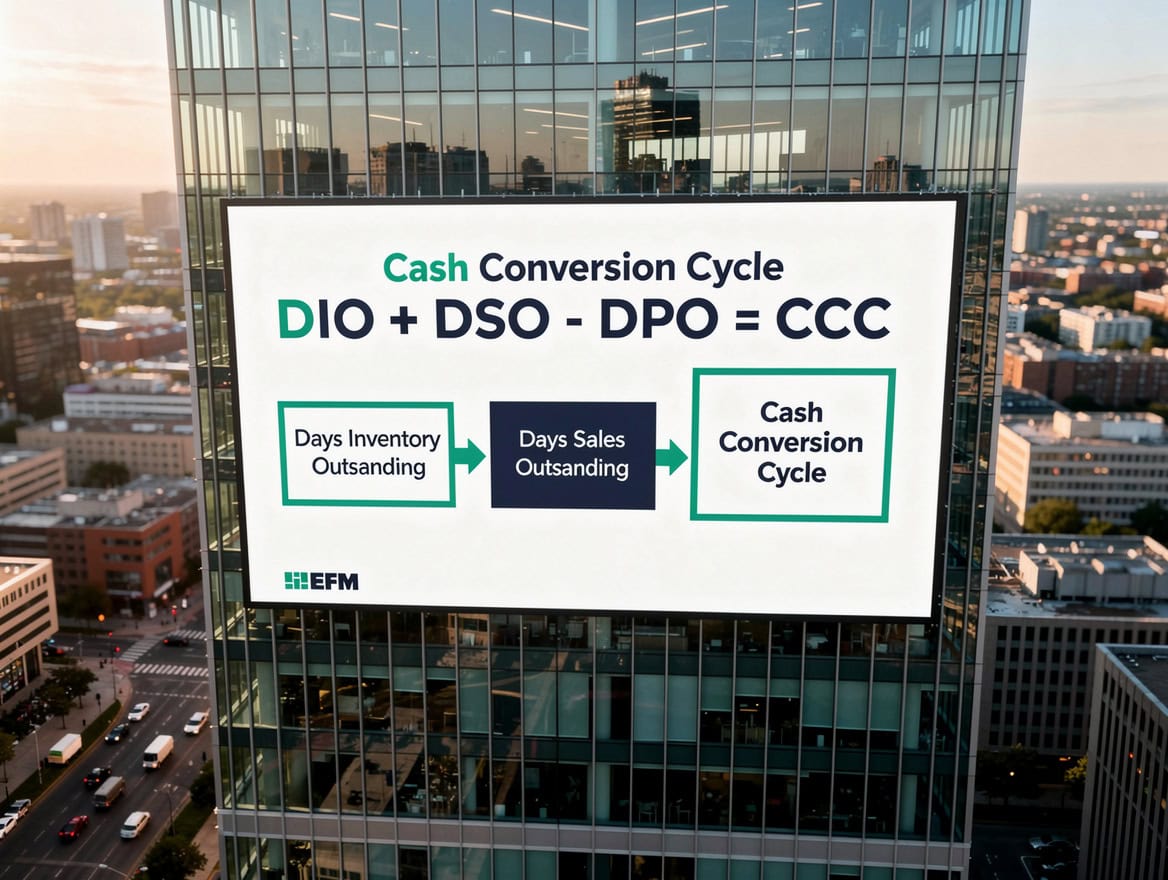
The 90-day cash negative window is the defining financial challenge of DTC — brands growing fast can be profitable on paper and insolvent in practice.
Setting Up Your Financial Infrastructure and Metrics Dashboard
Your financial infrastructure determines how fast you can make decisions. Build it right from day one.
For accounting, use accrual-basis accounting (not cash-basis) from the start. Accrual accounting records revenue when earned and expenses when incurred, giving you an accurate picture of profitability even when cash timing differs. Cash-basis accounting, which records only actual cash movements, will mislead you in a DTC business with inventory.
Your minimum software stack:
- Accounting: QuickBooks Online or Xero ($30-$80/month)
- Inventory management: Cin7 or Skubana ($349-$999/month at scale)
- Financial modeling: Excel or Google Sheets with a purpose-built DTC template
- Analytics: Triple Whale or Northbeam for blended CAC tracking ($200-$500/month)
Your weekly metrics dashboard should track: blended CAC by channel, new customer revenue vs returning customer revenue, contribution margin per order, inventory days on hand, and cash balance vs 13-week forecast.
You can find purpose-built financial projections templates and startup financial models at EFM that include pre-built DTC unit economics calculators.
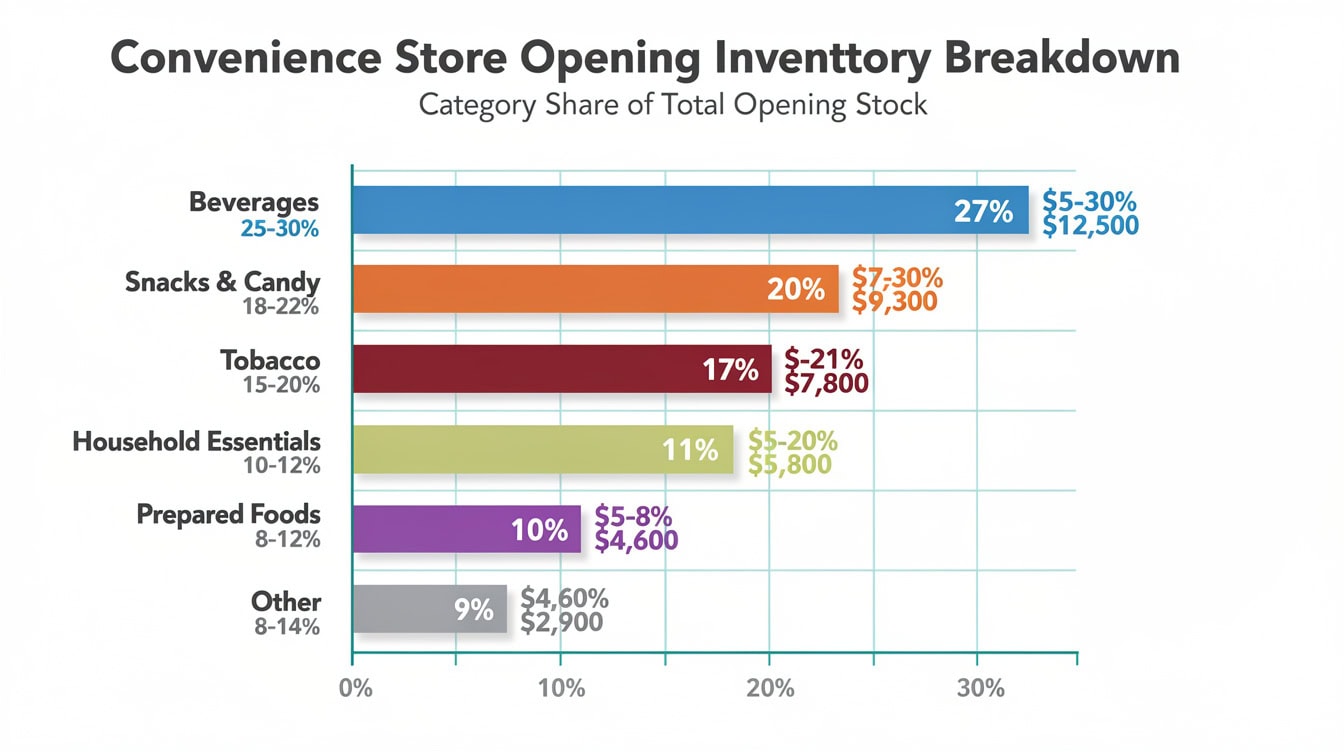
A functional DTC financial stack costs $500-$1,500 per month before paid media — budget for it as a fixed operating cost from day one.
Hidden Costs That Kill DTC Margins: What Most Founders Underestimate
The costs that destroy DTC profitability are rarely the obvious ones. They accumulate in the gaps between your model and reality.
Returns and refunds are the most common margin killer. Apparel brands typically see 8-15% return rates; CPG and consumables run 5-8%.
Source: National Retail Federation
A 12% return rate on $100,000 in revenue means $12,000 in gross revenue that never materializes, plus the cost of processing, restocking, or disposing of returned goods.
Payment processing fees compound at scale. Shopify Payments charges 2.9% + $0.30 per transaction on the Basic plan. On $1,000,000 in annual revenue, that’s $29,000+ in processing fees before any other costs.
Discounting and promotions destroy contribution margin faster than any other lever. A 20% discount on a product with a 55% gross margin reduces that margin to 44%. Run that through a full P&L and a promotional campaign that drives volume can actually reduce total gross profit dollars.
Chargebacks in e-commerce typically run 0.5-1.0% of transactions. Each chargeback costs the transaction amount plus a $15-$25 dispute fee from your payment processor.
Model all of these explicitly in your financial model before launch, not after your first bad month.
Scenario Planning: Building Financial Resilience Into Your Model
A single-scenario financial model is a false sense of security. Build at least three scenarios: base, upside, and downside.
The variables that most dramatically affect DTC financial outcomes:
- CAC variability: iOS 14.5 and subsequent privacy changes removed deterministic attribution from Meta ads. Your CAC can swing 30-50% between Q4 (expensive) and Q1 (cheaper). Model seasonal CAC curves, not a flat assumption.
- Supplier cost increases: Raw material inflation and freight cost volatility can compress COGS by 5-15% with little warning. Build a COGS sensitivity table showing margin impact at +5%, +10%, and +15% cost increases.
- Conversion rate changes: A 0.5 percentage point drop in site conversion rate (from 2.5% to 2.0%) on $100,000 in monthly ad spend can reduce monthly revenue by 20% with no change in marketing cost.
Your downside scenario should answer: if CAC doubles and conversion rate drops 20%, how many months of runway do you have? If the answer is less than 6 months, you need more capital or a lower fixed cost base before you launch.
For structured 5-year financial projections with built-in scenario planning, EFM’s e-commerce templates include sensitivity tables pre-wired to your key assumptions.
When to Hire Financial Expertise: CFO, Bookkeeper, or Fractional Support
Most early DTC founders try to handle finance themselves for too long. The cost of that delay is usually larger than the cost of the help.
Here’s a practical hiring sequence:
- $0-$500K annual revenue: A bookkeeper ($500-$1,500/month) plus a DTC-specific financial model you maintain yourself. Focus on clean books and weekly cash tracking.
- $500K-$2M annual revenue: Add a part-time controller or fractional CFO ($2,000-$5,000/month). You need accrual accounting, proper inventory accounting, and monthly financial statements.
- $2M+ annual revenue: A full-time controller and fractional CFO, or a full-time CFO if you’re raising institutional capital. At this revenue level, financial reporting, covenant compliance, and investor relations require dedicated expertise.
Fractional CFO services for DTC brands typically cost $3,000-$8,000 per month and provide 10-20 hours of senior financial expertise. That’s a fraction of the cost of a full-time hire and appropriate for most brands under $5M in revenue.
For founders who want to build their own financial infrastructure, general Excel financial models and financial planning templates give you a professional starting point without the consulting cost.

Fractional CFO services for DTC brands typically cost $3,000-$8,000 per month — a fraction of the cost of a full-time hire for brands under $5M in revenue.
Frequently Asked Questions
How much money do I actually need to start a DTC brand?
The realistic minimum for a low-ticket DTC brand is $46,000-$106,000, and for a premium product brand, $108,000-$255,000. These figures include inventory, website and tech stack, launch marketing, branding, operations setup, and a working capital buffer. The working capital buffer is the component most founders skip, and it’s the one that causes brands to run out of cash 4-6 months in. If you’re bootstrapping, plan for 18 months of operating expenses in reserve before you launch paid advertising at scale. Undercapitalization is the single most common financial reason DTC brands fail in their first year.
What is a good LTV:CAC ratio for a DTC brand?
A ratio of 3:1 is the widely accepted minimum threshold for a scalable DTC business. At 3:1, you earn $3 in lifetime gross profit for every $1 spent acquiring a customer, leaving enough margin to cover fixed costs and generate profit. Ratios below 2:1 indicate you’re likely losing money on customer acquisition at scale. Ratios above 5:1 often suggest you’re underinvesting in growth. For example, if your blended CAC is $40 and your 12-month LTV is $160 (at 50% gross margin on $320 in cumulative purchases), your LTV:CAC is 4:1, which is a healthy signal to increase ad spend. Subscription-based DTC brands often achieve 5:1 or higher because repeat purchase behavior is locked in.
How does iOS 14.5 affect DTC financial planning?
iOS 14.5, released in April 2021, introduced App Tracking Transparency (ATT), which requires apps to ask users for permission to track them across other apps and websites. The majority of users opt out, which broke the deterministic attribution that Meta’s ad platform relied on to optimize campaigns and report accurate CAC. The practical result: reported CAC in Meta Ads Manager often understates true CAC by 20-40%, and campaign optimization became less efficient. For financial planning, this means you should use blended CAC (total marketing spend divided by total new customers) rather than platform-reported CAC, build in a 20-30% CAC buffer above your historical Meta-reported numbers, and diversify acquisition channels to reduce dependence on any single platform.
What’s the difference between cash-basis and accrual accounting for DTC brands?
Cash-basis accounting records revenue when cash is received and expenses when cash is paid. Accrual accounting records revenue when it’s earned (when the order ships) and expenses when they’re incurred (when inventory is received, even if you haven’t paid yet). For DTC brands, accrual accounting is essential because it accurately matches the cost of goods to the revenue they generate. Under cash-basis, a large inventory purchase in January looks like a massive loss even if those goods will generate revenue through June. Under accrual, the COGS flows through your P&L as you sell. Most lenders and investors require accrual-basis financials, and the IRS requires accrual accounting for businesses with over $27 million in average annual gross receipts (per current tax code thresholds).
How do I model inventory for a DTC brand launch?
Start with your sales forecast: how many units do you expect to sell in months 1-3? Add a safety stock buffer of 20-30% above that forecast to avoid stockouts. Then work backward through your lead time: if your manufacturer needs 60 days to produce and 30 days to ship, you need to place your order 90 days before your launch date. Your initial inventory investment equals (forecasted units + safety stock) x unit COGS. For a brand forecasting 500 units in the first 3 months with a $22 unit cost and 25% safety stock buffer, that’s 625 units x $22 = $13,750 in initial inventory. Reorder when inventory drops to your safety stock level to avoid gaps in availability.
What are the most common financial mistakes DTC founders make?
The 5 most common financial mistakes are: (1) Underestimating CAC by relying on platform-reported numbers rather than blended CAC, which leads to overspending on ads before unit economics are proven. (2) Ignoring the cash conversion cycle and running out of cash while technically profitable. (3) Failing to model returns and refunds, which can reduce effective gross margin by 3-8 percentage points. (4) Using cash-basis accounting, which distorts profitability when inventory is involved. (5) Scaling ad spend before achieving a 3:1 LTV:CAC ratio, which accelerates losses rather than growth. Each of these mistakes is preventable with a properly built financial model reviewed monthly.
When should a DTC brand consider revenue-based financing?
Revenue-based financing (RBF) makes sense when you have at least 6 months of revenue history, a proven CAC:LTV ratio above 2:1, and a specific use of funds that will generate a return within 6-12 months (typically inventory or paid media). The cost of RBF, typically a 1.06-1.12x factor rate on the advance, translates to an effective APR of 15-40% depending on repayment speed. That cost is justified if the capital generates a return above that rate. For example, a $50,000 RBF advance at a 1.10x factor rate costs $5,000. If that capital funds an inventory run that generates $80,000 in revenue at 50% gross margin ($40,000 gross profit), the net gain after financing cost is $35,000. RBF is not appropriate for funding fixed costs or covering operating losses.
Conclusion
Building a profitable DTC brand is a financial engineering problem as much as a marketing or product problem. The brands that survive their first 3 years get unit economics right before scaling, model cash flow conservatively, and build financial infrastructure early enough to make fast decisions.
I recommend downloading the EFM DTC Financial Model Template to build your 3-year projection with pre-built unit economics calculators, a 13-week cash flow forecast, scenario planning tools, and contribution margin analysis designed specifically for direct-to-consumer brands. It’s the fastest way to move from assumptions to a model you can actually run your business against.
























































