
0 ITEMS

SaaS Modeling & Budgeting: CAC Payback to MRR Waterfall

Building a SaaS financial model without understanding subscription economics is like forecasting a restaurant’s revenue without counting tables. The mechanics are fundamentally different, and the mistakes are expensive.
Key Takeaways
- SaaS gross margins typically range from 70% to 85% for mature companies and 50% to 70% for early-stage businesses, making cost structure modeling critical from day one.
- A healthy CAC payback period sits below 12 months for SMB SaaS and below 18 months for mid-market, according to OpenView Partners benchmarks.
- Net Revenue Retention (NRR) above 100% means your existing customer base grows without adding a single new logo, the most powerful lever in any SaaS model.
- The MRR waterfall (new MRR + expansion MRR minus churned MRR minus contraction MRR) is the single most important revenue schedule to build first.
- Rule of 40 combines revenue growth rate and EBITDA margin; scores above 40 signal a healthy balance between growth and profitability at any stage.
- Churn compounds: a 2% monthly churn rate eliminates 22% of your customer base annually, a fact most linear models miss entirely.
- Annual prepayments improve cash flow dramatically but require deferred revenue accounting that separates cash received from revenue recognized.
Why SaaS Financial Models Differ From Traditional Business Budgets
A SaaS financial model tracks subscription economics, not one-time transactions, which changes every line of the income statement, balance sheet, and cash flow statement. Traditional businesses recognize revenue when they deliver a product. SaaS companies recognize revenue ratably over the subscription period, regardless of when cash arrives.
This creates three distinct timing layers that every SaaS model must separate:
- Bookings: the total contract value signed in a period (a leading indicator)
- Billings: the amount invoiced (often annual upfront)
- Revenue: the portion earned and recognized in the period (monthly ratable)
A founder who closes a $120,000 annual contract in January recognizes only $10,000 of revenue per month. The remaining $110,000 sits on the balance sheet as deferred revenue, a liability, until earned. According to the Financial Accounting Standards Board’s ASC 606 standard, SaaS companies must recognize revenue as performance obligations are satisfied, not when cash is collected. Source Confusing bookings with revenue is the single most common modeling error at seed and Series A stage.

Bookings, billings, and revenue recognize at different times. A $120K annual contract booked in January generates only $10K of recognized revenue per month.
The Foundational Structure: Building Blocks of a SaaS Financial Model
Every SaaS financial model needs five interconnected schedules that feed into standard three-statement financials. Build them in this order: revenue, headcount, COGS, operating expenses, and cash flow.
Revenue Schedule (MRR Waterfall): Start with beginning MRR, add new MRR from new customers, add expansion MRR from upsells and seat additions, subtract churned MRR from cancellations, and subtract contraction MRR from downgrades. The result is ending MRR, which becomes the next period’s beginning MRR.
Headcount Plan: Model every role by department, start date, fully loaded cost (salary plus benefits plus payroll taxes, typically 1.2x to 1.3x base salary), and whether the role is COGS or OpEx. Headcount typically drives 60% to 80% of total SaaS operating expenses.
COGS for SaaS: SaaS cost of goods sold includes hosting and infrastructure, customer success salaries, implementation costs, and third-party software embedded in the product. Gross margin is the first health signal investors check. Mature SaaS companies target 75% to 85% gross margins; early-stage companies often run 55% to 70% as infrastructure costs are not yet optimized.
Operating Expenses by Department: Separate Sales, Marketing, R&D, and G&A. Each department should have its own headcount-driven budget with non-headcount line items (tools, events, contractors) modeled as a percentage of departmental headcount cost or as fixed amounts.
Cash Flow Schedule: Translate P&L to cash by adjusting for deferred revenue changes, accounts receivable timing, and capital expenditures.
For a pre-built structure that handles all five schedules, the SaaS Financial Model Bundle includes MRR waterfalls, cohort tabs, and unit economics dashboards ready to populate with your assumptions.

Build SaaS financial models in this sequence: revenue first, then headcount, COGS, operating expenses, and cash flow. Each schedule feeds the next.
Modeling Subscription Revenue: MRR Waterfalls and Cohort Analysis
The MRR waterfall is the revenue engine of your model, and cohort analysis is the lens that reveals whether that engine is accelerating or decaying. Build both before touching any expense line.
Building the MRR Waterfall
Here’s the math for a simple monthly MRR waterfall:
- Beginning MRR: $200,000
- New MRR (15 new customers at $1,000 ACV/12): +$15,000
- Expansion MRR (3% of beginning MRR): +$6,000
- Churned MRR (2% of beginning MRR): -$4,000
- Contraction MRR (0.5% of beginning MRR): -$1,000
- Ending MRR: $216,000
Net Revenue Retention (NRR) for this period equals (Beginning MRR + Expansion MRR minus Churned MRR minus Contraction MRR) divided by Beginning MRR: ($200,000 + $6,000 – $4,000 – $1,000) / $200,000 = 100.5%. An NRR above 100% means the existing base grows on its own.
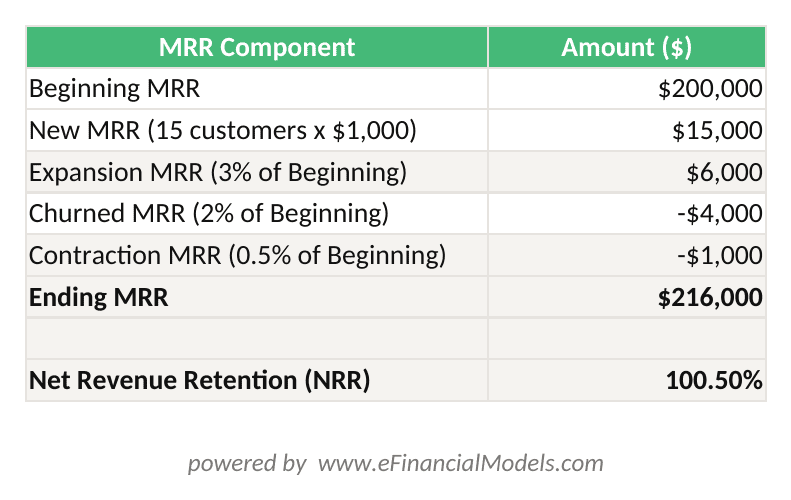
MRR Waterfall: Ending MRR = Beginning MRR + New MRR + Expansion MRR – Churned MRR – Contraction MRR. NRR = (Beginning + Expansion – Churned – Contraction) / Beginning.
Cohort Analysis
Cohort analysis groups customers by acquisition month and tracks their revenue contribution over time. It answers the question: do customers acquired in Q1 retain better than those acquired in Q4? Build a cohort table with acquisition months as rows and months since acquisition as columns. Each cell shows the percentage of original MRR still active. A healthy SMB SaaS cohort retains 80% of MRR at month 12; enterprise cohorts often retain 90% or more.

Cohort heat maps reveal whether newer customer cohorts retain better or worse than older ones, a critical signal for product-market fit and churn management.
Unit Economics: Modeling CAC, LTV, and Payback Periods
Unit economics quantify the profitability of acquiring and retaining a single customer. Model these three metrics before scaling any go-to-market spend.
Customer Acquisition Cost (CAC): Total sales and marketing spend in a period divided by the number of new customers acquired in that period. If you spend $150,000 on sales and marketing in Q1 and close 30 new customers, your blended CAC is $5,000.
Lifetime Value (LTV): Average revenue per account (ARPA) multiplied by gross margin percentage, divided by monthly churn rate. Using the example above: $1,000 ARPA x 75% gross margin / 2% monthly churn = $37,500 LTV.
LTV:CAC Ratio: $37,500 / $5,000 = 7.5x. Investors typically look for ratios above 3x as a minimum threshold, with 5x or higher signaling strong unit economics.
CAC Payback Period: CAC divided by (ARPA x gross margin percentage). $5,000 / ($1,000 x 75%) = 6.7 months. OpenView Partners’ 2023 SaaS benchmarks show median CAC payback periods of 15 to 20 months across growth-stage SaaS companies, making sub-12-month payback a genuine competitive advantage. Source
For modeling these metrics across multiple customer segments and pricing tiers, the Freemium SaaS Financial Model includes a dedicated LTV to CAC ratio dashboard.
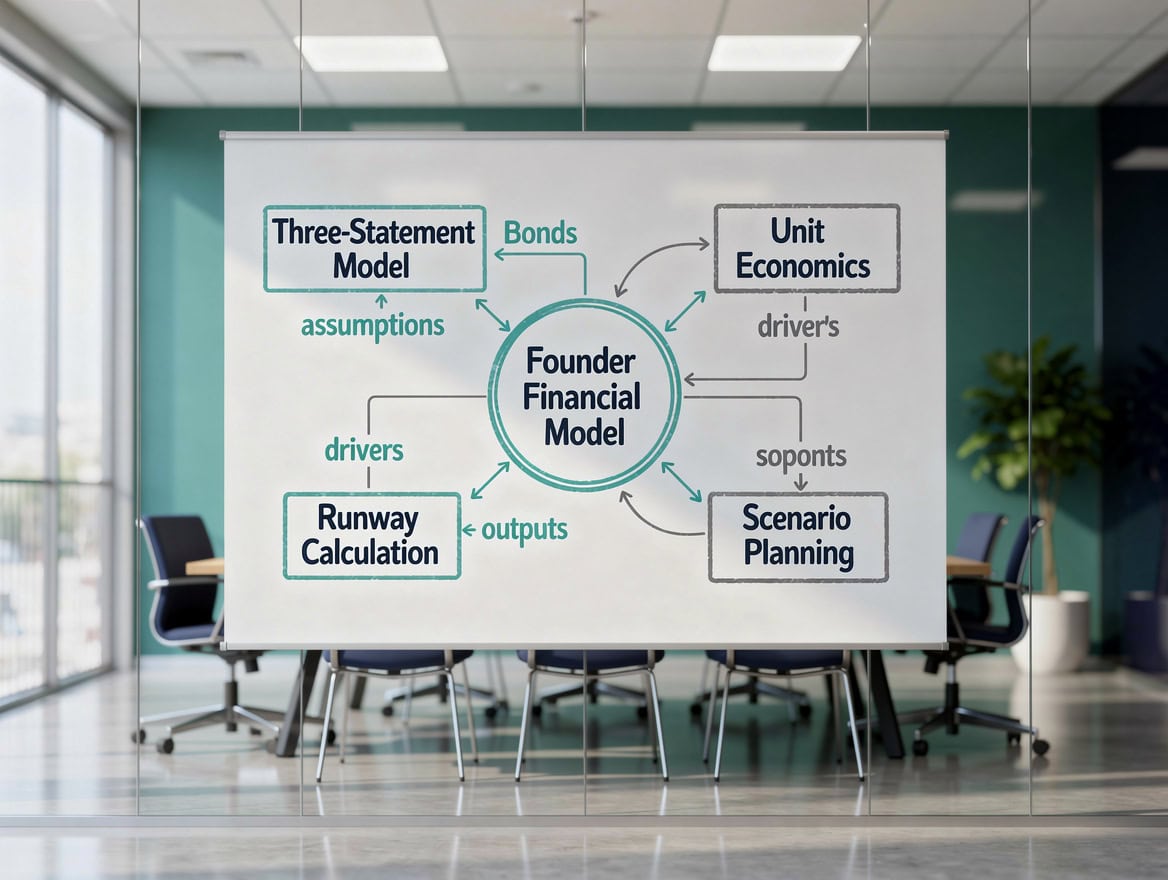
CAC, LTV, and payback period form an interconnected triangle. Improving any one metric improves the others, but churn rate is the variable that moves all three simultaneously.
Building the Expense Budget: Headcount, COGS, and Department Allocation
Expense budgeting in SaaS follows the revenue model, not the calendar. Hire ahead of growth targets, not after them, because sales reps take 3 to 6 months to ramp to full quota.
Headcount Planning by Stage
Seed-stage SaaS companies typically allocate 40% to 50% of operating expenses to R&D, keeping sales and marketing lean until product-market fit is confirmed. Series A companies shift toward 30% to 40% on sales and marketing as they scale the go-to-market engine. Growth-stage companies (Series B and beyond) often spend 40% to 60% of revenue on sales and marketing to capture market share.
According to Bessemer Venture Partners’ State of the Cloud report, top-quartile SaaS companies at $10M ARR spend approximately 40 cents on sales and marketing for every dollar of new ARR generated, a ratio called the CAC ratio or magic number. Source
COGS Allocation
Separate COGS from operating expenses carefully. Customer success managers who handle onboarding belong in COGS. Customer success managers who handle renewals and upsells belong in sales. This distinction directly affects gross margin, the metric investors use to benchmark your business against peers.
The Hiring Plan for SaaS template helps you map every role to the correct P&L line with ramp schedules and fully loaded cost calculations.

SaaS expense allocation shifts dramatically by stage. Sales and marketing grows from 25% at seed to 55% at growth stage as companies scale their go-to-market engine.
Scenario Planning and Sensitivity Analysis for SaaS Variables
Scenario planning tests how your model behaves when key assumptions change. Build at least three scenarios: base, upside, and downside. Then run sensitivity analysis on the variables that move the model most.
Key Variables to Stress-Test
| Variable | Downside | Base | Upside |
|---|---|---|---|
| Monthly Churn | 3.5% | 2.0% | 1.0% |
| New Logos/Month | 8 | 15 | 25 |
| ACV | $800 | $1,000 | $1,300 |
| Sales Cycle (days) | 90 | 60 | 45 |
| Gross Margin | 65% | 75% | 82% |
Churn is the most powerful lever. Running the downside scenario (3.5% monthly churn) against the base scenario reveals that your ARR at month 24 drops by 38% even if you hit every new logo target. That single insight justifies investment in customer success before scaling sales.
For sensitivity analysis, build a two-variable data table in Excel — Excel supports up to 2 input variables per data table (Microsoft) — showing ARR at month 24 across combinations of churn rate and new logo count. This gives investors a clear view of the range of outcomes without requiring them to re-run your model.

A two-variable sensitivity table shows the full range of ARR outcomes. The churn axis moves the model more than the new logo axis at most growth stages.
Cash Flow Forecasting in a Subscription Business
SaaS cash flow differs from P&L in two important ways: annual prepayments create a cash timing advantage, and hypergrowth creates a cash timing disadvantage.
Annual Prepayments: When a customer pays $12,000 upfront for an annual subscription, you receive $12,000 in cash in month one but recognize only $1,000 per month in revenue. The remaining $11,000 sits in deferred revenue. As you grow, the deferred revenue balance grows, creating a structural cash flow benefit. A company growing from $1M to $2M ARR with 70% annual billing collects significantly more cash than its P&L revenue line suggests.
Burn Multiple: Burn multiple equals net cash burned divided by net new ARR added. A burn multiple below 1.0x means you’re generating more than $1 of new ARR for every $1 burned. Bessemer Venture Partners benchmarks suggest burn multiples below 1.5x are considered efficient for growth-stage SaaS companies. Source
Runway Planning: Divide current cash balance by monthly net burn. If you have $3M in the bank and burn $250,000 per month net, you have 12 months of runway. Model the point at which revenue growth reduces burn to zero (the default alive date) and compare it to your fundraising timeline. Most investors want to see 18 months of runway post-close.

The default alive date is where revenue growth reduces net burn to zero. Model this point explicitly to know whether you need to raise capital or can reach profitability on current cash.
Connecting Your Model to Key SaaS Benchmarks and Investor Metrics
Your financial model should produce the metrics investors will ask for in a first meeting. Build a summary dashboard that auto-calculates these from your model outputs.
SaaS Benchmark Comparison
| Metric | Early Stage | Growth Stage | Best-in-Class |
|---|---|---|---|
| Gross Margin | 55-70% | 70-80% | 80-85% |
| NRR | 90-100% | 100-110% | 120%+ |
| CAC Payback | 18-24 mo | 12-18 mo | <12 mo |
| Rule of 40 | 0-20 | 20-40 | 40+ |
| Burn Multiple | 2.0-3.0x | 1.0-2.0x | <1.0x |
Rule of 40: Add your annual revenue growth rate percentage to your EBITDA margin percentage. A company growing at 60% with a -20% EBITDA margin scores 40. A company growing at 20% with a 25% EBITDA margin scores 45. According to Bain & Company analysis of public SaaS companies, those consistently scoring above 40 trade at a median revenue multiple 2x higher than those below 40. Source
The SaaS Metrics Dashboard Template auto-populates Rule of 40, burn multiple, NRR, and CAC payback from your model inputs, giving you an investor-ready summary in one tab.

An investor-ready metrics dashboard auto-calculates Rule of 40, burn multiple, NRR, and CAC payback from model inputs, giving founders a benchmark snapshot for fundraising conversations.
Common Pitfalls and How to Avoid Them
Most SaaS modeling mistakes fall into four categories. Each one distorts your projections in a predictable direction.
Mistake 1: Linear Growth Assumptions. Modeling new customer additions as a flat number each month ignores sales team ramp, seasonality, and pipeline build time. Fix: model new logos as a function of quota-carrying headcount, ramp percentage, and quota attainment rate. A rep at 50% ramp in month two generates half the pipeline of a fully ramped rep.
Mistake 2: Ignoring Churn Compounding. A 2% monthly churn rate feels small. Compounded over 12 months, it eliminates 21.5% of your starting MRR from existing customers. Fix: build the MRR waterfall month by month and let the math compound. Never annualize monthly churn by multiplying by 12 (that gives 24%, not 21.5%, and overstates the problem).
Mistake 3: Confusing Bookings with Revenue. Reporting $500,000 in Q1 bookings when you recognized $125,000 in Q1 revenue misleads investors and distorts your own operating decisions. Fix: maintain separate bookings, billings, and revenue schedules and never mix them in the same chart.
Mistake 4: Underestimating CAC. Founders often count only direct sales salaries in CAC and forget marketing spend, sales tools, commissions, and management overhead. Fix: include all sales and marketing costs, including the CEO’s time spent on sales at seed stage, in your CAC calculation.
Mistake 5: Ignoring Expansion Revenue in Early Models. Founders building their first model often project only new logo revenue. But expansion MRR from seat additions, usage growth, and upsells can represent 20% to 40% of total MRR growth at Series A and beyond. Fix: add an expansion MRR line from month one, even if the assumption is conservative (1% to 2% of beginning MRR monthly).

These five modeling mistakes consistently appear in early-stage SaaS models. Each one distorts projections in a predictable direction that experienced investors will immediately identify.
Frequently Asked Questions
What is the difference between MRR and ARR in a SaaS model?
MRR (Monthly Recurring Revenue) is the normalized monthly value of all active subscriptions. ARR (Annual Recurring Revenue) is simply MRR multiplied by 12. Use MRR for operational tracking and month-over-month analysis. Use ARR for investor conversations, benchmarking, and valuation discussions. A company with $500,000 MRR has $6,000,000 ARR. The key rule: never include one-time fees, professional services, or non-recurring revenue in either figure. Including non-recurring items inflates both metrics and misleads investors about the true recurring revenue base. Most SaaS investors apply revenue multiples to ARR, so accuracy here directly affects your valuation.
How do I model churn when I have fewer than 50 customers?
With fewer than 50 customers, individual churn events create statistical noise that makes percentage-based churn modeling unreliable. Instead, model churn at the customer level: list each customer, their MRR, their contract end date, and your estimated renewal probability. Assign 80% renewal probability to happy customers with active usage, 50% to at-risk accounts, and 20% to customers who haven’t logged in for 60 days. Sum the expected MRR from renewals to get your projected retained MRR. This customer-level approach is more accurate at small scale and forces you to think about each account individually, which is exactly what you should be doing at this stage.
What gross margin should I target in my SaaS model?
Target 70% or higher gross margin as a medium-term goal, with 75% to 80% as the benchmark for a well-optimized SaaS business. Early-stage companies often run 55% to 65% gross margins because infrastructure costs aren’t yet optimized and customer success headcount is high relative to revenue. As you scale, hosting costs per customer drop (economies of scale in cloud infrastructure), and gross margin expands. If your gross margin is below 50%, you likely have a services-heavy delivery model or significant third-party software costs embedded in COGS that need to be renegotiated or engineered out. Investors use gross margin as a proxy for the scalability of your business model.
How do I build a SaaS budget when I have no historical data?
Start with your go-to-market assumptions and work backward. Decide how much ARR you want to reach in 12 months, then calculate how many new customers you need (ARR target divided by average ACV). Calculate how many sales reps you need to close that many deals (new customers divided by average rep quota). Calculate the marketing spend needed to generate enough pipeline (new customers divided by win rate gives you required opportunities; multiply by average opportunity value and your pipeline coverage ratio, typically 3x to 4x, to get required pipeline). This top-down approach gives you a budget anchored to revenue targets rather than arbitrary cost assumptions. Validate each assumption against industry benchmarks and adjust as you gather real data.
What is the Rule of 40 and how do I calculate it in my model?
The Rule of 40 is a SaaS health metric that balances growth and profitability. Calculate it by adding your year-over-year revenue growth rate (as a percentage) to your EBITDA margin (as a percentage). For example, if your ARR grew from $2M to $3.4M (70% growth) and your EBITDA margin is -25%, your Rule of 40 score is 70 + (-25) = 45. A score above 40 is considered healthy. Below 20 signals that neither growth nor profitability is strong enough to justify the business model. Build this metric into your model’s summary dashboard so you can see how different scenarios affect your score. Bain & Company research shows that public SaaS companies above 40 trade at revenue multiples roughly double those of companies below 40.
How much runway should I model before my next fundraise?
Model a minimum of 18 months of runway from your expected close date, with 24 months as the target. Fundraising typically takes 3 to 6 months from first meeting to cash in the bank, so you need to start the process when you have at least 9 to 12 months of runway remaining. Build your cash flow model to show the exact month your runway drops below 12 months, then back-calculate when you need to begin fundraising. Also model the impact of hitting or missing your ARR milestones on your next round valuation. Investors at Series A typically look for $1M to $3M ARR with strong growth rates; Series B investors typically look for $5M to $15M ARR with evidence of repeatable go-to-market motion.
Should I use a bottom-up or top-down approach for SaaS revenue forecasting?
Use bottom-up for your operating model and top-down for your investor narrative. Bottom-up means building revenue from individual drivers: number of sales reps multiplied by quota attainment rate multiplied by average ACV, plus expansion from existing customers. This approach is credible because every assumption is traceable to an operational decision. Top-down means starting with total addressable market and applying market share assumptions, which is useful for framing the opportunity but not for running the business. The best SaaS models show both: a bottom-up revenue build that drives the P&L, and a top-down market context slide that shows why the bottom-up numbers are achievable given the market size. Investors will stress-test your bottom-up assumptions, so make sure every number connects to a real operational lever.
Conclusion
A SaaS financial model is not a spreadsheet exercise. It’s the operating system for your business decisions, from when to hire your next sales rep to how much runway you have before your next raise. The frameworks in this article, MRR waterfalls, cohort analysis, unit economics, and scenario planning, give you the structure to make those decisions with data rather than intuition.
I recommend downloading the SaaS Financial Model Excel Template to implement these frameworks immediately. It includes pre-built MRR waterfall schedules, cohort analysis tabs, unit economics calculators, and a benchmark dashboard that auto-populates Rule of 40, burn multiple, and NRR from your inputs. Start with your current MRR, your last three months of churn data, and your CAC, and you’ll have a working model in under two hours. Excel’s XNPV function, which discounts cash flows at exact dates rather than assuming end-of-period timing, accepts up to 29 future cash flow periods (Microsoft) — a useful constraint to know when building multi-year subscription cash flow schedules. Additionally, Excel’s RATE function can solve for implied monthly churn from cohort data using as few as 3 required arguments (Microsoft), making it a practical tool for reverse-engineering retention assumptions from historical MRR data.
























































