
0 ITEMS

Hospitality KPIs: 10 Metrics That Drive Hotel Profit
Most hotels track occupancy. The ones that outperform their competitive set track 10 interconnected KPIs and act on them daily.
Key Takeaways
- RevPAR (Revenue Per Available Room) is the single most-cited hospitality KPI, but GOPPAR reveals whether that revenue actually reaches the bottom line.
- Industry labor costs average 30 to 35% of total hotel revenue, making labor efficiency the largest controllable expense to optimize.
- Hotels with a Net Promoter Score above 50 generate measurably higher repeat-guest rates, which cost 5 to 7 times less to retain than acquiring new guests.
- OTA (Online Travel Agency) commissions typically run 15 to 25% per booking, making direct booking ratio a critical cost-control KPI.
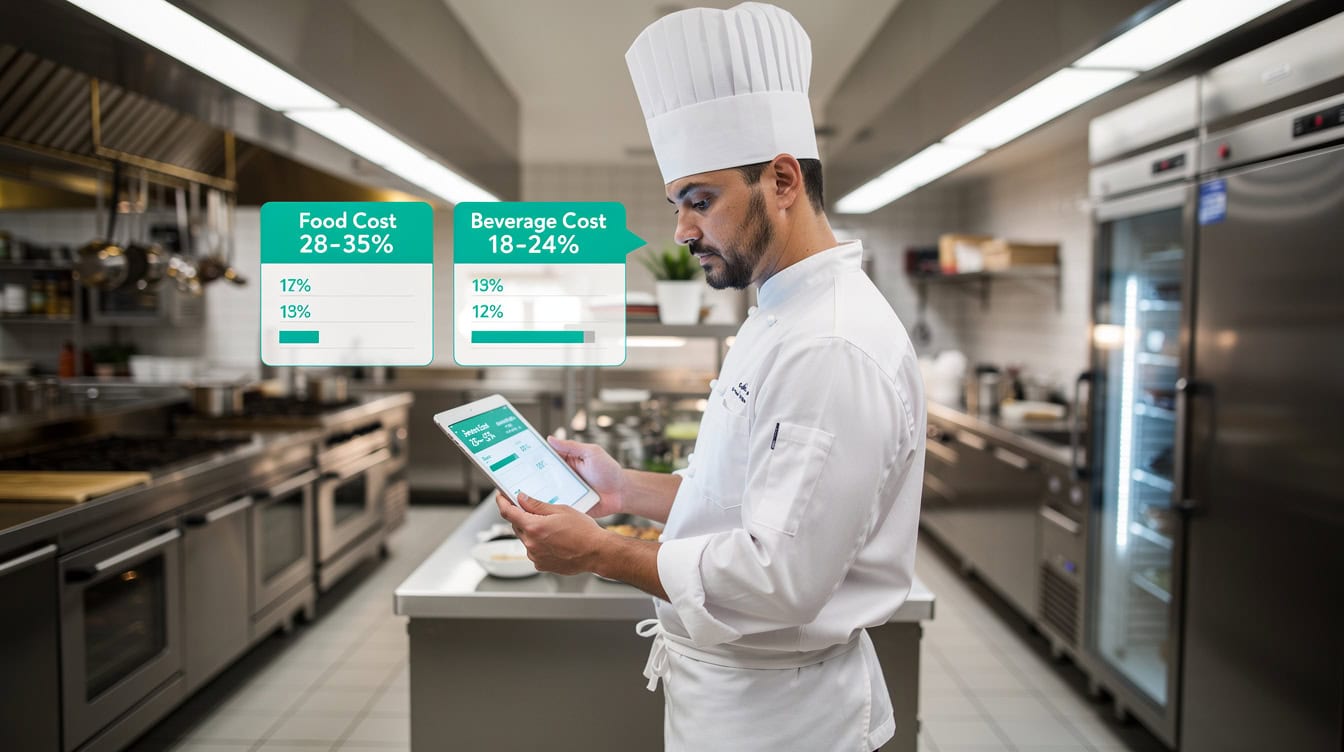
- Food cost percentage for hotel F&B operations benchmarks at 28 to 35%, while beverage cost percentage targets 18 to 24%.
- A Market Penetration Index above 1.0 means your property captures more than its fair share of available demand in the competitive set.
- Luxury properties prioritize ADR and guest satisfaction scores; select-service properties focus on occupancy rate and labor cost percentage.
Why Traditional Hotel Metrics Miss the Complete Financial Picture
Occupancy rate alone tells you how full your hotel is, not how profitable it is. A property running at 95% occupancy with deeply discounted rates can underperform a competitor at 75% occupancy charging premium ADR (Average Daily Rate, the average revenue earned per occupied room per night).
The hospitality industry has evolved toward a layered KPI framework because no single metric captures the full picture. Revenue metrics show top-line performance. Profitability metrics reveal what survives after costs. Operational metrics expose efficiency gaps. Guest experience metrics predict future revenue. Each layer depends on the others, and ignoring any one of them creates blind spots that cost real money.
According to STR Global, properties that actively benchmark across at least 5 KPI categories outperform single-metric trackers by an average of 12 percentage points in GOPPAR growth year-over-year. Source The framework below gives you all five layers.
The Revenue Trifecta: RevPAR, ADR, and Occupancy Rate
RevPAR, ADR, and occupancy rate form the foundation of hotel revenue analysis, and understanding how they interact is more valuable than tracking any one in isolation.
RevPAR (Revenue Per Available Room) combines occupancy and rate into one number. The formula is straightforward:
RevPAR = ADR x Occupancy Rate
Or equivalently: RevPAR = Total Room Revenue / Total Available Rooms
Here’s the math with real numbers: A 200-room hotel charges an ADR of $180 and runs 78% occupancy.
- RevPAR = $180 x 0.78 = $140.40
- Total room revenue for one night = $140.40 x 200 rooms = $28,080
Now compare two strategies for the same property:
| Strategy | ADR | Occupancy | RevPAR | Nightly Revenue |
|---|---|---|---|---|
| Discount-to-fill | $140 | 95% | $133 | $26,600 |
| Rate-hold | $180 | 78% | $140 | $28,080 |
| Premium push | $210 | 68% | $143 | $28,560 |
The premium push generates the highest RevPAR despite the lowest occupancy. This ADR-versus-occupancy trade-off is the central tension in revenue management, and RevPAR is the metric that resolves it.
According to the American Hotel and Lodging Association (AHLA), the U.S. hotel industry posted an average RevPAR of approximately $97 in 2023, with luxury properties averaging above $200 and economy properties below $50. Source These benchmarks shift significantly by market and season, which is why RevPAR index (covered in the next section) matters more than absolute RevPAR.
Profitability KPIs: GOPPAR, Flow-Through, and Margin Metrics
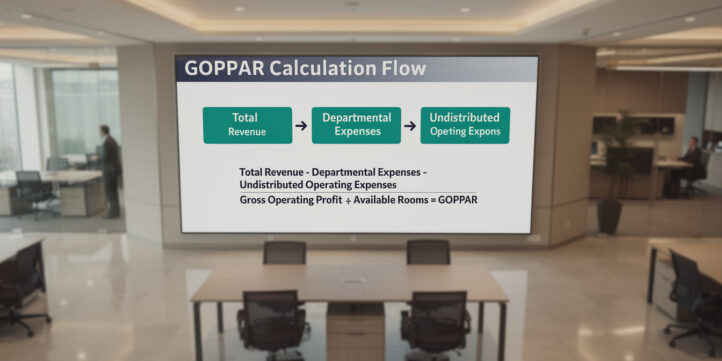
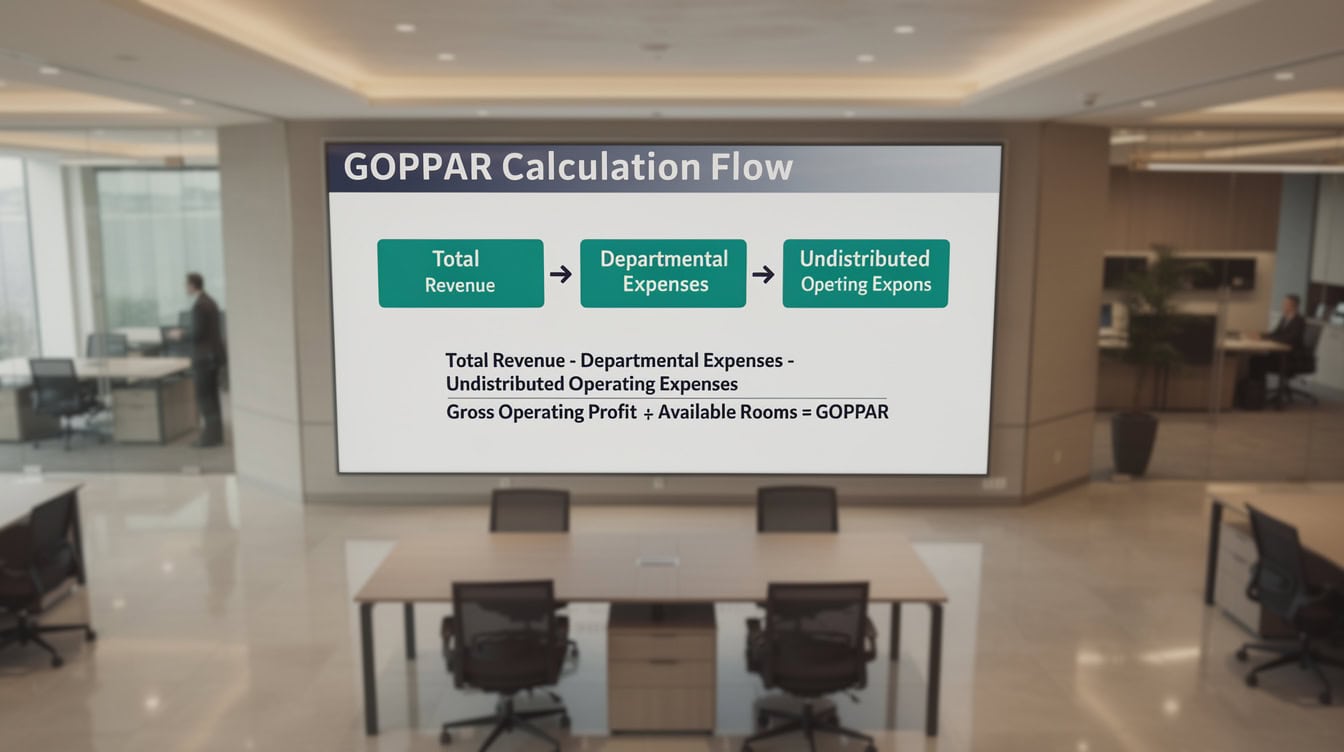
RevPAR measures revenue generation; GOPPAR measures whether that revenue survives the cost structure. GOPPAR (Gross Operating Profit Per Available Room) is the profitability equivalent of RevPAR.
GOPPAR = Gross Operating Profit / Total Available Rooms
Gross Operating Profit (GOP) is total revenue minus departmental expenses and undistributed operating expenses, before fixed charges like debt service and depreciation. A hotel with strong RevPAR but poor cost controls can post a GOPPAR well below industry norms.
Flow-through rate (also called revenue conversion rate) measures what percentage of incremental revenue converts to incremental GOP. A 50% flow-through means every additional $1 of revenue produces $0.50 of profit. Top-performing full-service hotels target 50 to 60% flow-through on revenue gains.
GOP margin (GOP divided by total revenue) benchmarks vary by segment. Luxury full-service properties typically target 30 to 40% GOP margins. Select-service properties, with leaner cost structures, can reach 45 to 55%. Independent properties often run 5 to 10 percentage points below branded peers due to higher distribution and marketing costs.
Tracking GOPPAR alongside RevPAR prevents the common mistake of chasing occupancy at the expense of profitability. A revenue manager who fills rooms at $80 ADR when the break-even rate is $95 is destroying value, not creating it.
Revenue Management KPIs: Benchmarking Against Your Competitive Set
Absolute RevPAR numbers mean little without context. Revenue management KPIs derive their power from comparison against a defined competitive set (comp set), a group of 4 to 6 comparable properties in your market.
RevPAR Index (RPI), also called Revenue Generation Index (RGI), measures your RevPAR relative to the comp set average:
RPI = (Your RevPAR / Comp Set Average RevPAR) x 100
An RPI of 100 means you’re capturing exactly your fair share. Above 100 means you’re outperforming. Below 100 signals a competitive gap.
Market Penetration Index (MPI) applies the same logic to occupancy:
MPI = (Your Occupancy Rate / Comp Set Average Occupancy Rate) x 100
Average Rate Index (ARI) does the same for ADR. Together, MPI and ARI explain why your RPI is where it is. If your MPI is 110 but your ARI is 88, you’re winning on volume but losing on rate, a classic sign of over-discounting.
STR (the hospitality data benchmarking firm) provides comp set data to subscribing properties. According to STR’s methodology documentation, a sustained RPI above 110 over a 12-month rolling period is considered a strong competitive position in most markets. Source
Yield management extends these metrics into forward-looking decisions: adjusting rates based on demand forecasts, booking pace, and length-of-stay patterns. Properties using automated revenue management systems (RMS) that incorporate these KPIs in real time consistently outperform manual rate-setting approaches.

Guest Experience Metrics That Drive Revenue Performance
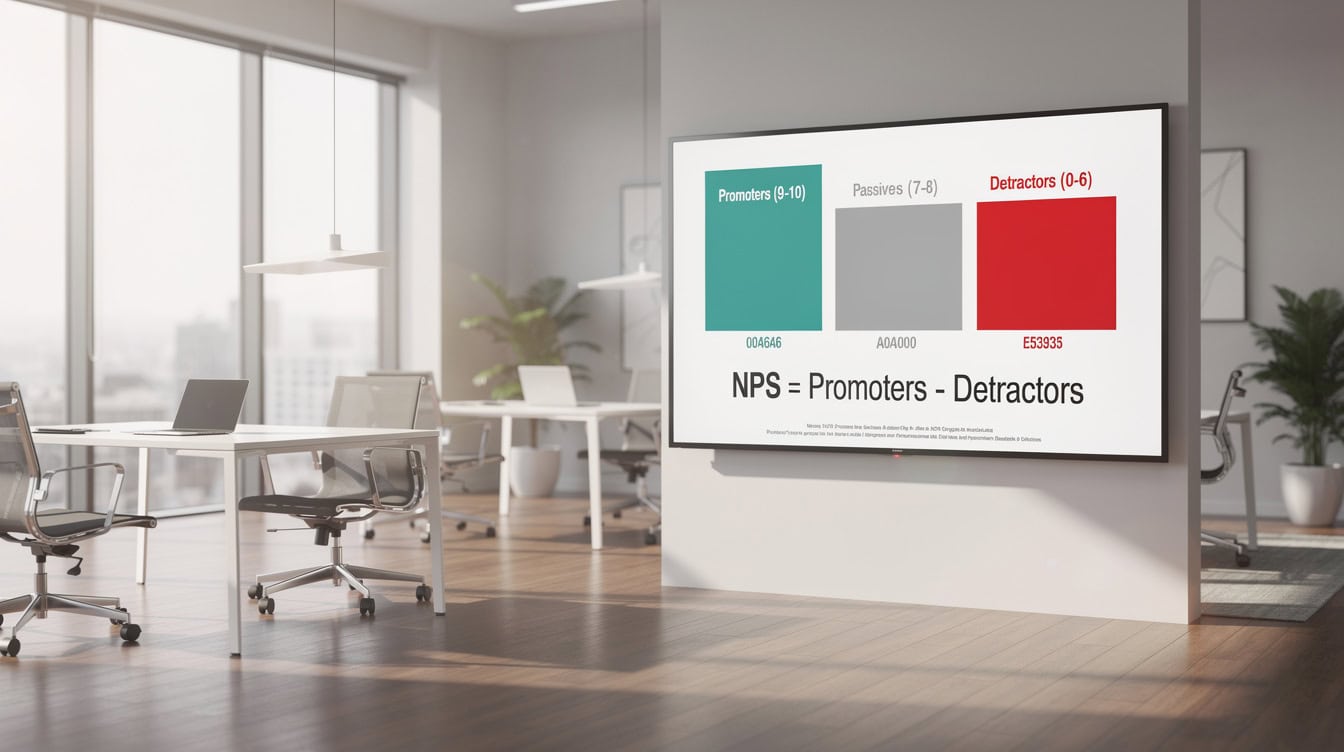
Guest satisfaction scores are not soft metrics. They are leading indicators of future revenue. Properties with higher NPS (Net Promoter Score, a measure of how likely guests are to recommend the property, calculated as the percentage of promoters minus the percentage of detractors) generate more repeat bookings and command higher ADR.
According to research published by Bain and Company, acquiring a new customer costs 5 to 7 times more than retaining an existing one, a ratio that applies directly to hotel guest acquisition costs. Source A 5% increase in repeat guest rate can increase profitability by 25 to 95% depending on the property’s cost structure.
Key guest experience KPIs to track:
- NPS: Target above 50 for upscale and luxury properties. Calculate monthly from post-stay surveys.
- Online Review Rating: Monitor aggregate scores across Google, TripAdvisor, and Booking.com. A 0.5-point improvement in average rating correlates with a 5 to 9% increase in ADR according to Cornell University’s Center for Hospitality Research. Source
- Guest Satisfaction Score (GSS): Brand-specific for flagged properties; use a standardized survey for independents.
- Repeat Guest Percentage: Track the share of arrivals who have stayed before. Luxury properties often target 30 to 40% repeat guests.
- Response Rate to Reviews: Properties that respond to 100% of reviews within 24 hours show measurably better rating trajectories.
The operational implication: guest experience KPIs should feed directly into department-level accountability. Front desk scores drive front office training budgets. Housekeeping scores drive inspection protocols. F&B scores drive menu and service investment decisions.

Labor and Operational Efficiency KPIs
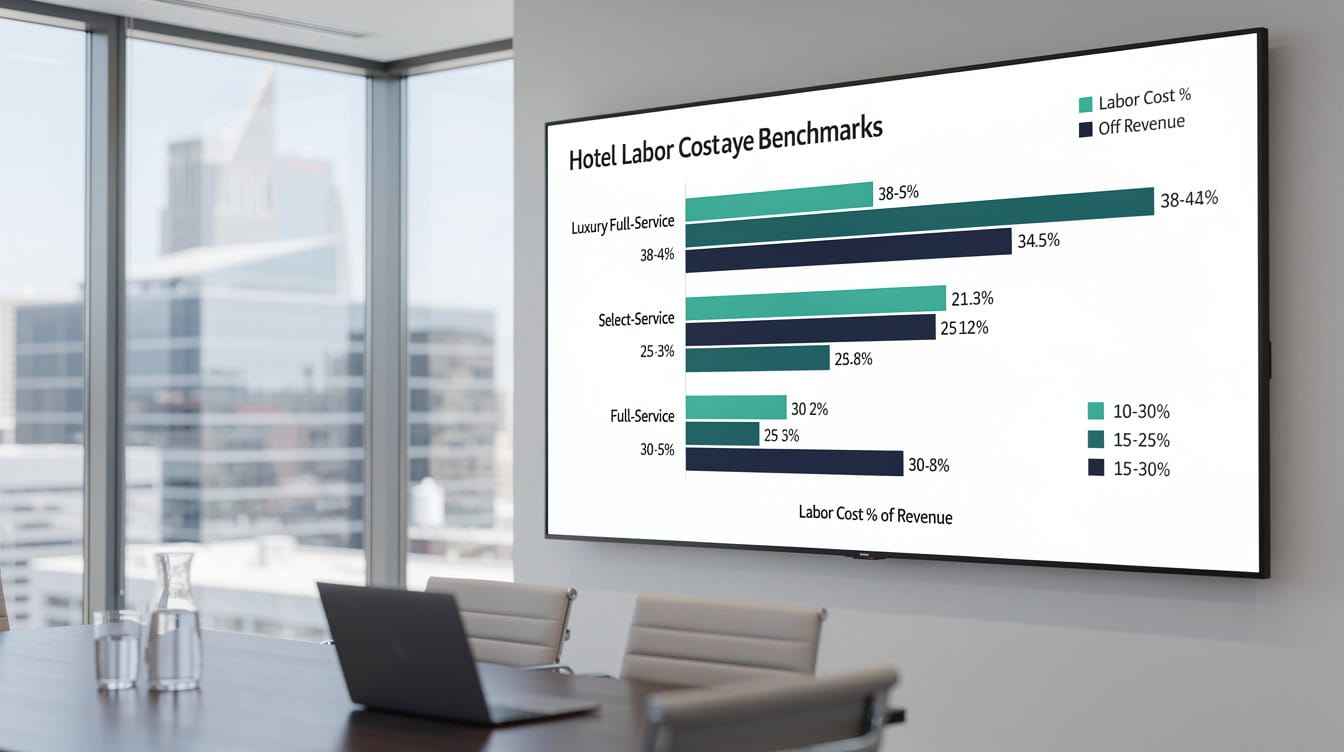
Labor is the largest controllable cost in hotel operations, and it’s the KPI category most directly within a general manager’s control. Industry labor costs average 30 to 35% of total hotel revenue according to the American Hotel and Lodging Association, Source but top-performing select-service properties achieve 25 to 28% through disciplined scheduling and cross-training.
Core labor KPIs:
- Labor Cost Percentage: Total labor costs (wages, benefits, taxes) divided by total revenue. Track by department, not just property-wide.
- Revenue Per Available Labor Hour (RevPALH): Total revenue divided by total labor hours worked. Useful for comparing productivity across shifts and seasons.
- Staff-to-Occupied-Room Ratio: Total staff on shift divided by occupied rooms. Benchmarks vary: luxury full-service properties run 1.5 to 2.0 staff per occupied room; select-service targets 0.5 to 0.8.
- Employee Turnover Rate: The hospitality industry’s annual turnover rate exceeds 70% Source, compared to a cross-industry average of approximately 47%. Replacing a single hourly employee costs an estimated $1,500 to $5,000 in recruiting, onboarding, and lost productivity.
The turnover KPI deserves special attention because it’s both a cost metric and a leading indicator of guest experience quality. High turnover correlates directly with lower GSS scores and higher training costs. Properties that track turnover by department and tenure identify retention problems before they damage guest scores.
Food and Beverage KPIs for Full-Service Properties
F&B operations add revenue complexity that room-only properties don’t face. The key is tracking F&B KPIs separately from rooms, because blending them obscures both the opportunity and the risk.
Essential F&B KPIs:
- Food Cost Percentage: Cost of food sold divided by food revenue. Industry benchmark: 28 to 35%. Above 35% signals portion control, waste, or purchasing problems.
- Beverage Cost Percentage: Cost of beverages sold divided by beverage revenue. Target range: 18 to 24%. Beverage margins are structurally higher than food, so a beverage cost above 28% warrants immediate investigation.
- Cover Count: Total meals served per meal period. Track daily and compare to prior year and budget.
- Average Check: Total F&B revenue divided by cover count. Segment by outlet (restaurant vs. bar vs. room service vs. banquet).
- Revenue Per Available Seat Hour (RevPASH): F&B’s equivalent of RevPAR. Calculated as total outlet revenue divided by (seats x operating hours). Useful for identifying underperforming time slots.
- Banquet and Catering Revenue Per Group Room Night: For conference hotels, this metric reveals how effectively the sales team is attaching F&B spend to group business.
| KPI | Target Range | Red Flag |
|---|---|---|
| Food Cost % | 28-35% | Above 38% |
| Beverage Cost % | 18-24% | Above 28% |
| Average Check | Property-specific | Declining 3+ months |
| RevPASH | Benchmark to prior year | Below 70% of peak |
| Cover Count | Budget | Below 85% of budget |
Distribution and Marketing KPIs: Optimizing Your Channel Mix
Every booking channel has a different cost structure, and ignoring channel economics turns revenue management into a leaky bucket. The goal is not maximum revenue but maximum net revenue after distribution costs.
Direct Booking Ratio: The percentage of room nights booked through the hotel’s own website, call center, or walk-in. Higher direct ratios reduce commission costs. OTA (Online Travel Agency) commissions typically run 15 to 25% per booking, while direct bookings cost 3 to 7% (credit card fees, booking engine costs). A property shifting 10 percentage points of volume from OTA to direct on $5M in room revenue saves $80,000 to $180,000 annually.
Cost Per Acquisition (CPA): Total marketing and distribution spend divided by total bookings generated. Calculate by channel to identify where marketing dollars produce the best net revenue.
Channel Mix: Track the percentage of revenue from each source: OTA, GDS (Global Distribution System, used by travel agents and corporate bookers), direct web, voice, and wholesale. Shifts in channel mix often precede RevPAR changes by 30 to 60 days.
Marketing ROI by Channel: Revenue attributable to a channel minus channel costs, divided by channel costs. Paid search, metasearch, email, and loyalty programs each have distinct ROI profiles that shift with market conditions.
According to the AHLA, properties with loyalty programs generate 30 to 50% of their bookings from repeat members, dramatically reducing OTA dependency and CPA. Source The U.S. Travel Association reports that domestic travel spending reached approximately $1.1 trillion in 2023, Source underscoring the scale of the market that effective channel management helps hotels capture.
How KPI Priorities Shift Across Property Types
A luxury resort in the Maldives and a select-service airport hotel share the same KPI vocabulary but weight the metrics very differently. Applying the wrong priorities to the wrong property type produces misleading conclusions.
| KPI Priority | Luxury Full-Service | Select-Service | Independent | Resort |
|---|---|---|---|---|
| Primary Revenue KPI | ADR | Occupancy Rate | RevPAR Index | RevPAR + F&B |
| Primary Profit KPI | GOPPAR | Labor Cost % | GOP Margin | Total Revenue/Available Room |
| Guest Experience | NPS, GSS | Online Rating | Review Response Rate | NPS, Repeat % |
| Distribution Focus | Direct + GDS | OTA Efficiency | Direct Booking % | Package Revenue |
| Labor Benchmark | 1.5-2.0 staff/room | 0.5-0.8 staff/room | Varies | 2.0+ staff/room |
Luxury properties can sustain lower occupancy because their ADR carries the RevPAR. Select-service properties compete on efficiency: lean labor models, limited F&B, and high OTA visibility. Independent properties must fight harder for direct bookings because they lack brand loyalty infrastructure. Resorts measure total guest spend, not just room revenue, because F&B, spa, and activities revenue often exceeds room revenue.
The practical implication: before building your KPI dashboard, define your property type and competitive set. Then weight your KPIs accordingly.
Building Your Hospitality KPI Dashboard: Implementation Framework
A KPI dashboard only creates value when it drives decisions. The most common failure mode is building a beautiful dashboard that nobody acts on.
Daily tracking (revenue management and front desk):
- Occupancy, ADR, RevPAR vs. budget and prior year
- Booking pace for the next 30, 60, and 90 days
- Pickup report (new reservations added in the last 24 hours)
- Cancellation rate
Weekly tracking (department heads):
- Labor cost percentage by department
- F&B cover counts and average check
- Online review scores and response rate
- Channel mix and direct booking ratio
Monthly tracking (GM and ownership):
- GOPPAR and GOP margin
- RevPAR index vs. comp set
- Employee turnover rate
- NPS and repeat guest percentage
- Marketing ROI by channel
- Variance analysis: actual vs. budget vs. prior year
Accountability structure: Assign each KPI to a named owner. The revenue manager owns RevPAR and channel mix. The F&B director owns food and beverage cost percentages. The HR manager owns turnover rate. Monthly reviews should start with KPI performance before moving to narrative explanations.
Properties using integrated property management systems (PMS) with built-in reporting, such as Opera Cloud, Mews, or Cloudbeds, can automate most daily and weekly KPI pulls. The investment in dashboard infrastructure pays back quickly: a 1% improvement in labor cost percentage on a $10M revenue hotel saves $100,000 annually.
For a structured starting point, the Hospitality Financial Model Bundle from eFinancialModels includes pre-built KPI tracking across all major hospitality metric categories. The Hospitality Hotel Financial Model and Valuation extends this into 10-year projections with scenario analysis built in. For market context, the USA Hospitality Market Study 2026-2031 provides the benchmark data needed to set realistic KPI targets by segment.
Frequently Asked Questions
What is the most important KPI in hospitality?
No single KPI is universally most important, but RevPAR is the most widely used starting point because it combines the two primary revenue levers (rate and occupancy) into one comparable number. However, RevPAR without GOPPAR is incomplete. A property can post strong RevPAR while losing money if labor costs run above 40% of revenue or if OTA commissions consume 20 to 25% of room revenue. For a general manager focused on owner returns, GOPPAR is the more actionable metric because it reflects what the property actually earns after operating costs. Track both, and use RevPAR index to benchmark against competitors.
How do I calculate RevPAR index and what does it mean?
RevPAR Index (also called Revenue Generation Index or RGI) equals your property’s RevPAR divided by the competitive set’s average RevPAR, multiplied by 100. For example, if your RevPAR is $120 and your comp set averages $100, your RGI is 120, meaning you capture 20% more revenue per available room than your fair share. An RGI below 100 means competitors are outperforming you. STR provides comp set data for subscribing properties, and most revenue management systems calculate RGI automatically. A sustained RGI above 110 over a rolling 12-month period is considered a strong competitive position.
What is a good labor cost percentage for a hotel?
Labor cost percentage (total labor costs divided by total revenue) benchmarks at 30 to 35% for full-service hotels according to the American Hotel and Lodging Association. Select-service properties with limited F&B and amenities can achieve 25 to 28%. Luxury resorts with high staff-to-room ratios often run 38 to 45%. The key is tracking labor cost by department, not just property-wide. A housekeeping labor cost above 12% of room revenue or a front desk labor cost above 8% of room revenue are common red flags. Cross-training staff across departments is the most effective lever for reducing labor cost percentage without cutting service quality.
How do I reduce OTA dependency and increase direct bookings?
Reducing OTA dependency requires a parallel strategy: make direct booking easier and cheaper for guests while making your property more visible outside OTA platforms. Start by ensuring your direct booking rate is price-competitive with OTA rates (rate parity). Then invest in a loyalty program, even a simple points system, because AHLA data shows loyalty members book direct at rates 30 to 50% higher than non-members. Metasearch advertising on Google Hotel Ads and TripAdvisor puts your direct rate in front of guests already searching OTA listings. Track your direct booking ratio monthly and set a 12-month target of increasing it by 5 to 10 percentage points. Each percentage point shift from OTA to direct on $5M in room revenue saves approximately $8,000 to $18,000 in commissions.
What NPS score should a hotel target?
NPS (Net Promoter Score) is calculated by subtracting the percentage of detractors (guests rating 0 to 6 on a 10-point likelihood-to-recommend scale) from the percentage of promoters (guests rating 9 or 10). For hospitality, an NPS above 50 is considered strong for upscale and luxury properties. Midscale properties typically target 35 to 50. Economy properties often see NPS in the 20 to 35 range due to lower service expectations. Cornell University’s Center for Hospitality Research found that a 0.5-point improvement in online review ratings (which correlates with NPS improvement) associates with a 5 to 9% increase in ADR. Collect NPS data through post-stay email surveys sent within 24 hours of checkout for the highest response rates.
How often should I review hospitality KPIs?
KPI review frequency should match the decision cycle of the metric. Occupancy, ADR, RevPAR, and booking pace require daily review because revenue management decisions (rate changes, restrictions, promotions) need to happen in near real-time. Labor cost percentage, F&B cover counts, and online review scores work well on a weekly review cycle, giving department heads enough data to identify trends without reacting to daily noise. GOPPAR, RevPAR index, NPS, employee turnover, and marketing ROI belong in monthly reviews with the full leadership team. Annual KPI target-setting should happen during the budget process, with quarterly reforecasts to adjust targets based on market conditions.
What KPI dashboard tools work best for independent hotels?
Independent hotels without enterprise PMS systems have several strong options. Cloudbeds and Mews both include built-in KPI dashboards covering RevPAR, occupancy, ADR, and channel mix at price points accessible to independent properties. For F&B-heavy properties, Toast POS integrates with most PMS platforms and tracks cover counts, average check, and food cost percentage automatically. For custom dashboards that pull from multiple systems, Google Looker Studio (free) or Microsoft Power BI (from $10 per user per month) allow independent operators to build consolidated views. The most important feature is automated data pulls: any dashboard requiring manual data entry will be abandoned within 90 days. For financial modeling and KPI target-setting, the Excel Projects KPIs Template provides a structured starting framework that works alongside any PMS.
Conclusion
Hospitality KPIs work as a system, not a checklist. RevPAR tells you where you stand on revenue. GOPPAR tells you whether that revenue is profitable. Labor cost percentage tells you whether your largest cost is under control. NPS tells you whether guests will come back. Channel mix tells you whether you’re paying too much to fill rooms. Miss any one layer and you’re managing blind.
The properties that consistently outperform their competitive set don’t track more KPIs than their competitors. They track the right KPIs, assign clear ownership, and review them on the right cadence.
I recommend downloading the Hospitality Financial Model Template Bundle from eFinancialModels to get a pre-built KPI dashboard, financial projections, and benchmarking framework tailored to your property type. It’s the fastest way to move from tracking metrics to making decisions that improve your bottom line.
























































