
0 ITEMS

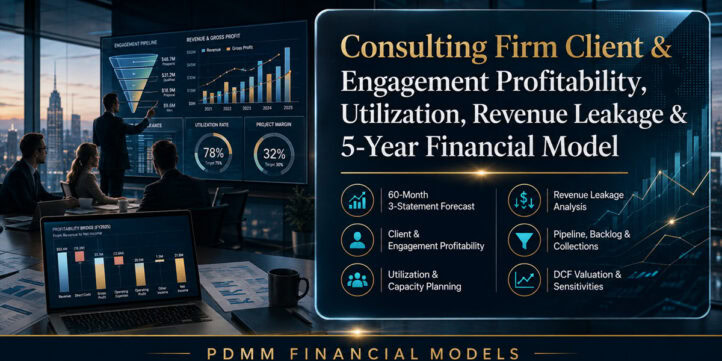
Consulting Firm Client & Engagement Profitability, Utilization, Revenue Leakage & 5-Year Financial Model
Running a consulting firm is not only a revenue-growth problem. The real management challenge is converting pipeline into delivered, billable, collectible work while protecting margin, staffing capacity, and cash. A firm can look busy and still lose value through low utilization, discounting, scope creep, write-downs, slow invoicing, bad debt, excess bench cost, or hiring at the wrong time. This premium Excel model is built as a practical decision system for consulting and professional-services firms. It connects clients, engagements, sales pipeline, staffing, utilization, pricing, revenue leakage, working capital, financing, and valuation to a fully integrated 5-year Profit & Loss, Balance Sheet, and Cash Flow forecast.
💼 Consulting Firm Profitability, Capacity & 5-Year Financial Model
Running a consulting firm is not only a revenue-growth problem. The real management challenge is converting pipeline into delivered, billable, collectible work while protecting margin, staffing capacity, and cash. A firm can look busy and still lose value through low utilization, discounting, scope creep, write-downs, slow invoicing, bad debt, excess bench cost, or hiring at the wrong time.
This premium Excel model is built as a practical decision system for consulting and professional-services firms. It connects clients, engagements, sales pipeline, staffing, utilization, pricing, revenue leakage, working capital, financing, and valuation to a fully integrated 5-year Profit & Loss, Balance Sheet, and Cash Flow forecast.
🎯 Decisions the model helps you make
Use the workbook to evaluate questions such as:
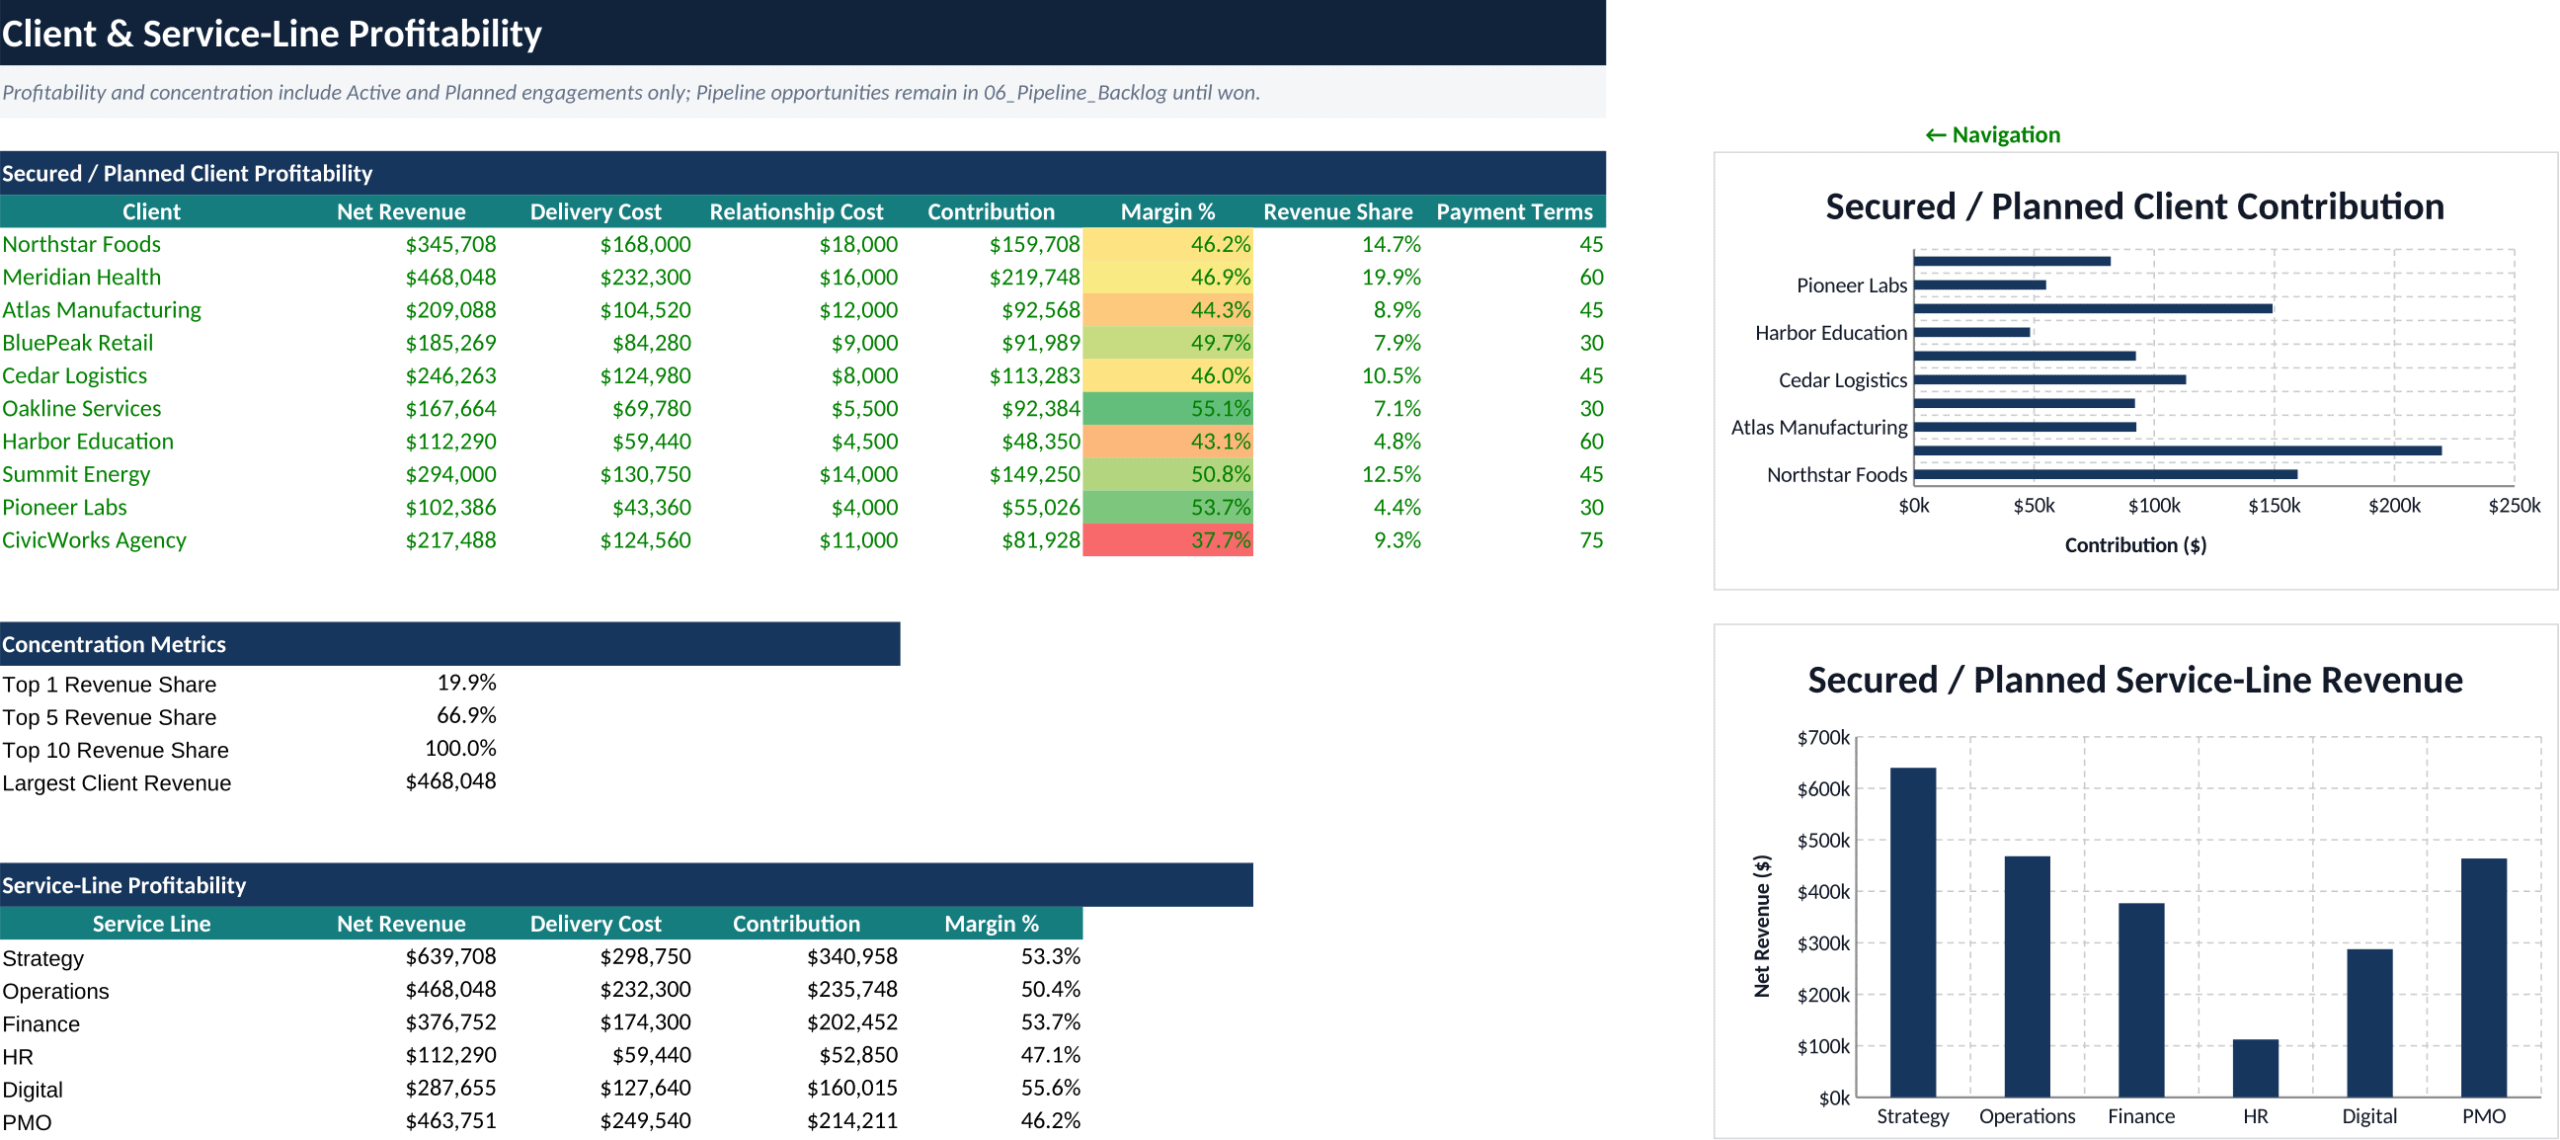
- Which secured or planned clients and engagements create the strongest contribution margin?
- Is the firm carrying unused internal capacity, or is covered demand exceeding delivery capacity?
- When should the firm hire another consultant, manager, or analyst versus using subcontractor overflow?
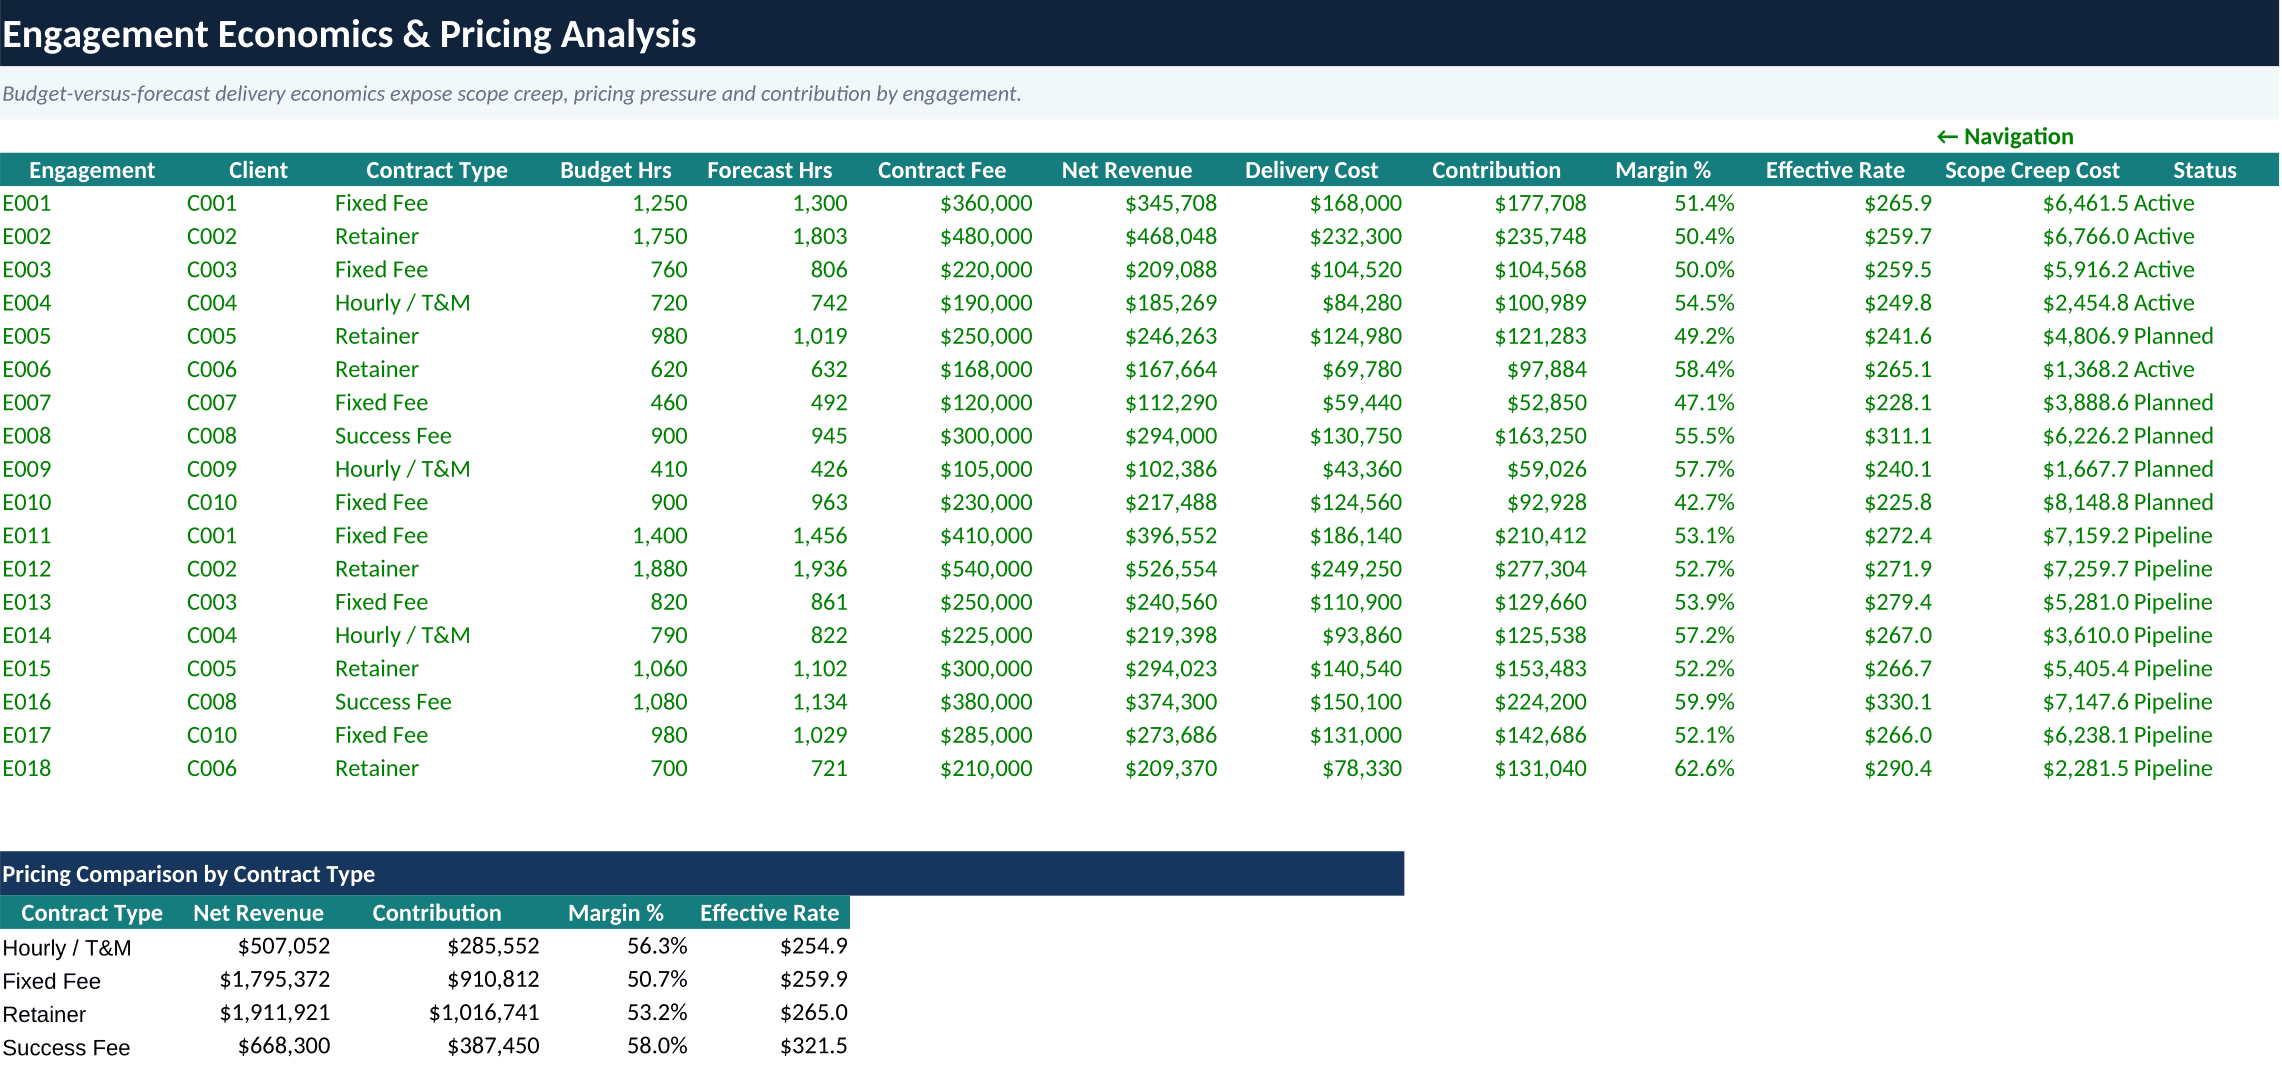
- How do hourly, fixed-fee, retainer, and success-fee engagements compare on effective billing rate and margin?
- How much value is lost through discounts, realization write-downs, credit notes, bad debt, scope creep, and unrecovered expenses?
- What happens to revenue, EBITDA, cash, and valuation if utilization, win rate, DSO, pricing, attrition, or salary inflation changes?
- How much pipeline and backlog support the next stage of growth?
- Can the firm fund capex, debt repayment, taxes, and owner distributions while maintaining liquidity?
🧭 Model workflow
The workbook follows a clear operating-to-financial flow:
Scenario assumptions → client and engagement registers → pipeline and backlog → staffing and capacity → revenue and billing → engagement economics → leakage and profitability → payroll and operating expenses → working capital → capex, financing, and tax → P&L, Balance Sheet, Cash Flow → break-even, sensitivities, valuation, dashboard, and model checks.
Editable hardcoded assumptions are visually distinguished from formulas and linked cells. Fictional sample data is included so the entire model, dashboard, scenario system, sensitivities, and charts are immediately demonstrable and can be replaced with a buyer’s own information.
⚙️ Editable assumptions and operating drivers
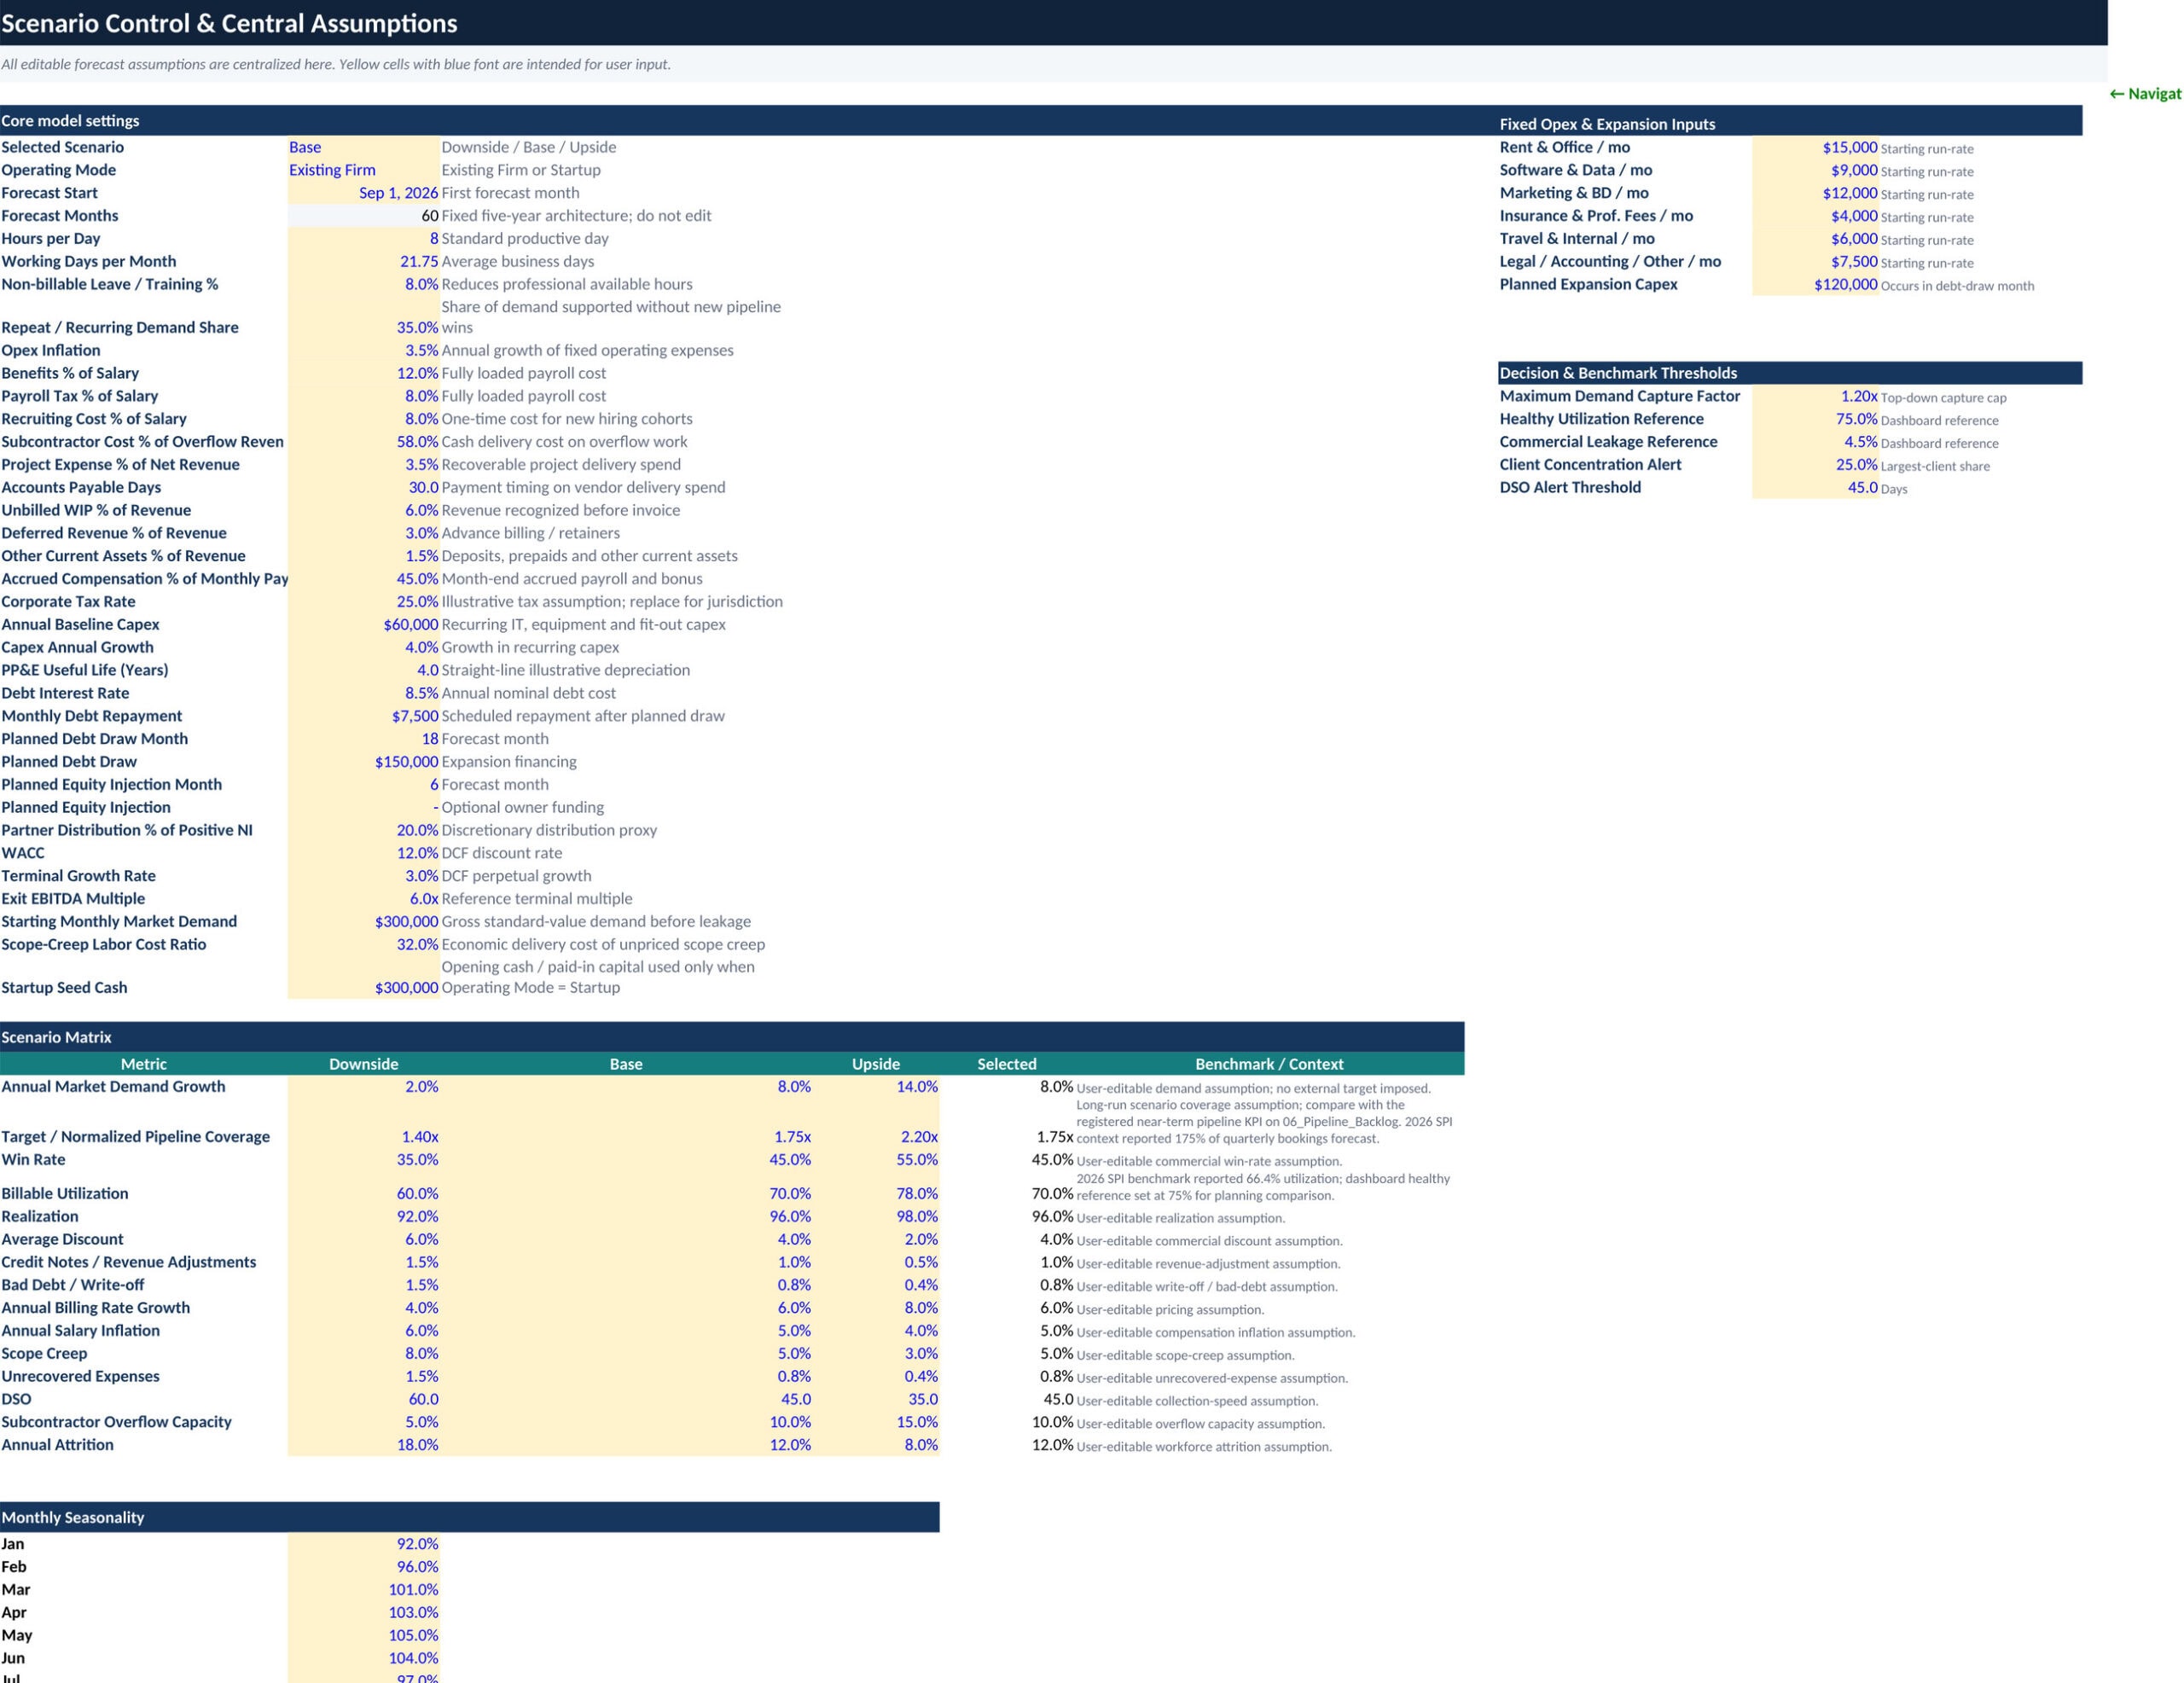
The centralized assumptions area covers the main operating and financial levers, including:
- Downside, Base, and Upside scenario selection
- Existing Firm or Startup operating mode
- Forecast start date and 60-month horizon
- Working days, hours per day, leave/training, and recurring-demand share
- Salary benefits, payroll taxes, recruiting cost, and annual salary inflation
- Utilization, realization, annual attrition, billing-rate growth, and subcontractor overflow capacity
- Average discounts, credit notes, bad debt, scope creep, and unrecovered expenses
- DSO, AR/WIP/AP assumptions, deferred revenue, and accrued compensation
- Fixed operating-expense run rates and inflation
- Recurring capex, expansion capex, useful life, debt draw, interest, repayment, equity injection, and partner distributions
- Corporate tax, WACC, terminal growth, and exit EBITDA multiple
- Decision thresholds for utilization, leakage, concentration, and DSO
📊 Operating schedules and profitability analysis
Client Register stores client segment, service line, preferred contract structure, payment terms, annualized fee, repeat probability, strategic importance, and relationship cost.
Engagement Register supports hourly/time-and-materials, fixed-fee, retainer, and success-fee work. It captures start month, duration, contract fee, budget hours, direct cost, project expense, discounts, scope creep, write-downs, forecast hours, net revenue, delivery cost, contribution, margin, and effective billing rate.
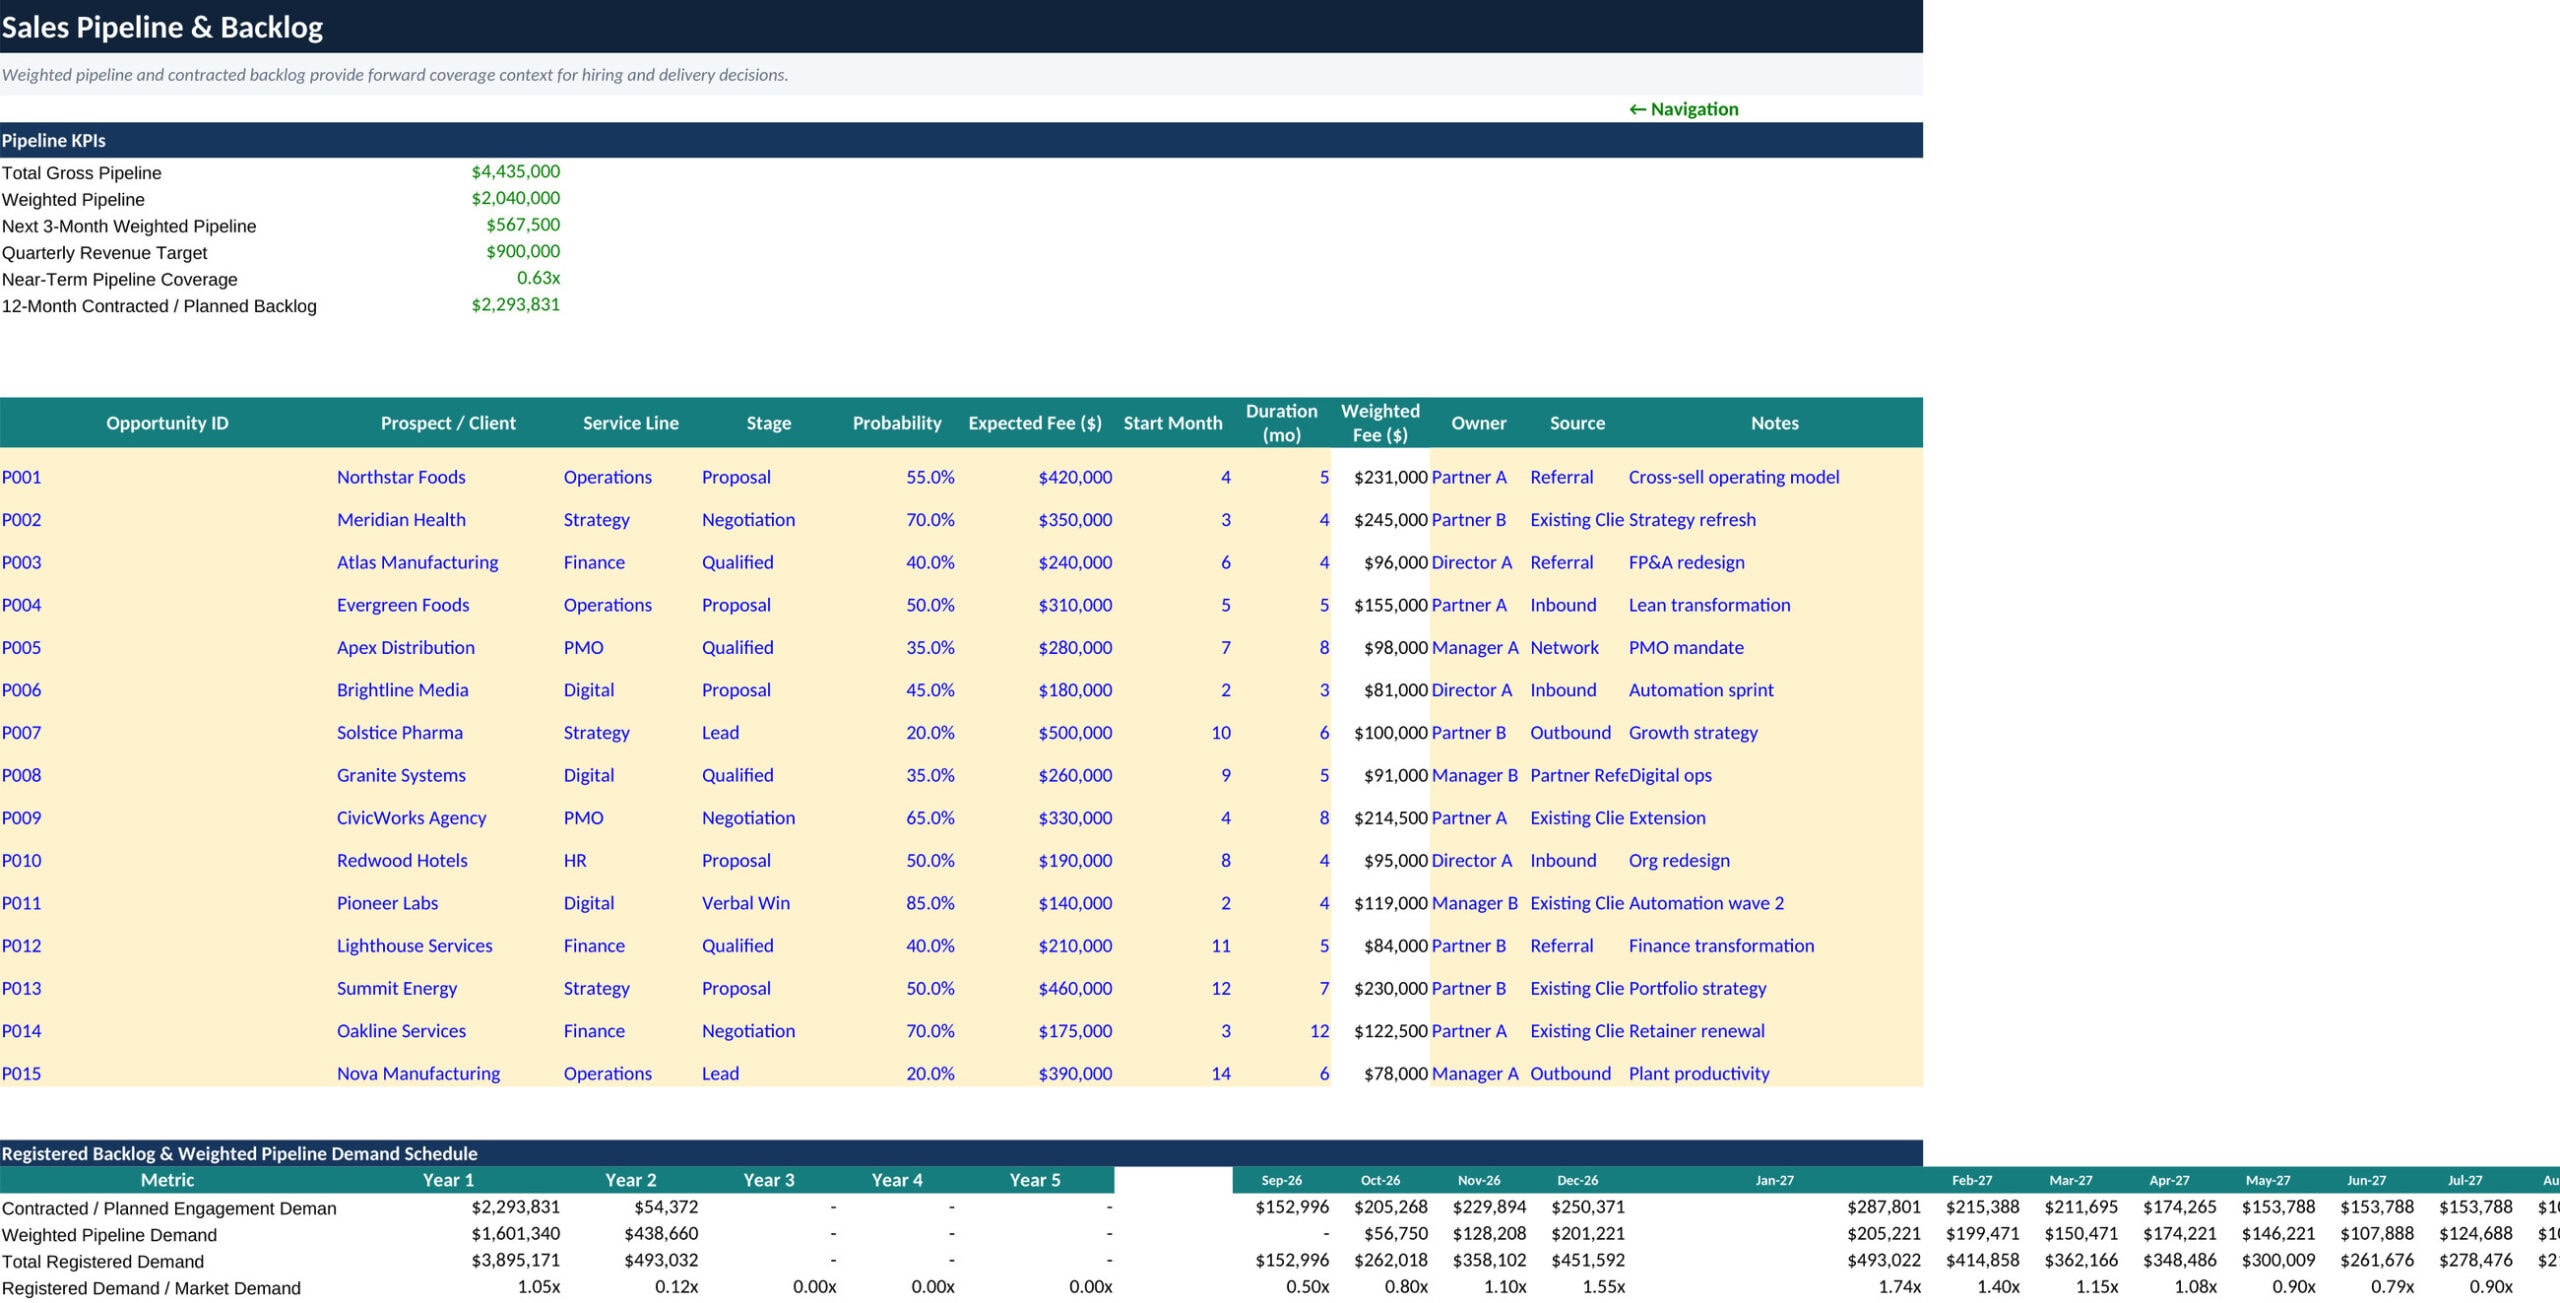
Sales Pipeline & Backlog calculates gross pipeline, weighted pipeline, near-term coverage, contracted/planned backlog, and a monthly registered-demand schedule that feeds the revenue engine.
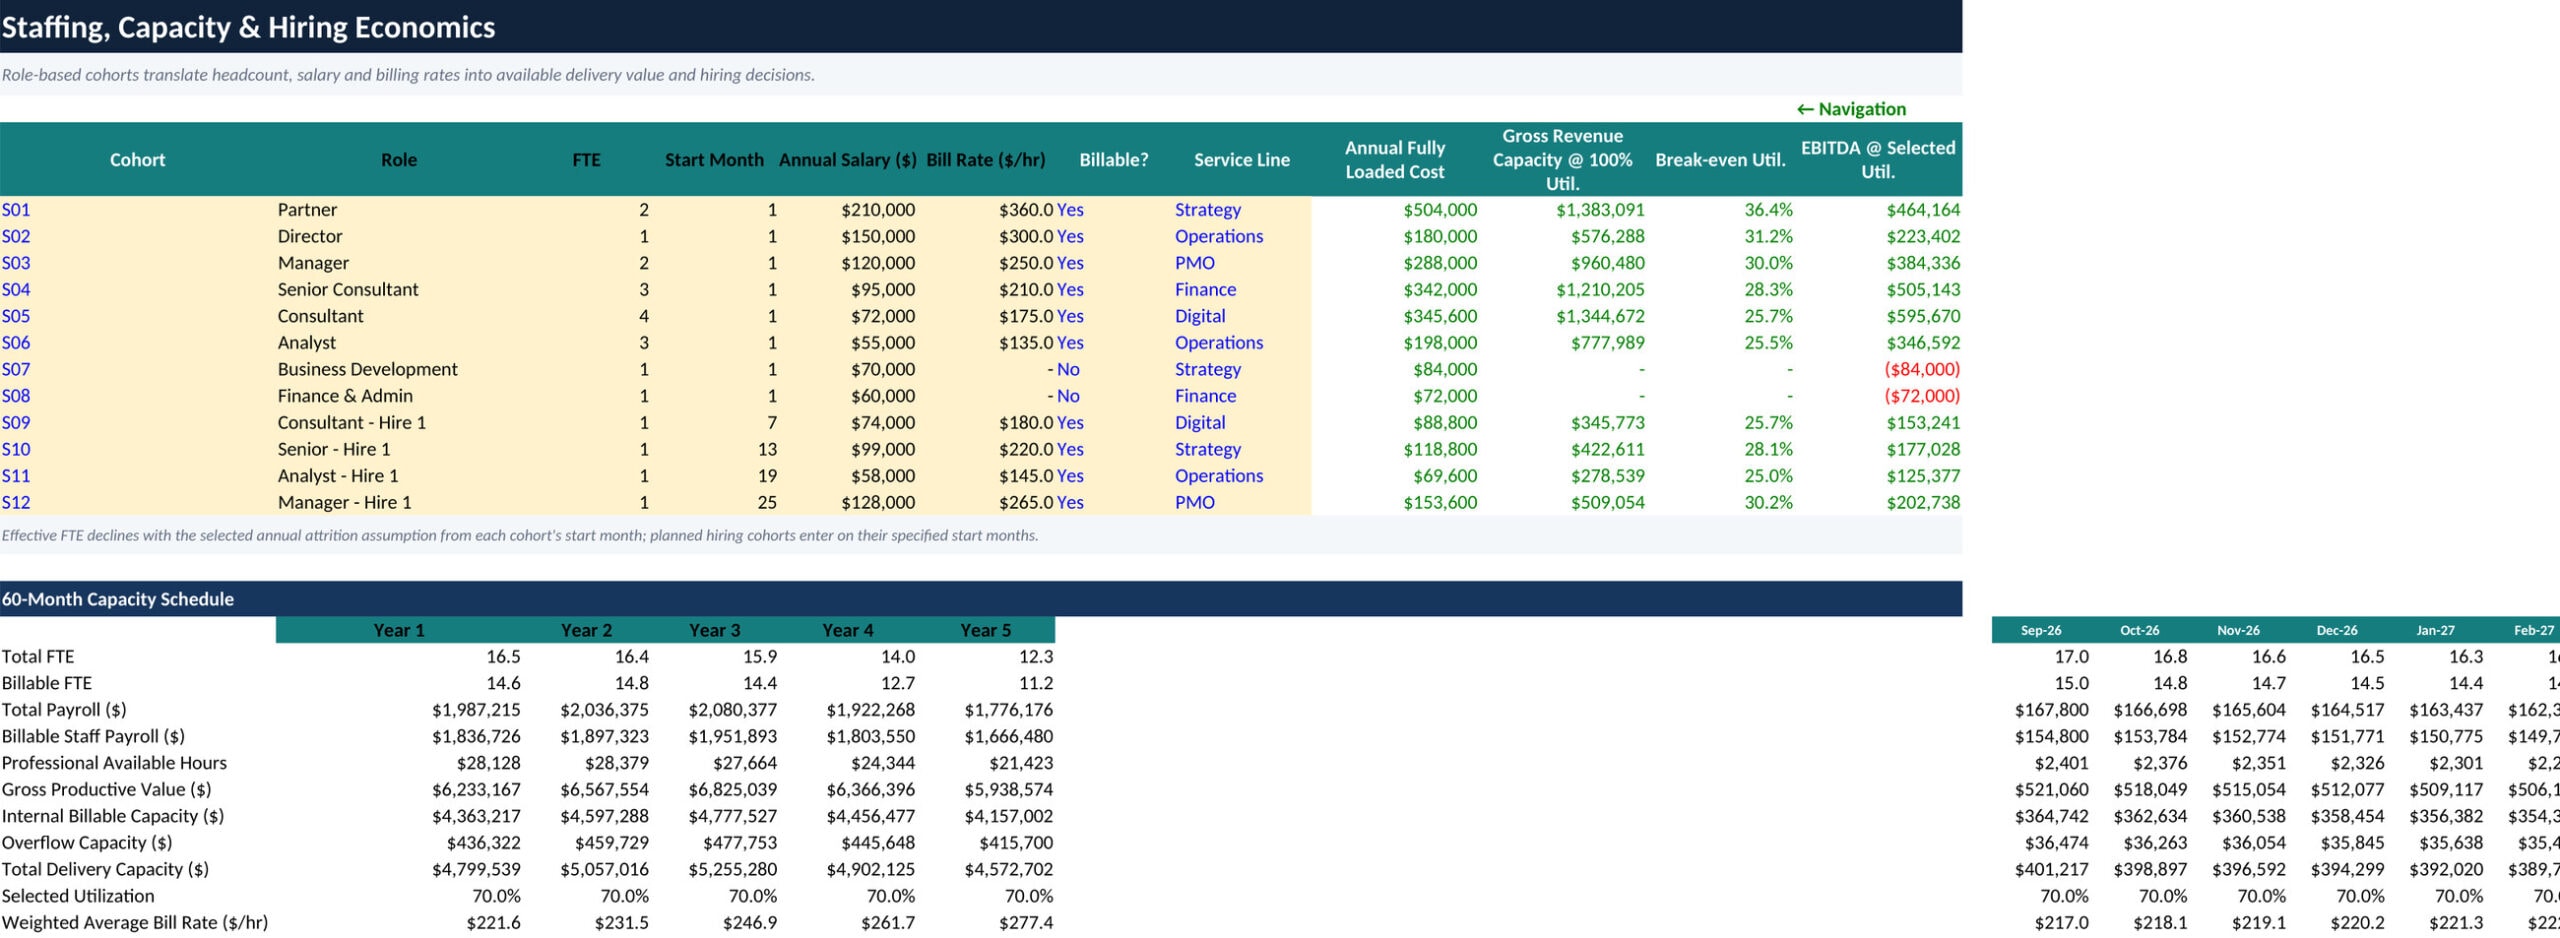
Staffing, Capacity & Hiring Economics models partners, directors/managers, senior consultants, consultants, analysts, business development, administration, and future hiring cohorts. Effective FTE reflects cohort start dates and annual attrition. The schedule calculates payroll, available professional hours, gross productive value, internal billable capacity, overflow capacity, break-even utilization, and hiring economics.
💧 Revenue leakage and cash conversion
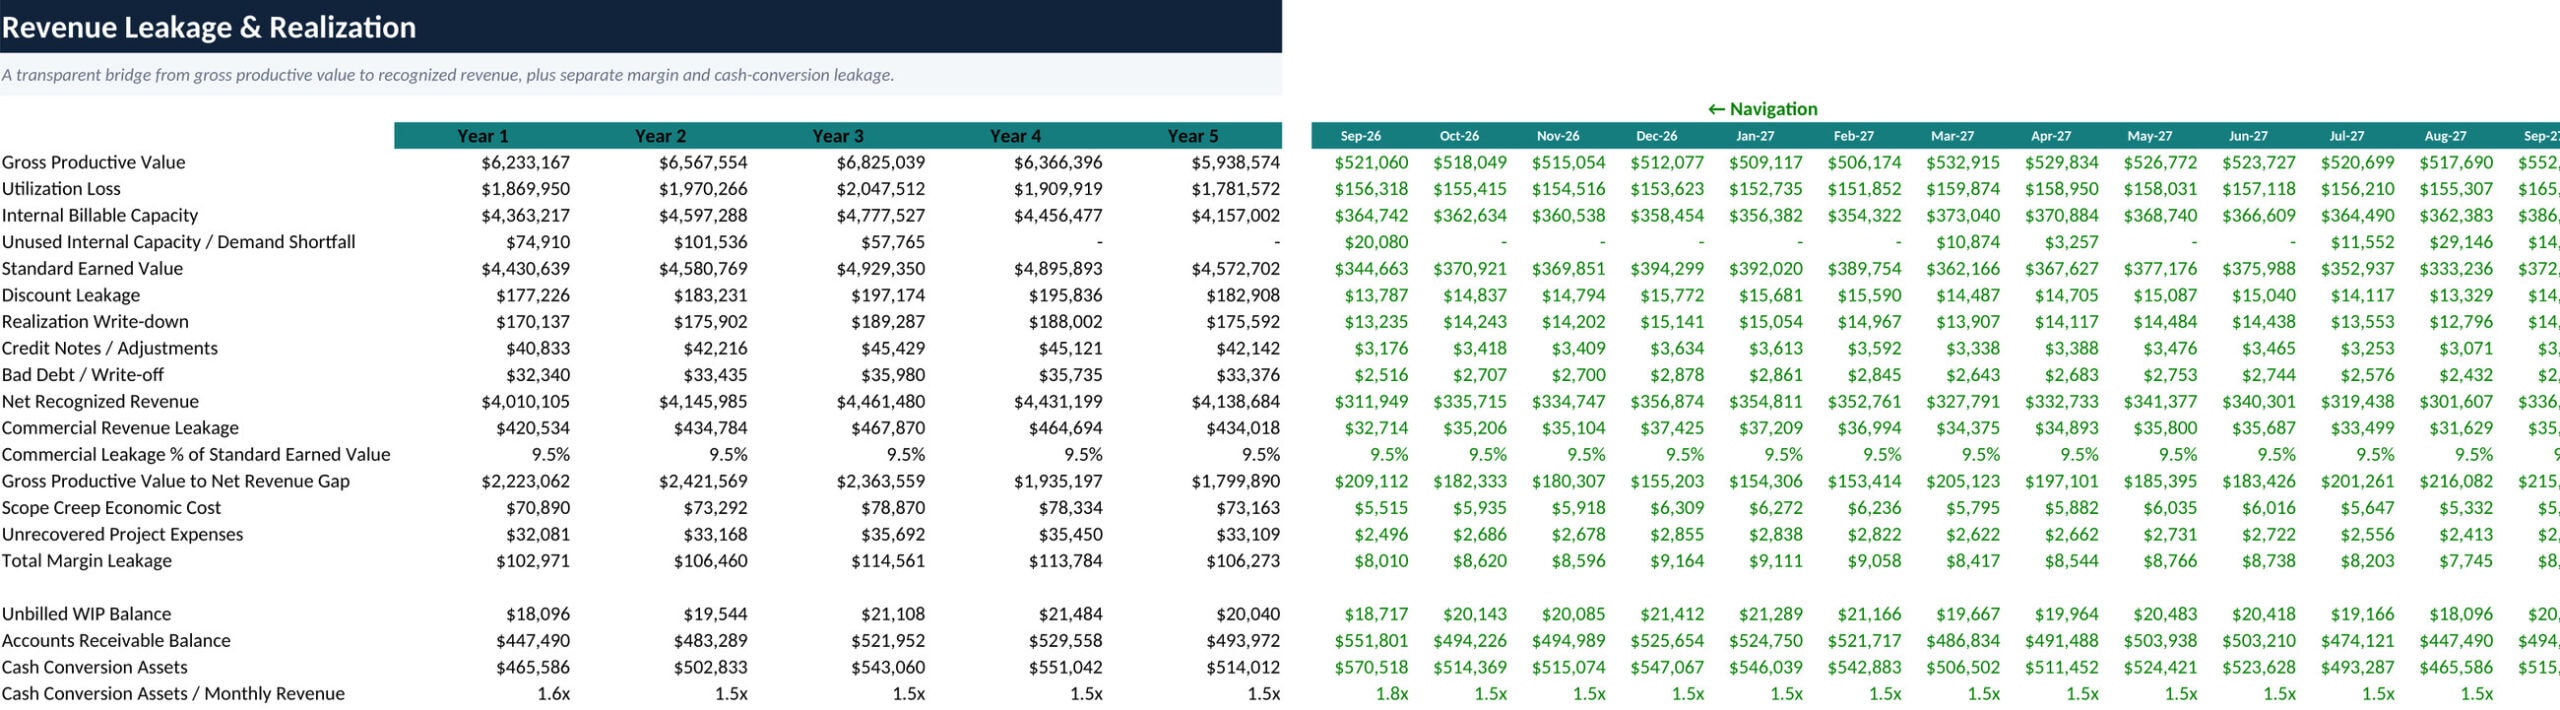
The revenue engine links covered demand to delivery capacity and separates unused internal capacity from unserved demand caused by capacity constraints. It then bridges standard earned value through discount leakage, realization, credit notes, and bad debt to net recognized revenue.
The dedicated leakage schedule also quantifies utilization loss, scope-creep economic cost, unrecovered project expenses, commercial leakage percentage, AR, unbilled WIP, and cash-conversion assets.
Working capital distinguishes accounting revenue from invoicing and actual cash receipt timing using AR, DSO, unbilled WIP, AP, accrued compensation, deferred revenue, and customer cash receipts.
🧾 Integrated financial statements
The model includes monthly and annual summaries for:
- Profit & Loss: revenue, direct labor, subcontractors, project expenses, gross profit, operating expenses, EBITDA, depreciation, EBIT, interest, tax, and net income.
- Balance Sheet: cash, AR, WIP, other current assets, PP&E, AP, accruals, deferred revenue, debt, paid-in capital, retained earnings, and balance checks.
- Cash Flow: operating cash flow, capex, debt draws and repayments, equity contributions, partner distributions, net cash movement, and ending cash.
Capex and depreciation are modeled by useful life, while debt, interest, tax, equity funding, and partner distributions flow into the statements without circularity.
🔄 Scenarios, break-even and sensitivities
One selector switches the model across Downside, Base, and Upside assumptions for market growth, normalized pipeline coverage, win rate, utilization, realization, discounts, credit adjustments, bad debt, billing-rate growth, salary inflation, scope creep, unrecovered expenses, DSO, subcontractor capacity, and attrition.
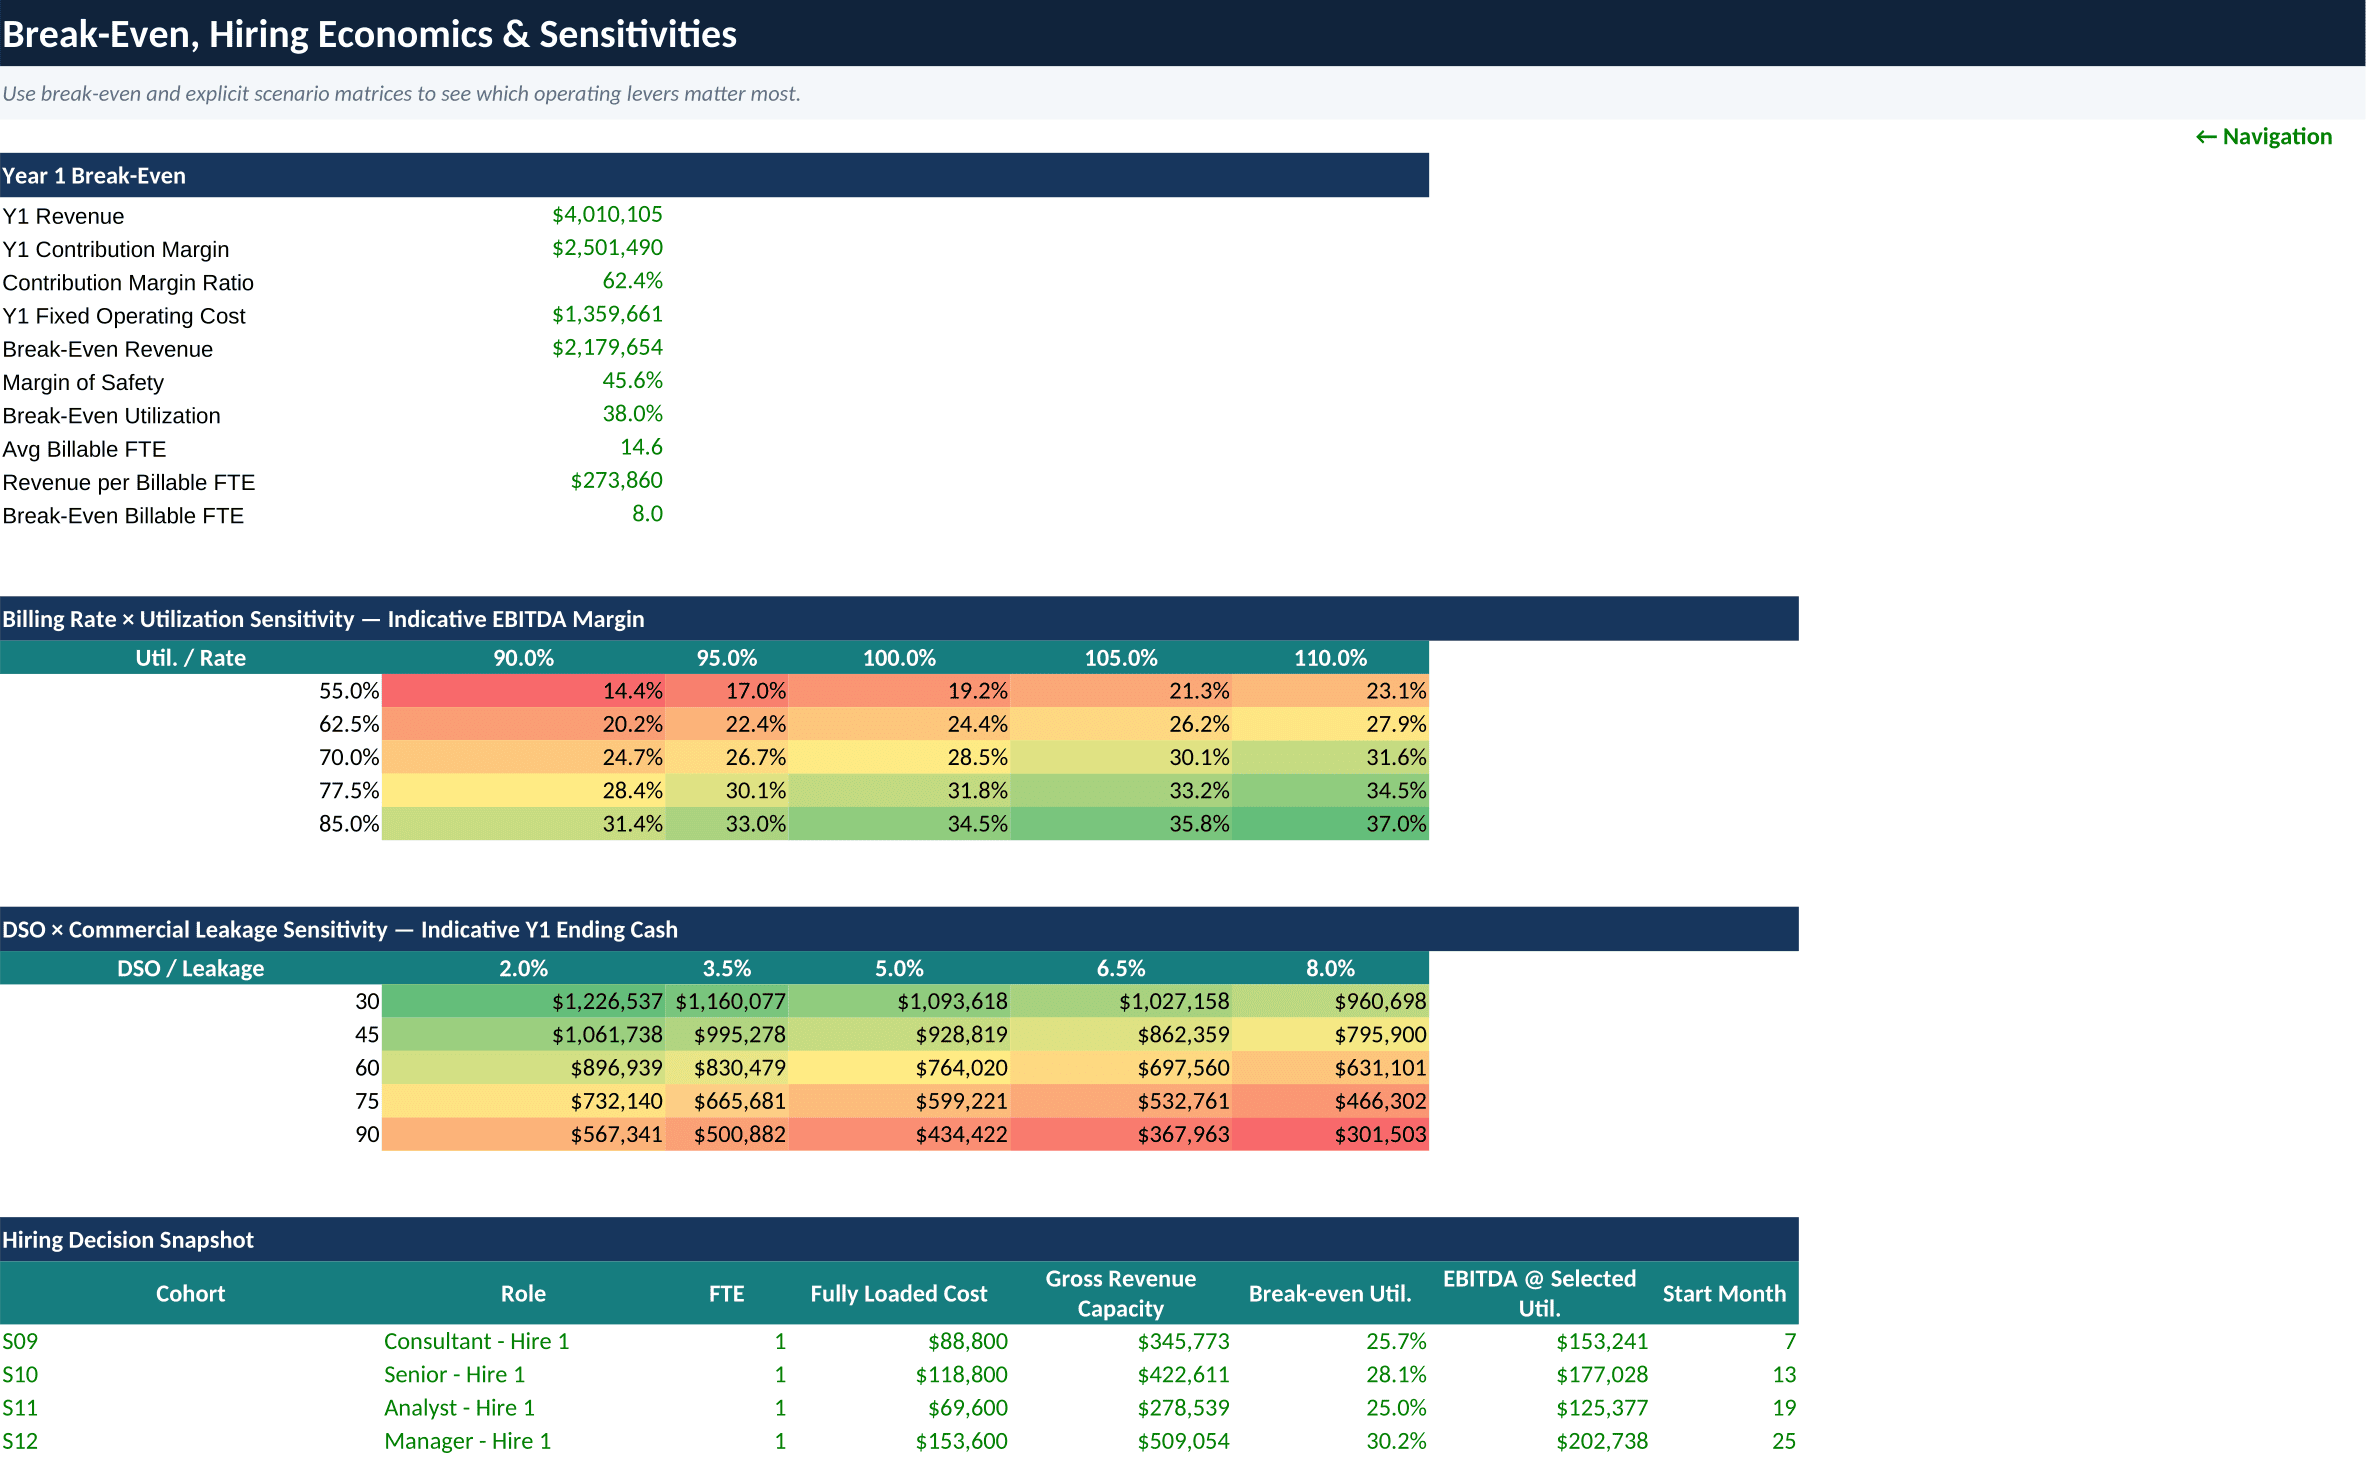
The analysis section includes break-even revenue, contribution margin, margin of safety, break-even utilization, revenue per billable FTE, and break-even billable headcount. Two-dimensional sensitivity tables test billing rate versus utilization and DSO versus commercial revenue leakage, alongside a planned-hire economics snapshot.
📈 Valuation and executive dashboard
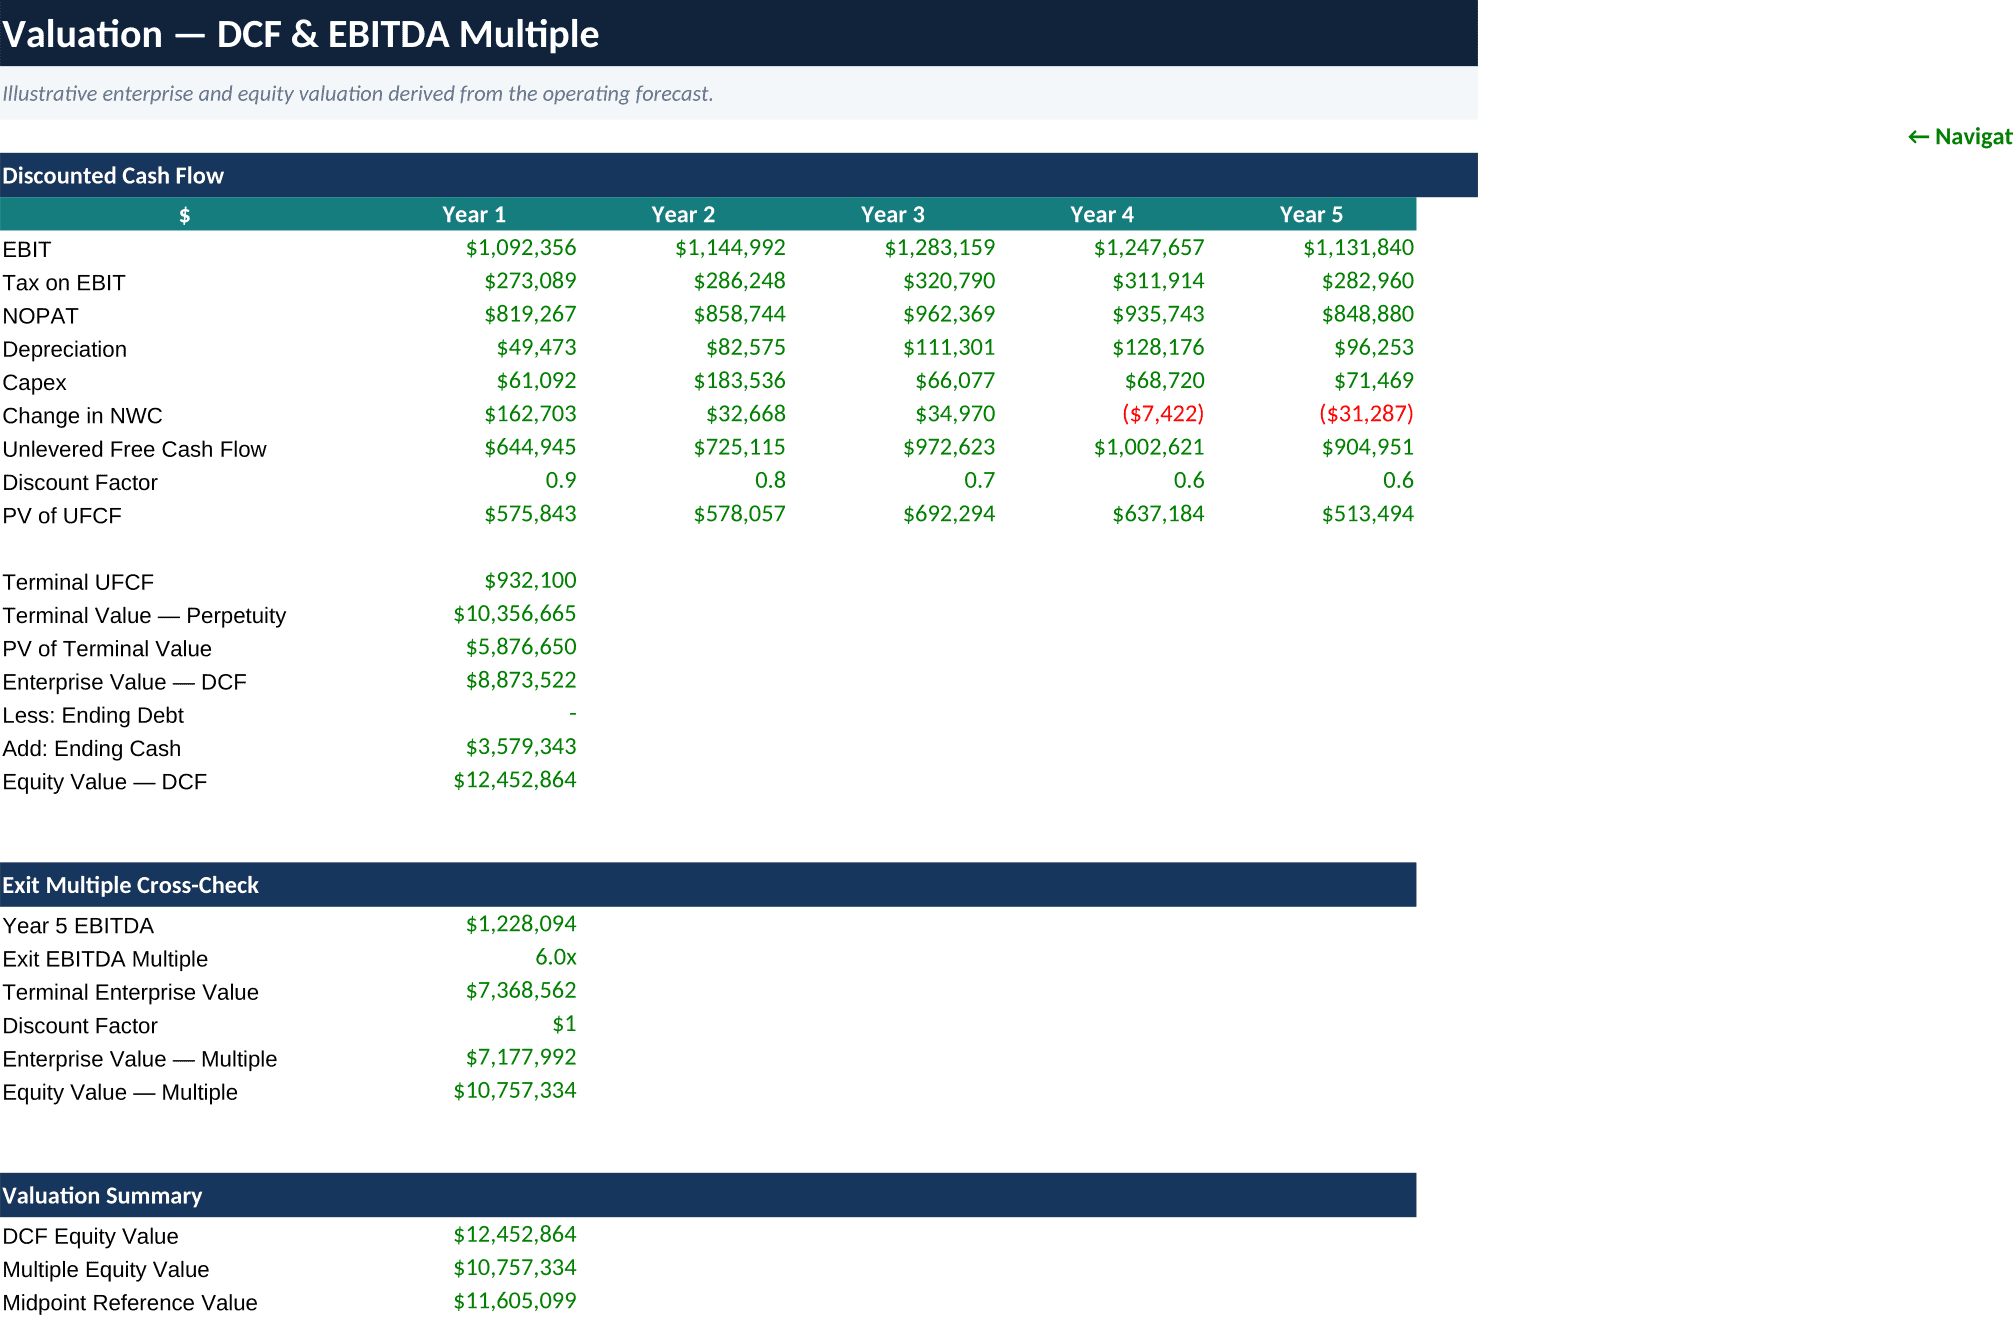
Valuation includes a DCF using unlevered free cash flow and an EBITDA-multiple cross-check, with enterprise and equity value outputs.
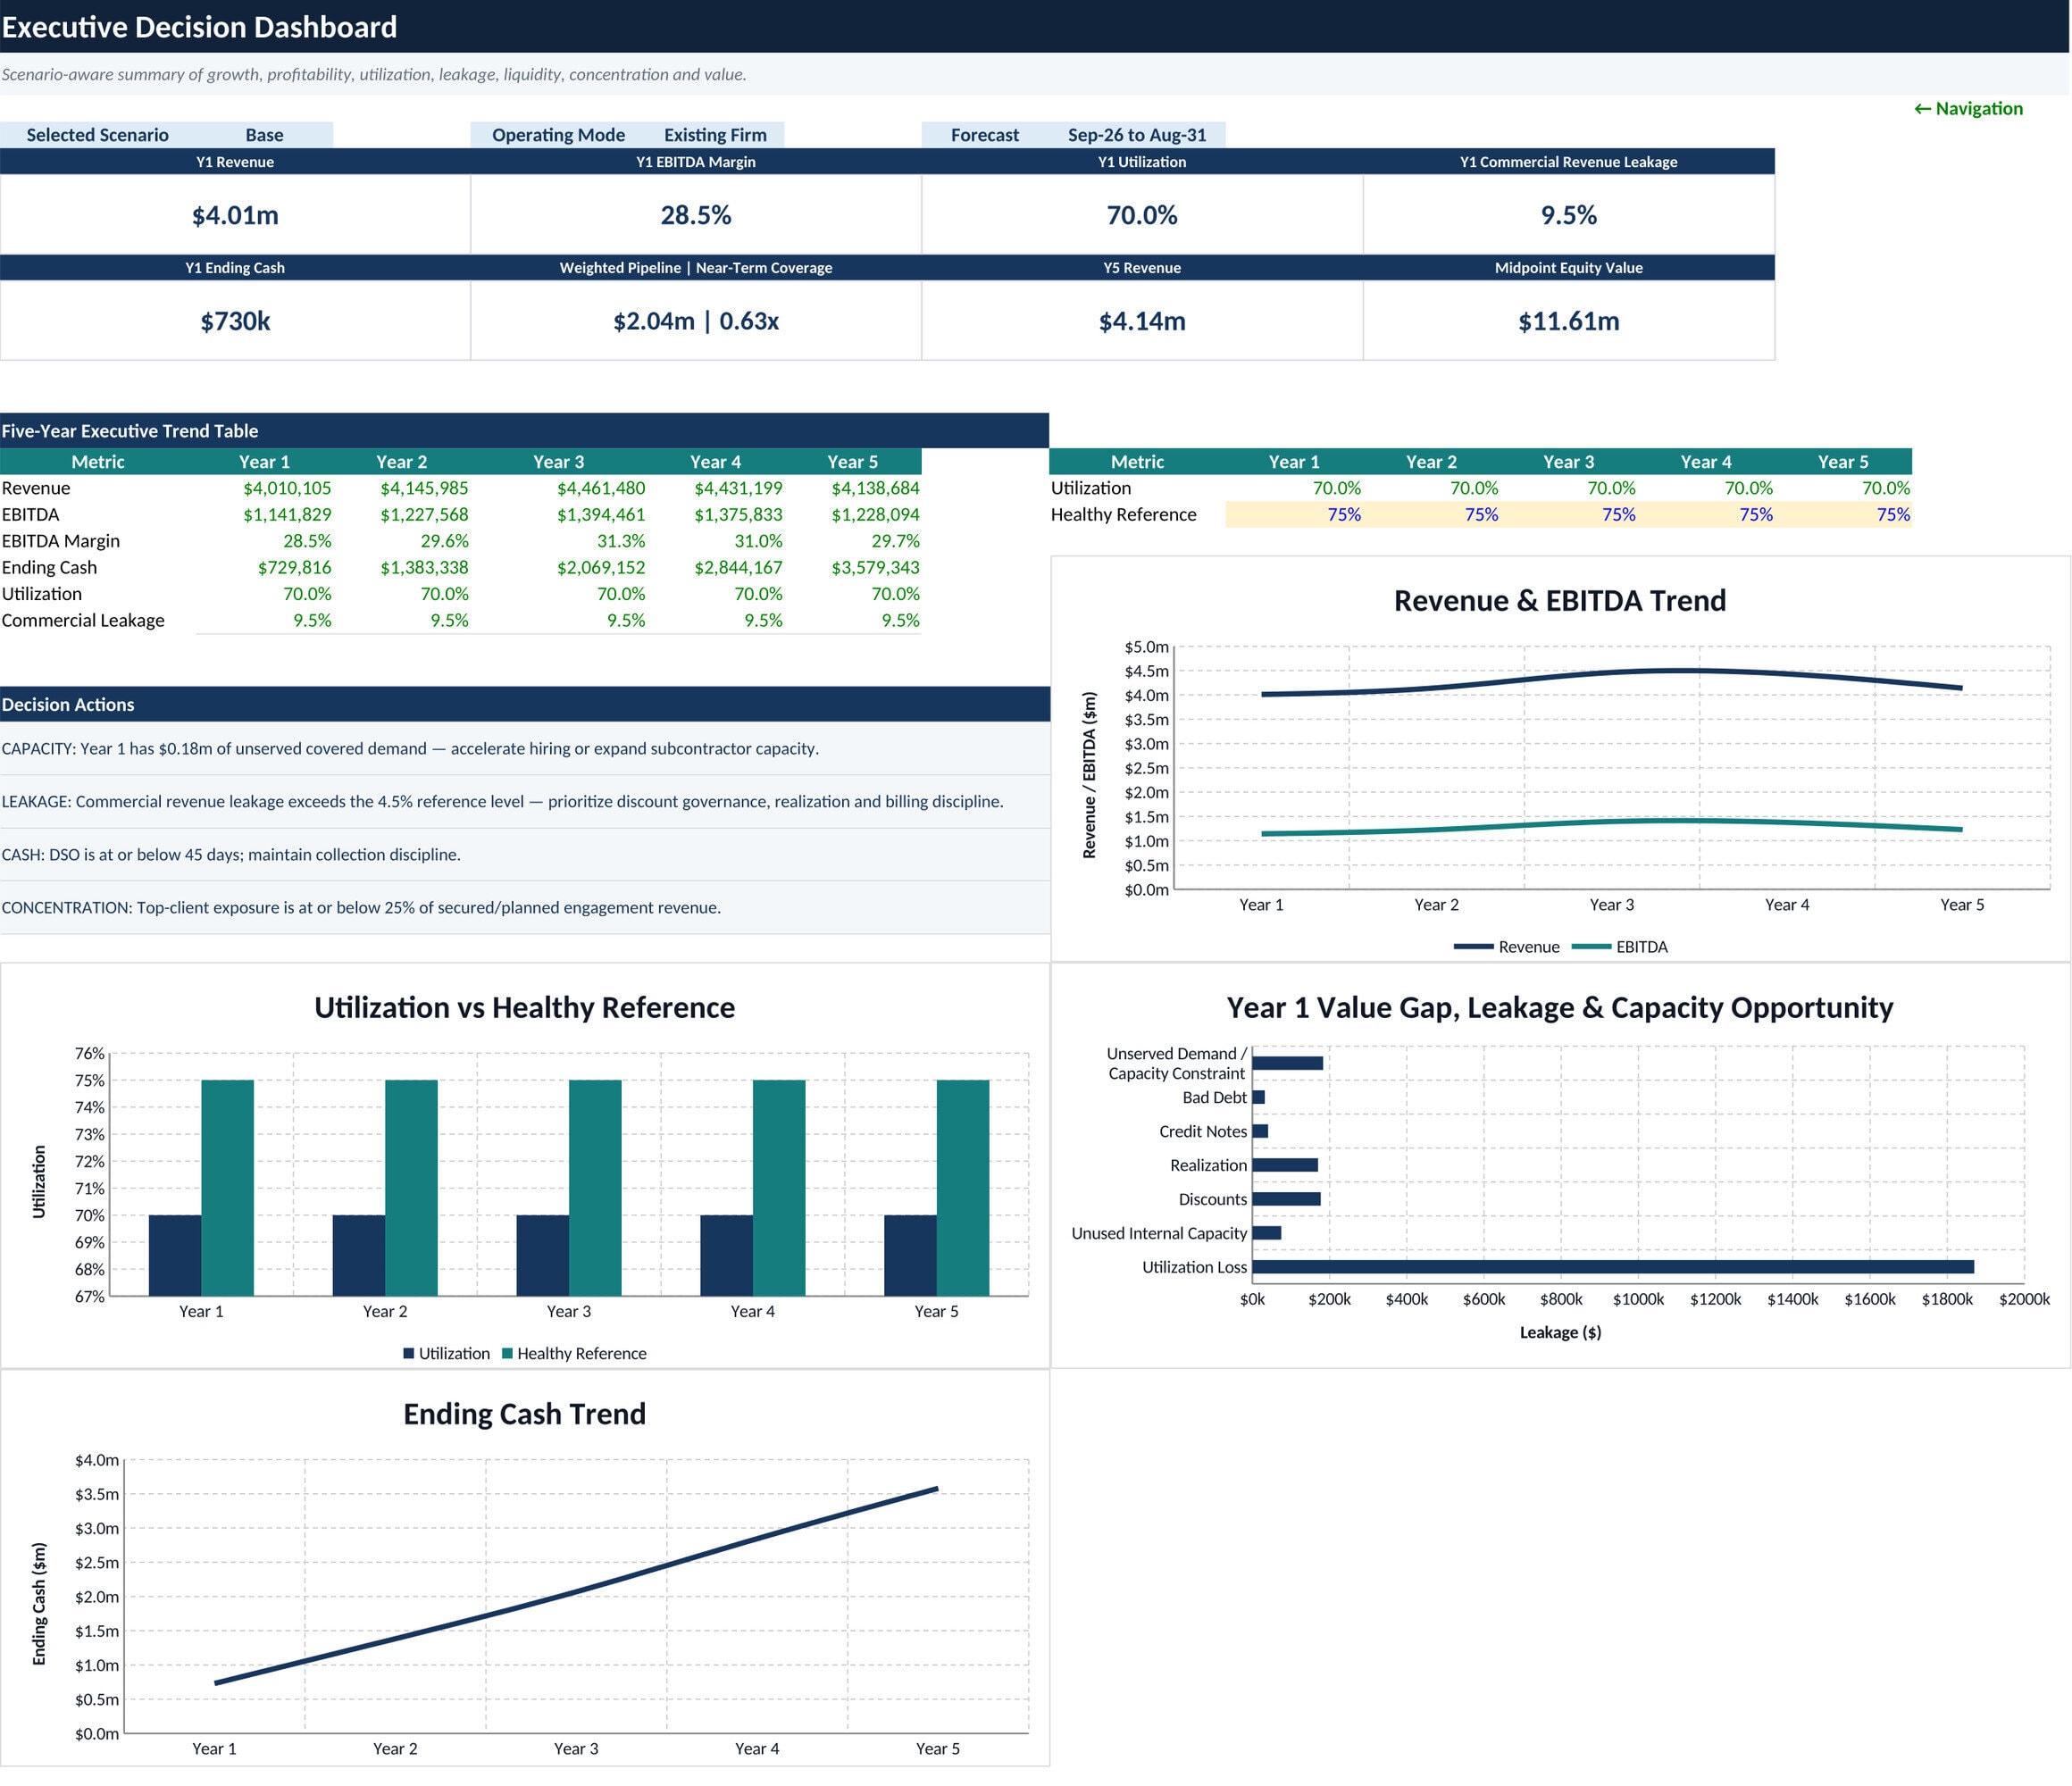
The executive dashboard brings together revenue, EBITDA margin, utilization, commercial leakage, ending cash, weighted pipeline/near-term coverage, Year-5 revenue, and reference equity value. Native Excel charts show revenue and EBITDA trends, utilization versus a healthy reference, value-gap/leakage/capacity drivers, and ending cash. Action messages highlight capacity, leakage, collections, and client concentration.
✅ Model controls and checks
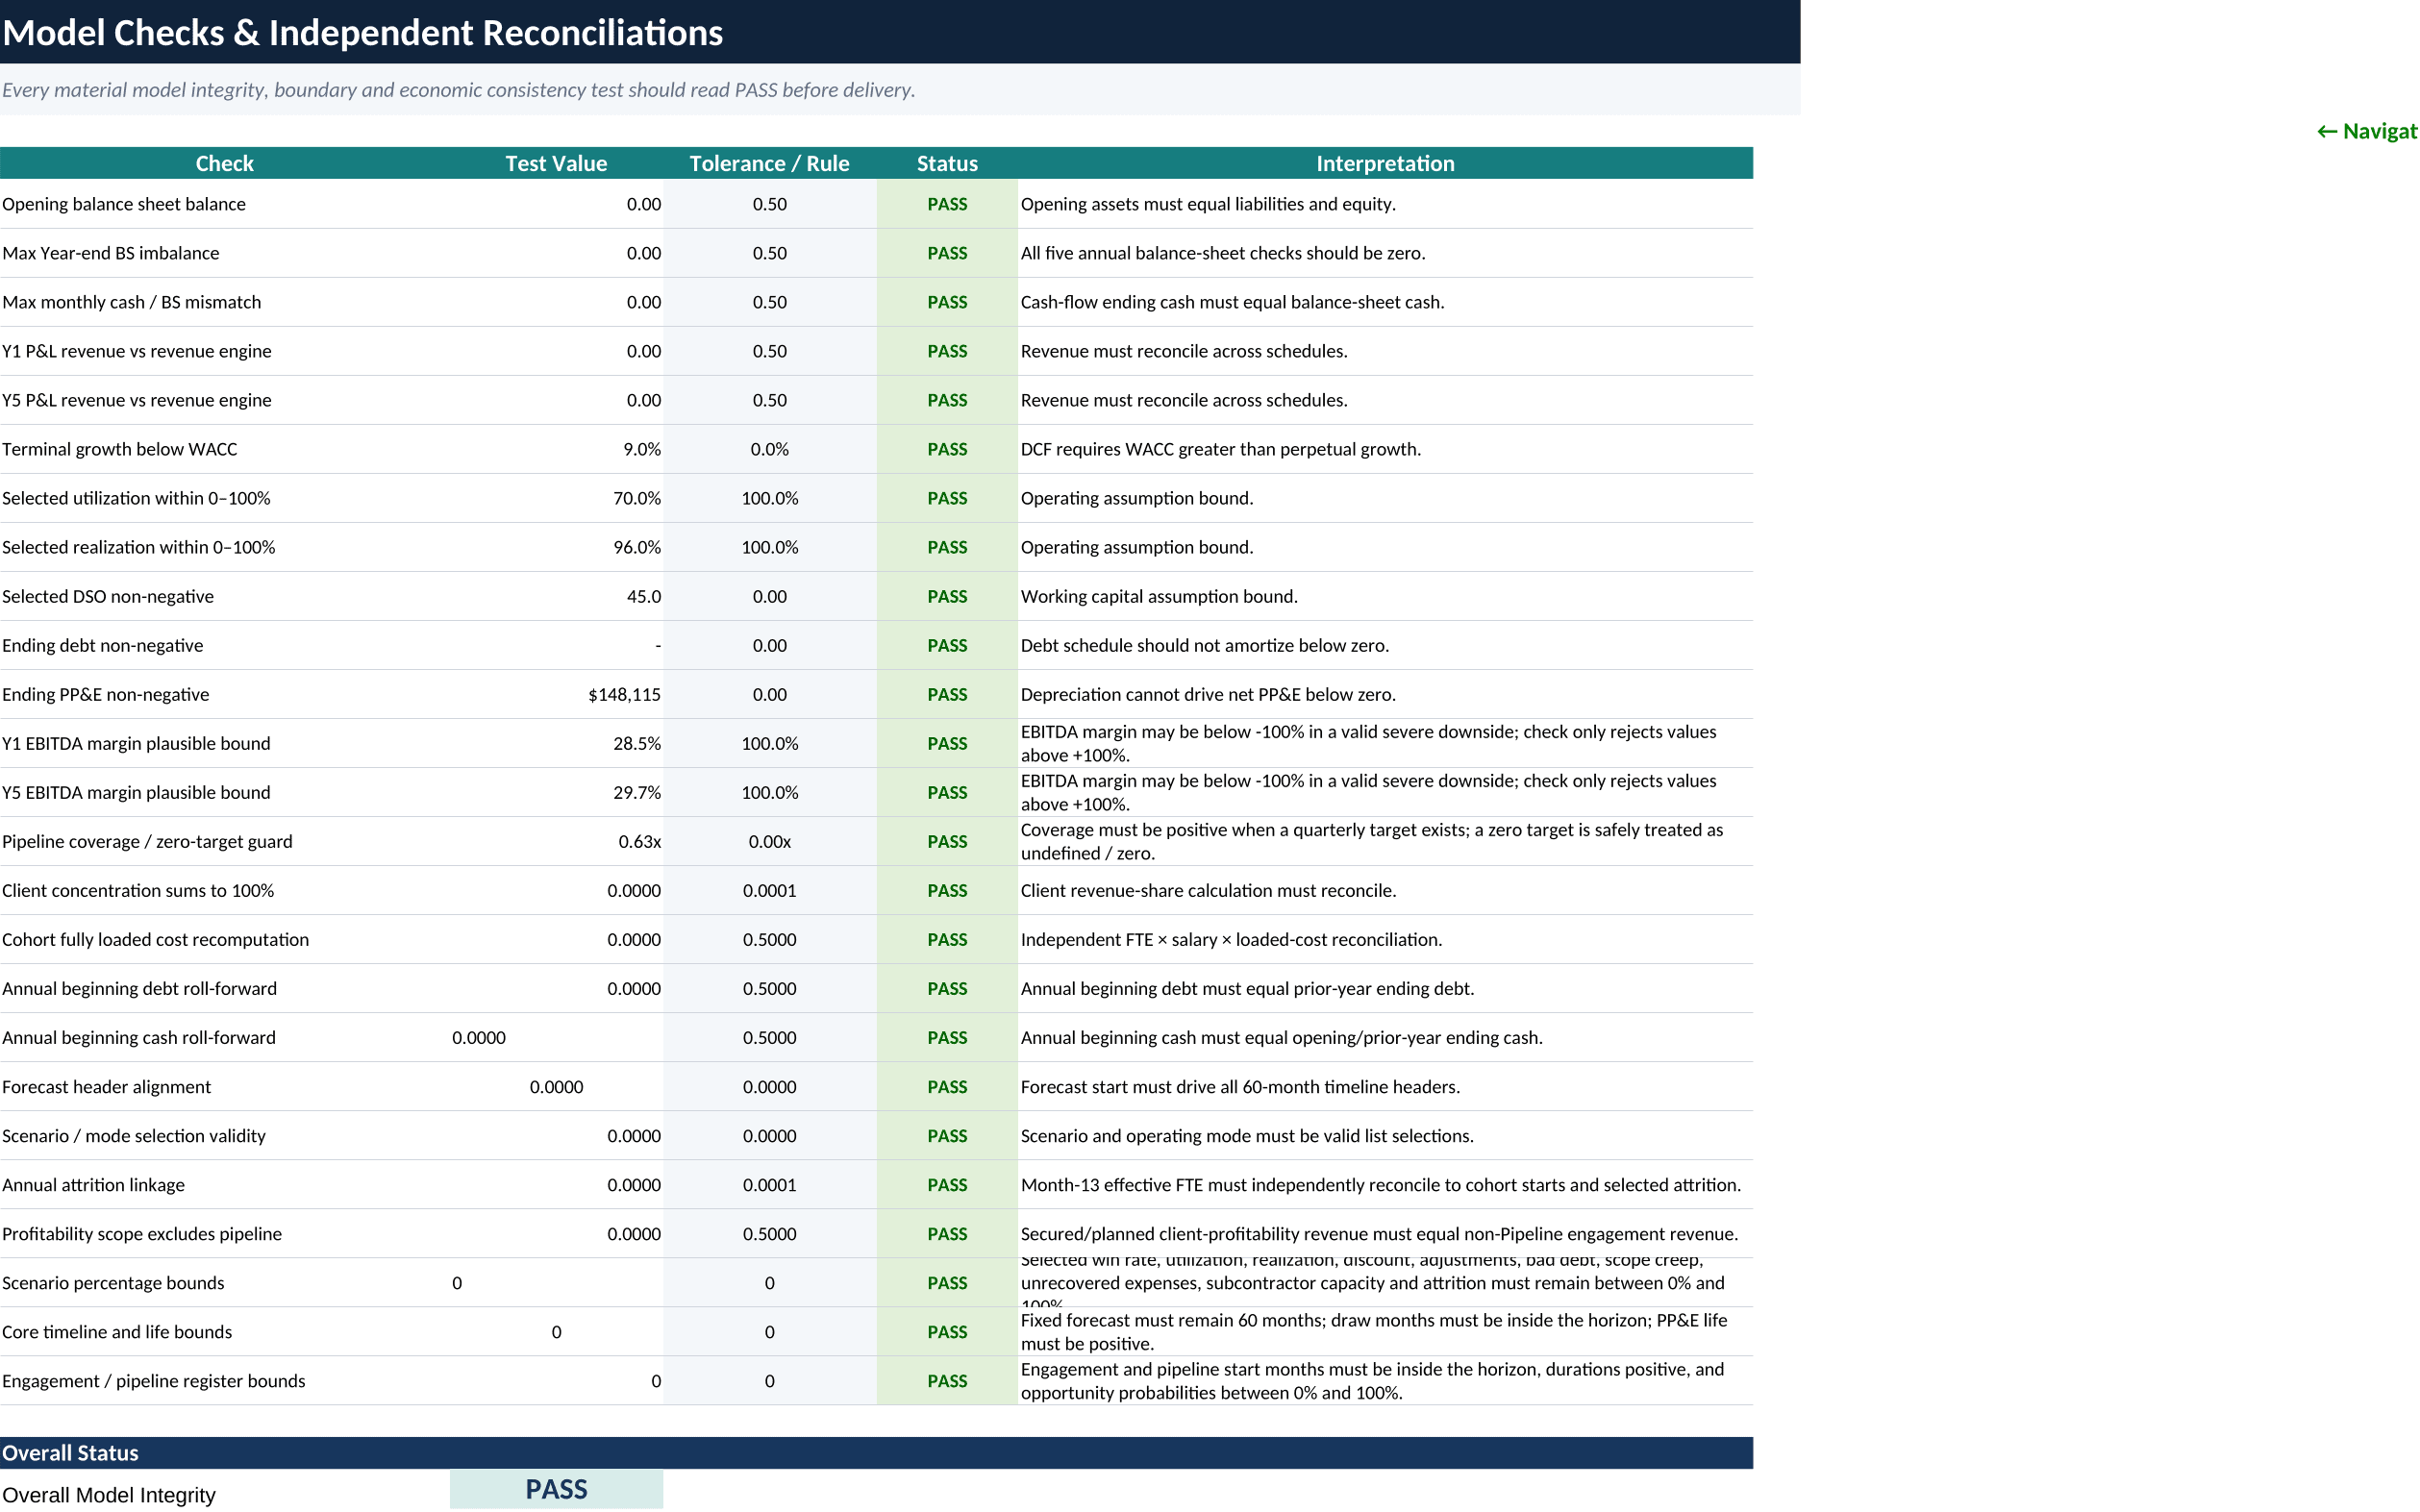
The workbook contains dedicated integrity checks for balance-sheet balance, cash reconciliation, revenue reconciliation, WACC/terminal-growth logic, scenario bounds, debt and PP&E roll-forwards, beginning cash/debt, forecast-header alignment, attrition linkage, profitability scope, and register boundaries. A methodology and sources sheet documents how the schedules work and provides the benchmark-source references used inside the model.
👥 Intended users
This model is designed for boutique consulting firms, independent consultants scaling into teams, managing partners, practice managers, finance leaders, controllers, advisers, and professional-services operators who need more than a generic business-plan forecast.
It is especially useful when the key question is not simply “How much revenue can we grow?” but “Can we deliver that work profitably, collect it on time, hire at the right pace, and convert growth into cash and business value?”
📦 Delivered files
- Editable premium Excel financial and operating model
- 60-month forecast with Year 1-Year 5 summaries
- 24-sheet buyer-facing PDF preview
- Buyer-facing screenshot set for reviewing the model before purchase
Similar ProductsOther customers were also interested in...



 eFinancialModels
Electric Vehicle (EV) Charging Station Financial M...
With this comprehensive 5- or 10-year monthly tool, investors can assess the viability of setting up... Read more

Financial Model for Mobile App | Mobile App Busine...
The Mobile App Financial Plan Template in Excel allows you to develop financial projections when lau... Read more

 HenrySheykin
Food Truck Financial Model Excel Template
The Food Truck Financial Model helps entrepreneurs, founders, business owners, consultants, and anal... Read more

Green Hydrogen Production from Wind Energy Financi...
The Green Hydrogen from Wind Financial Model aims to comprehensively forecast a horizon of 40 years ... Read more

Simple Mutual Non-Disclosure Agreement Template
Protect your business secrets with ease using our Simple Mutual Non-Disclosure Agreement Template. S... Read more

Solar Energy Financial Model
The Solar Energy Financial Model Spreadsheet Template in Excel assists you in preparing a sophistica... Read more

 Peter Graf
The Customer-Centric Financial Model for Restauran...
Starting a restaurant without a financial plan is like driving a car blindfolded. You wouldn´t do i... Read more
You must log in to submit a review.