
0 ITEMS

UK Build-to-Rent: £5.3bn Record and What Comes Next

The UK’s institutional rental housing market just posted its strongest investment year on record — and the forces shaping the next five years are more complex than the headline number suggests.
Key Takeaways
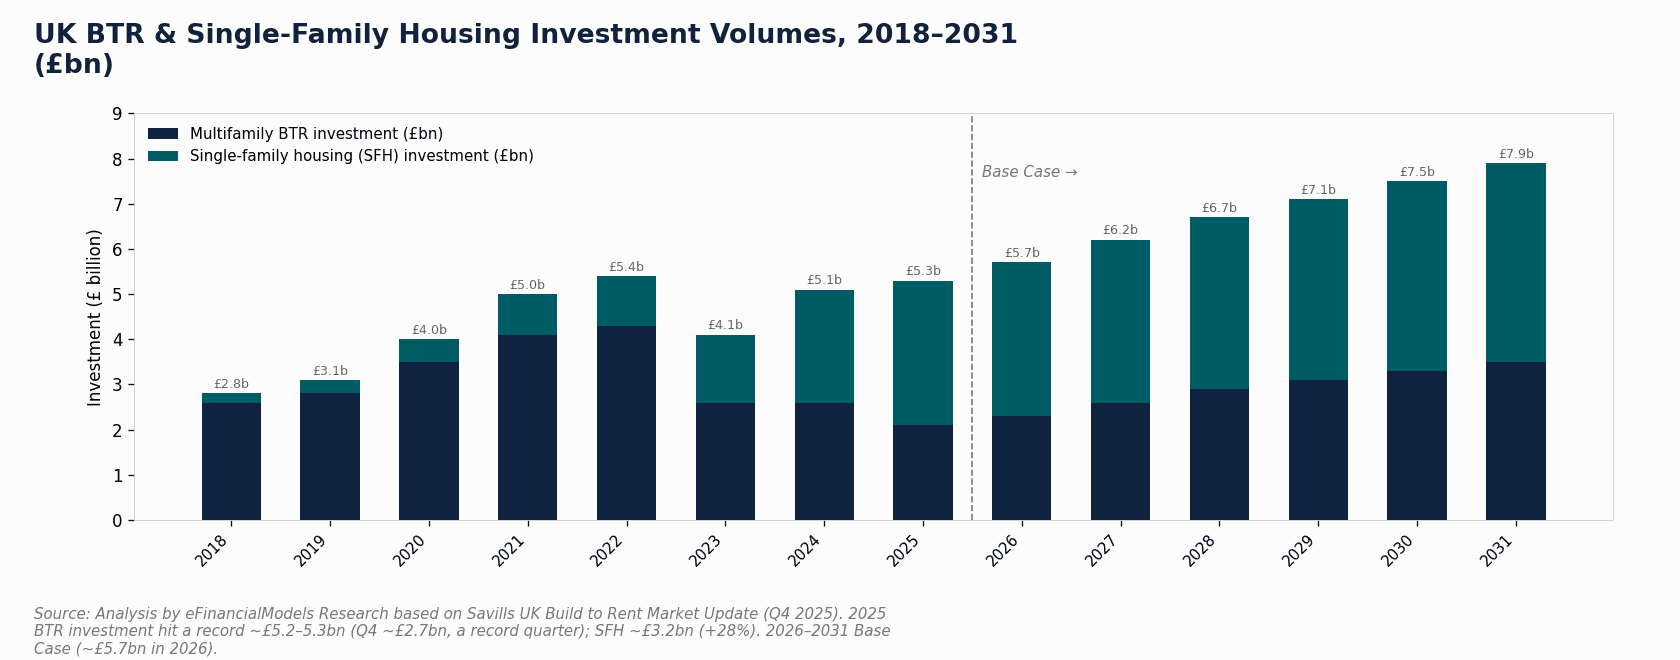
- BTR investment reached a record ~£5.2–5.3 billion in 2025, with Q4 alone delivering £2.7 billion — the strongest single quarter ever recorded.
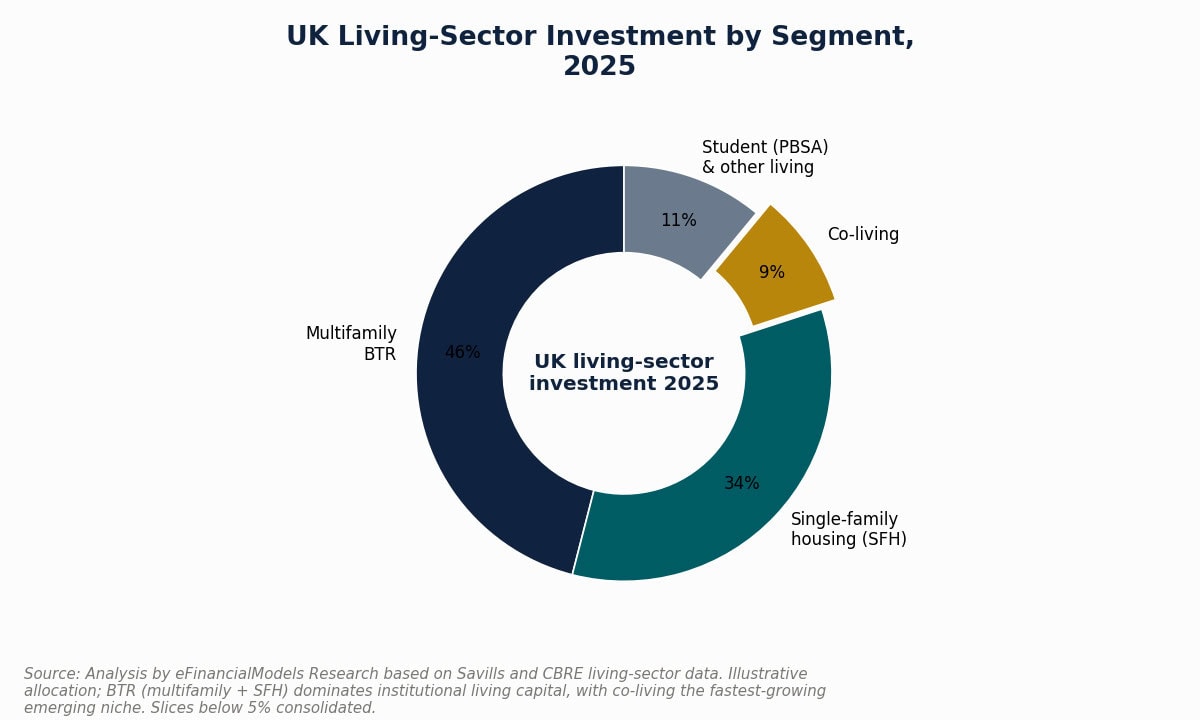
- Single-family housing (SFH) attracted ~£3.2 billion of that total, up 28% year-on-year, making it the standout sub-sector.
- London BTR starts fell roughly 93% between 2022 and 2025; 23 of 32 boroughs recorded zero new starts in 2025.
- Institutional BTR represents only about 3% of England’s 4.6 million private rented sector (PRS) households, leaving a long structural runway for growth.
- Knight Frank forecasts UK rents to rise ~3.7% in 2026 and approximately 18.8% cumulatively over five years, led by regional cities.
- The Renters’ Rights Act 2025 abolished Section 21 ‘no-fault’ evictions from 1 May 2026, reshaping operating models across the entire PRS.
- Co-living has roughly 9,000 operational units today and a pipeline exceeding 31,000, making it the fastest-growing niche in the living sectors.
What Is UK Build-to-Rent and Why Does It Matter Now?
Build-to-Rent (BTR) refers to purpose-built, professionally managed rental housing — typically multifamily apartment blocks of 50 or more units, or suburban single-family rental communities — designed from the ground up to be rented rather than sold. The wider Private Rented Sector (PRS) covers all privately rented homes in England, including individual buy-to-let landlords; institutional BTR is a professionally managed subset of that market.
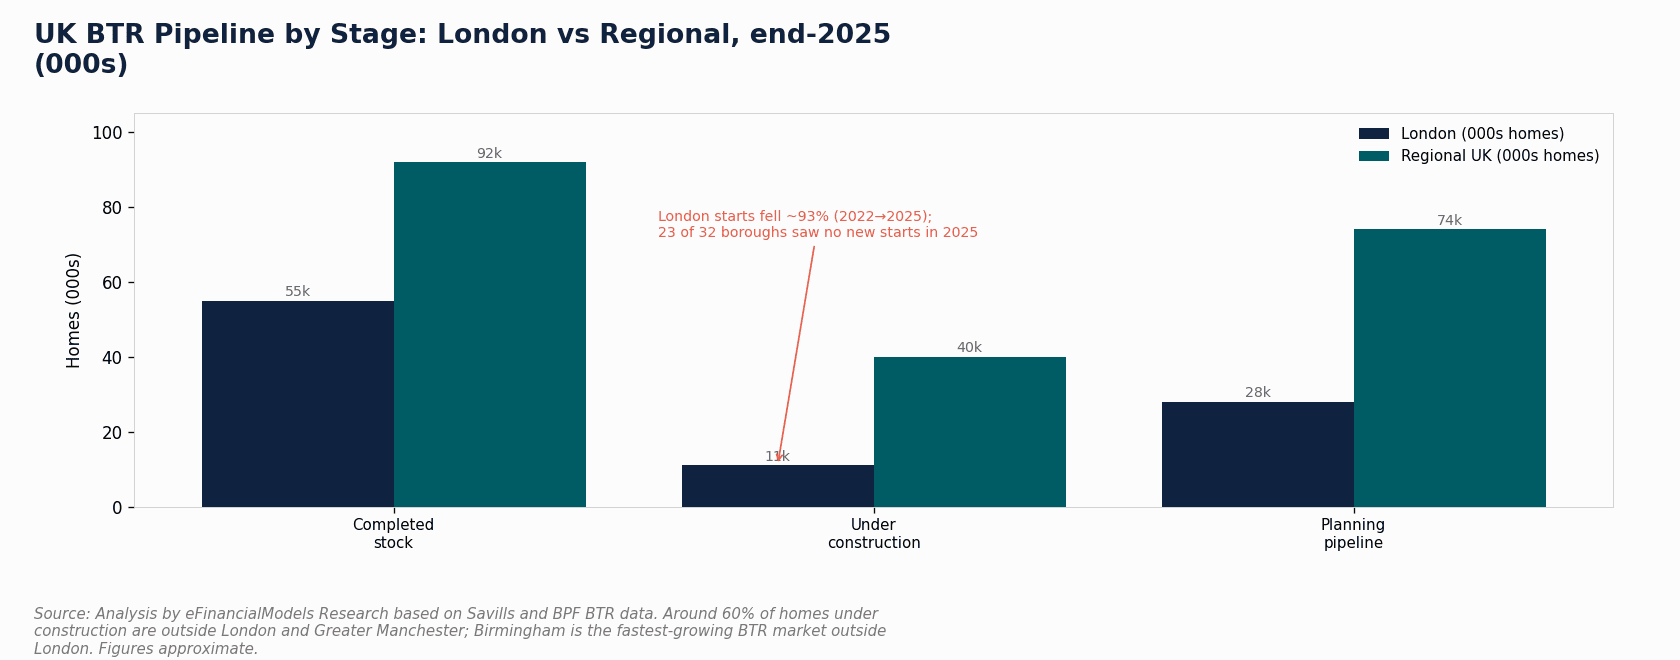
The sector matters to financial modelers and investors because it has crossed a threshold. Completed BTR stock reached roughly 146,700 homes by end-2025, with a total pipeline — homes under construction plus those in planning — of close to 298,800, according to the United Kingdom BTR, PRS & Co-Living Market Study 2026–2031. Living sectors as a whole absorbed roughly a quarter of all UK real estate investment in 2025. That scale means BTR is no longer a niche experiment; it is a core institutional asset class.

Yet the supply side is under severe stress. BTR completions have exceeded new starts on site for eight consecutive quarters. The Bank of England cut its base rate to 3.75% in December 2025 (Bank of England), and further easing is expected through 2026 — a shift that will gradually improve debt affordability and transaction volumes, but has not yet unlocked a starts recovery.
Supply: Where the Pipeline Has Collapsed and Where It Hasn’t
The supply story is a tale of two geographies. London has effectively stalled, while regional cities are absorbing the growth.
London BTR starts fell roughly 93% between 2022 and 2025, according to the eFinancialModels market study, with 23 of 32 boroughs recording no new starts at all in 2025. Three forces drove this collapse: build-cost inflation, the Building Safety Act 2022 gateway approval regime for higher-risk buildings (those above 18 meters now require a second staircase and formal sign-off from the Building Safety Regulator), and a planning system that has struggled to process applications at pace.
Regional cities tell a different story. Roughly 60% of homes currently under construction sit outside London and Greater Manchester. Birmingham has become the fastest-growing BTR market outside the capital, with more than 16,000 units in planning or development. Manchester, Leeds, Bristol, Glasgow, Sheffield, Liverpool, and Edinburgh all feature active pipelines.
For modelers, the practical implication is clear: gate project timing on the regional pipeline, not the national average. A scheme in Birmingham or Leeds faces a very different viability and competition landscape than one in inner London.

Demand: 4.6 Million Households and Only 3% Served by Institutional BTR
Demand fundamentals for UK rental housing remain structurally strong. England’s PRS houses around 4.6 million households — roughly one in five of all households — yet institutional BTR accounts for only about 3% of that stock (Office for National Statistics). That gap is the long-term growth runway.
Three demand pillars reinforce each other:
- Chronic housing shortage. The government’s target is approximately 370,000 net additional homes per year in England (part of a 1.5-million-homes-over-the-parliament commitment). Actual delivery has run well below that for years. Each year of shortfall deepens the cumulative deficit, supporting occupancy and rental growth across all tenures.
- Affordability pressure on ownership. High mortgage rates and large deposit requirements have pushed the average age of first-time buying later, extending the period households spend renting and expanding the addressable market for high-quality managed product.
- Qualitative demand shift. Renters increasingly value professional management, security of tenure, amenities, and flexibility — exactly what BTR and co-living deliver. BTR occupancy rates have remained in the upper-90s percent even through the cost-of-living squeeze, evidencing genuine demand depth.
Co-living (also termed Large-Scale Purpose-Built Shared Living, or LSPBSL) targets mobile young professionals priced out of self-contained city-center flats. It bundles rent, bills, furnishings, and shared amenities into a single payment. From roughly 9,000 operational units today, the co-living pipeline exceeds 31,000 homes (approximately 5,500 under construction, around 14,000 with planning permission, and roughly 17,000 at pre-application stage).
Pricing, Yields, and the Gilt Spread Problem
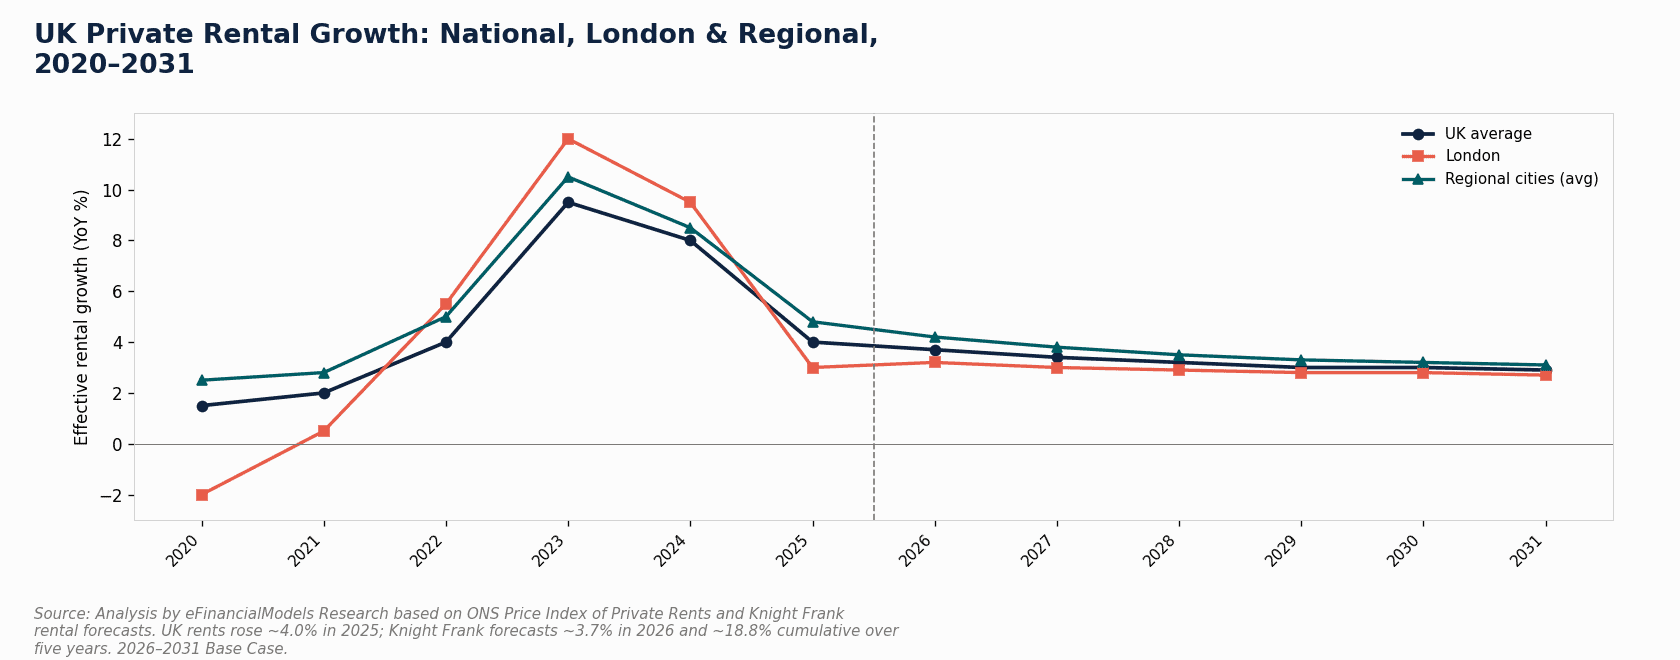
Rental pricing is rising, but the yield arithmetic is tight. UK private rents grew around 4.0% in 2025; Knight Frank forecasts roughly 3.7% in 2026 and approximately 18.8% cumulatively over five years, with regional cities outpacing London where affordability ceilings are binding.
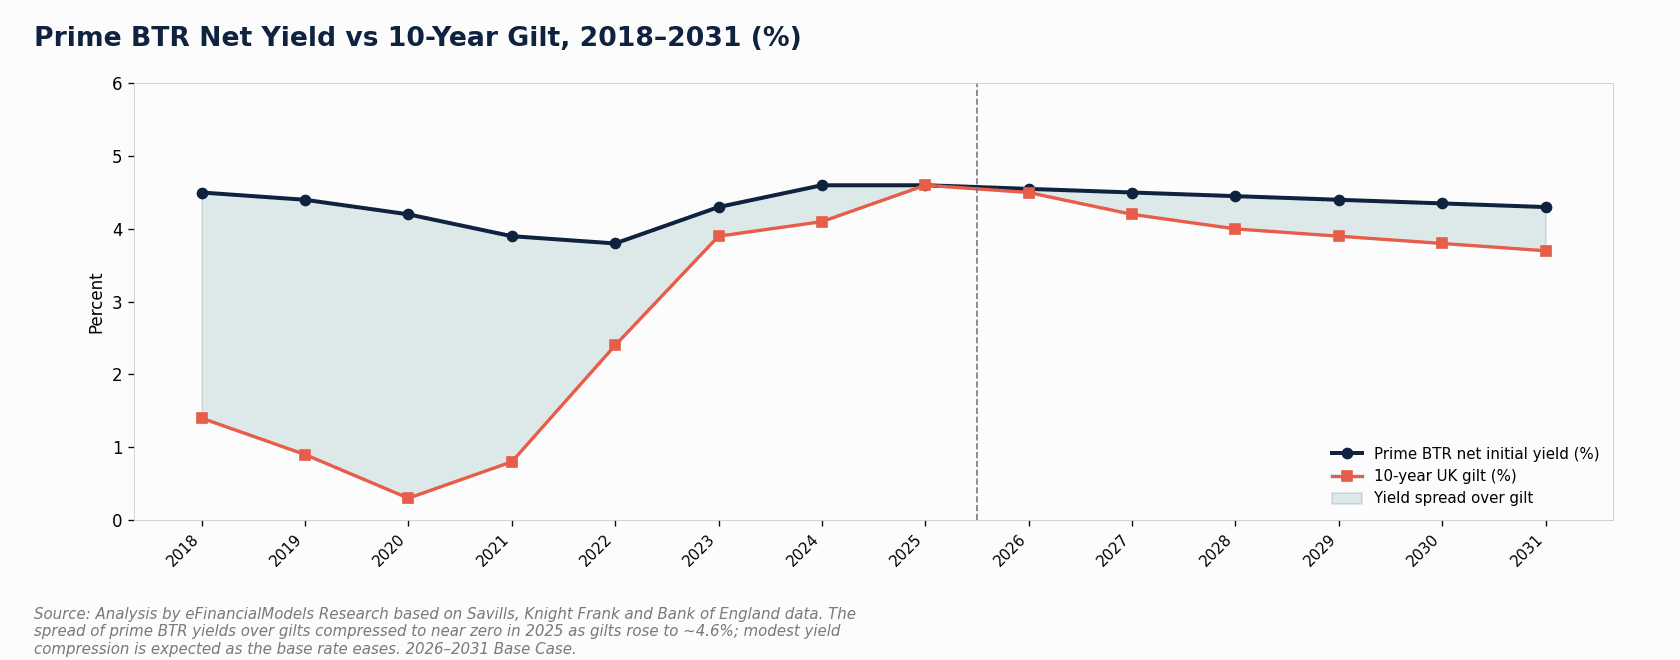
Prime BTR net initial yield (stabilised net operating income divided by gross asset value) held around 4.5–4.6% through 2025. The 10-year UK gilt yield sat near 4.6% over the same period, meaning the yield spread — the premium property investors earn over the risk-free rate — was essentially zero at the margin. That is the central vulnerability in the current market: if gilts stay elevated, capital values face downward pressure regardless of rental growth.
The offsetting force is monetary easing. As the Bank of England’s base rate falls from 3.75% toward an expected 3.0–3.5% by 2031 (base case), all-in BTR debt costs ease, accretive leverage becomes possible again, and the bid-ask gap between sellers and buyers narrows — lifting transaction volumes.
Worked Example: How Exit Yield Moves the IRR
Here’s the math on why exit yield matters more than rent growth for levered returns. Consider a stabilised UK BTR asset with the following base-case assumptions drawn from the eFinancialModels study:
- Entry net initial yield: 4.5%
- Stabilised net operating income (NOI) at entry: £1,000,000
- Implied gross asset value at entry: £1,000,000 / 0.045 = £22,222,222
- Leverage: 55% LTV, so equity invested = £22,222,222 × 0.45 = £10,000,000
- Rent growth CAGR over 7 years (base case): 3.0% per year
- NOI at year 7 (assuming costs grow at CPI, net growth ~2.5%): £1,000,000 × (1.025)^7 = ~£1,189,000
- Exit net yield (base case, flat to entry): 4.5%
- Gross exit value: £1,189,000 / 0.045 = £26,422,222
- Debt repaid at exit (assumed interest-only, 55% of entry value): £12,222,222
- Equity proceeds: £26,422,222 − £12,222,222 = £14,200,000
- Equity multiple on £10,000,000 invested over 7 years: 1.42x, implying a levered IRR of approximately ~5% (consistent with the bear-case IRR in the study’s scenario table)
Now stress the exit yield to 4.8% (25 bps expansion, bear case):
- Gross exit value: £1,189,000 / 0.048 = £24,771,000
- Equity proceeds: £24,771,000 − £12,222,222 = £12,549,000
- Levered IRR drops to approximately ~3%
The lesson: a 30-basis-point move in exit yield wipes out more return than two years of rent growth adds. Never bank on yield compression as a source of return.
Three Scenarios to 2031
The outlook to 2031 depends primarily on the pace of rate easing, the recovery of starts, and how smoothly the Renters’ Rights reforms bed in. The eFinancialModels market study frames three scenarios with explicit probability weights.
| Variable | Bear (25%) | Base (50%) | Bull (25%) |
|---|---|---|---|
| Rent CAGR 2026–2031 | 1.5% | 3.0% | 4.5% |
| Prime yield 2031 | ~4.8% | ~4.3% | ~3.9% |
| Annual BTR investment 2031 | ~£4.0bn | ~£7.5bn | ~£10.5bn |
| 7-yr levered IRR (illustrative) | ~5% | ~13% | ~21% |
| Base rate / gilt path | Higher-for-longer | Gradual easing | Faster easing |
| Supply (starts) response | No recovery | Gradual recovery | Reignited |
Source: eFinancialModels Research. IRR figures are illustrative for a stabilised UK BTR asset at ~55% LTV; not a specific asset valuation.
The base case (50% probability) sees the Bank of England base rate ease toward 3.0–3.5%, rental growth running around 3.0% per year, starts recovering gradually in the regions, and annual BTR investment climbing toward ~£7.5 billion by 2031. The Renters’ Rights regime beds in without major disruption and accelerates the professionalisation of the sector.
The bear case (25% probability) sees gilts stay elevated, rental growth slow to ~1.5% as a weaker labor market bites, and annual BTR investment stall near £4 billion. Some over-levered assets face refinancing stress.
The bull case (25% probability) sees inflation tamed, the base rate fall faster toward ~3%, yields compress meaningfully, and annual BTR investment exceed £10 billion by 2031 as global capital re-rates the asset class.
Regulatory Shifts: The Renters’ Rights Act and EPC C by 2030
Regulation is the single most consequential force acting on UK rental housing over the study period. Two reforms dominate.
The Renters’ Rights Act 2025 received Royal Assent on 27 October 2025 (legislation.gov.uk). From 1 May 2026 it abolished Section 21 ‘no-fault’ evictions — the mechanism that previously allowed landlords to end tenancies without giving a reason. All assured shorthold tenancies (fixed-term contracts that have been the standard form of private rental agreement in England since 1989) convert to assured periodic tenancies. Landlords must now rely on revised Section 8 grounds for possession. The Act also limits rent increases to once every 12 months, bans rental bidding wars, restricts rent in advance, and establishes a Private Rented Sector Database and Ombudsman.
For institutionally managed BTR and co-living — already high-spec, professionally managed, and designed for long-term tenancies — these reforms are more an opportunity than a threat. They raise the compliance bar for fragmented buy-to-let landlords, accelerating consolidation toward the professional sector.
The second major reform is the EPC C minimum. The Energy Performance Certificate (EPC) rates a property’s energy efficiency from A (best) to G (worst). The government has confirmed that all privately rented homes must achieve at least EPC band C by 1 October 2030, with enabling legislation expected from 2027. A cost cap of £10,000 per property per decade applies, and local authorities can levy fines up to £30,000 per property per breach. New-build institutional BTR is generally already compliant; the burden falls on older standing stock. According to the Department for Energy Security and Net Zero, approximately 60% of privately rented homes in England were rated below EPC band C as of the most recent national assessment (Department for Energy Security and Net Zero, English Housing Survey data), meaning the retrofit burden across the wider PRS is substantial even if new-build BTR is largely insulated.
Common Modeling Mistakes in BTR Underwriting
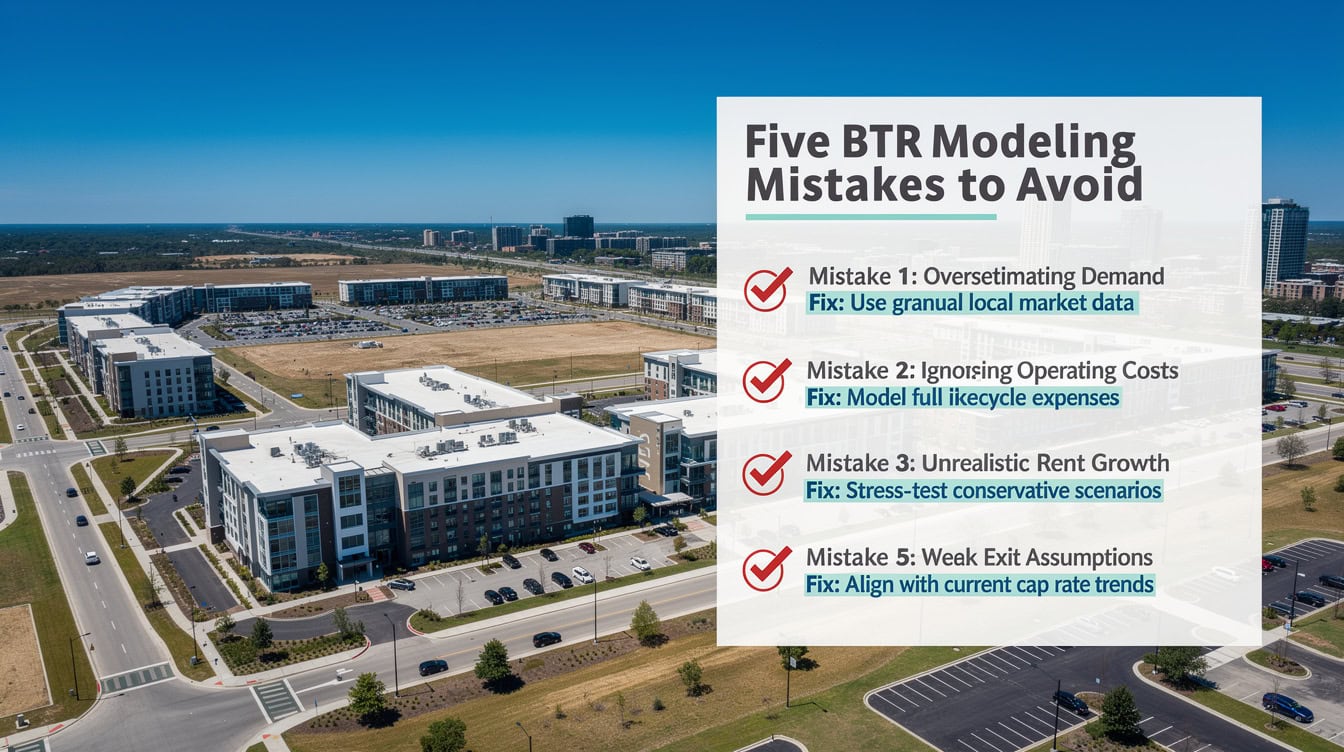
Financial modelers working on BTR and PRS assets consistently make five errors that distort returns.
1. Using a single blended rent-growth assumption. Regional cities are expected to outpace London materially through 2031. A flat national assumption overstates London returns and understates regional ones. Use product- and region-specific growth curves.
2. Modeling gross rent growth instead of NOI growth. Operating costs — service charges, insurance, staffing, energy, and now compliance and EPC capex — grow at or above CPI. If you grow revenue at 3% but costs at 4%, net operating income (NOI, the income left after operating expenses but before debt service) grows more slowly than the headline rent figure. Model NOI growth, not gross rent growth.
3. Assuming yield compression as a source of return. With the yield-over-gilt spread near zero, assuming exit yields compress from 4.5% to 4.0% adds roughly 11% to exit value — but that assumption requires gilts to fall significantly. The worked example above shows how quickly yield expansion destroys equity returns. Model exit yields at or modestly above entry.
4. Stress-testing only at acquisition. Assets levered at 2023–2024 rate peaks face refinancing into a curve that, while easing, remains elevated. Test interest-cover ratio (ICR), debt-service-cover ratio (DSCR), and loan-to-value (LTV) at refinancing and exit, not just at the point of purchase.
5. Ignoring EPC and compliance capex. The £10,000-per-property EPC upgrade cost cap sounds modest, but across a 500-unit portfolio it represents £5 million of planned capex. Budget it explicitly in your cash flow model, or your NOI projections will be overstated.
Tools and Templates for BTR Financial Modeling
Market-level analysis tells you where to look; project-level financial models tell you whether a specific deal works. To translate the supply, demand, and pricing assumptions in this article into property-level cash flows, levered IRR, and debt sizing, you’ll need a purpose-built model.
The Real Estate Financial Model Bundle covers the full spectrum of property types and return structures. For development-stage BTR schemes, the Real Estate Developer Model handles phased construction costs, forward-funding structures, and development profit calculations. For standing-asset acquisitions and joint ventures — increasingly the structure of choice as pension and sovereign capital partners with UK operators — the Waterfall Model for Joint Venture Real Estate Project models preferred returns, promote structures, and IRR hurdles.
For commercial and mixed-use schemes that include BTR alongside retail or office, the Commercial Real Estate Excel Model Template provides a flexible multi-asset framework.
Frequently Asked Questions
What is the difference between BTR and the wider PRS?
The Private Rented Sector (PRS) covers all privately rented housing in England, including individual buy-to-let landlords who own one or two properties. Build-to-Rent (BTR) is a professionally managed, purpose-built subset of the PRS, typically in blocks of 50 or more units or suburban single-family communities. Institutional BTR accounts for only about 3% of England’s 4.6 million PRS households. The key distinction for investors is that BTR offers institutional-grade management, amenities, and data transparency that individual buy-to-let cannot match, which is why it commands a rent premium and attracts pension and sovereign capital.
How does the Renters’ Rights Act 2025 affect BTR investors specifically?
The Renters’ Rights Act 2025, which received Royal Assent on 27 October 2025, abolished Section 21 ‘no-fault’ evictions from 1 May 2026 and limits rent increases to once every 12 months. For BTR operators, the practical impact is manageable: professionally managed BTR already operates on long-term tenancy models with structured rent review processes. The bigger impact falls on fragmented buy-to-let landlords who relied on Section 21 for portfolio management. BTR operators should update their tenancy agreements, model the annual rent-cap constraint into their revenue assumptions, and ensure their Section 8 possession grounds are documented and legally robust.
What does the EPC C requirement mean for a BTR portfolio?
From 1 October 2030, all privately rented homes in England must achieve at least Energy Performance Certificate band C. New-build institutional BTR is generally already compliant because modern construction standards produce energy-efficient buildings. The risk lies in older standing stock acquired for repositioning. The government has confirmed a cost cap of £10,000 per property per decade for upgrades, with fines up to £30,000 per property per breach for non-compliance. For a 300-unit standing portfolio where 40% of units need upgrading, that represents up to £1.2 million of planned capex — budget it explicitly in your financial model, or your NOI projections will be overstated.
Why did London BTR starts fall so dramatically?
London BTR starts fell roughly 93% between 2022 and 2025, with 23 of 32 boroughs recording zero new starts in 2025. Three forces combined: build-cost inflation that squeezed development margins, the Building Safety Act 2022 gateway approval regime that added time and cost to high-rise delivery (including a second-staircase requirement for buildings above 18 meters), and a planning system that has been slow to process applications. The result is that the growth engine has shifted decisively to regional cities. Birmingham now has more than 16,000 BTR units in planning or development, and roughly 60% of homes currently under construction sit outside London and Greater Manchester.
What is co-living and how does it differ from standard BTR?
Co-living (formally termed Large-Scale Purpose-Built Shared Living, or LSPBSL) offers private rooms or studios with extensive shared amenities — kitchens, lounges, gyms, co-working spaces — and bundles rent, bills, furnishings, and services into a single monthly payment. It targets mobile young professionals priced out of self-contained city-center flats. The all-in rent appears higher per square foot than standard BTR, but it competes on total cost of occupancy for a single person. From roughly 9,000 operational units today, the co-living pipeline exceeds 31,000 homes. It is the fastest-growing niche in UK living sectors, though it carries higher operator-dependency risk than stabilised multifamily BTR.
What are the three scenarios for UK BTR investment by 2031?
The eFinancialModels market study sets out three scenarios. The base case (50% probability) sees annual BTR investment reach ~£7.5 billion by 2031, with rent growth of ~3.0% per year and a 7-year levered IRR of approximately 13% for a stabilised asset at ~55% LTV. The bear case (25% probability) sees investment stall near £4 billion, rent growth slow to ~1.5%, and IRR fall to ~5% as gilts stay elevated and starts fail to recover. The bull case (25% probability) sees investment exceed £10 billion, rent growth run at ~4.5%, and IRR reach ~21% as faster rate cuts restore a healthy yield spread and planning reform reignites starts.
How should I stress-test a BTR acquisition model?
Stress-test across four variables: exit yield, rent growth, refinancing cost, and operating cost inflation. The worked example in this article shows that a 30-basis-point expansion in exit yield (from 4.5% to 4.8%) reduces equity proceeds by roughly £1.65 million on a £22 million asset — more than two years of rent growth at 3% per year. Run your model at exit yields of 4.5%, 4.8%, and 5.1% to bracket the range. Separately, stress ICR and DSCR at refinancing using a gilt curve 50–75 basis points above your base-case assumption. Finally, grow operating costs at CPI plus 1% to capture service charge, insurance, staffing, and EPC capex inflation.
Conclusion
The UK BTR market enters 2026 with record capital, a structural demand gap, and a regulatory framework that favors scale and professional management. The binding constraint is not money — investors have signalled intentions to deploy roughly £32 billion into UK and Irish living sectors over three years. The constraint is consentable, viable stock. Regional cities, single-family housing, and co-living backed by disciplined operators are the primary growth vectors. London remains constrained until build costs and planning friction ease.
For modelers, the central discipline is conservative underwriting: product- and region-specific rent curves, NOI growth rather than gross rent growth, exit yields at or above entry, and explicit EPC and compliance capex. Don’t assume yield compression; stress refinancing; and treat the Renters’ Rights Act as a structural tailwind for the institutional model, not a headwind.
I recommend downloading the United Kingdom BTR, PRS & Co-Living Market Study 2026–2031 to access the full scenario analysis, base-case assumption set, and quick-reference action checklist — then pair it with an EFM real estate financial model template to build your project-level cash flows and IRR.

























































