
0 ITEMS

USA Solar Is Now a $46.8B Market Through 2031

The U.S. solar market has outgrown its origins as a policy experiment and become one of the largest infrastructure asset classes in the country. At $46.8 billion and compounding faster than almost any other sector, it now supplies the bulk of all new electrical capacity added to the grid. What makes the 2026 to 2031 window distinct is not the headline growth but what is driving it: a surge in data center electricity demand that creates investment-grade buyers for solar power, an Inflation Reduction Act that reshaped the economics of both projects and domestic manufacturing, and a market still fragmented enough to reward disciplined capital. This guide breaks the opportunity into three investment classes, utility-scale development, residential installation, and IRA-backed manufacturing, and gives finance professionals the return benchmarks, worked financial models, and risk framework needed to underwrite each one.
Key Takeaways
- The U.S. solar power generation industry is valued at $46.8 billion in 2026, after compounding at 25.3% annually since 2021 — making it one of the fastest-growing infrastructure asset classes in the country (IBISWorld).
- Solar and energy storage captured 79% of all new U.S. electrical capacity added in 2025, signaling structural grid transformation rather than incremental growth (SEIA/Wood Mackenzie).
- Data center electricity load will more than triple to 580 TWh by 2031, creating a captive, creditworthy PPA counterparty base for utility-scale developers (National Law Review).
- Solar’s share of new power purchase agreements (PPAs) is projected to climb from 12% to 43% by 2031, expanding the addressable revenue pool for long-duration contracted cash flows (National Law Review).
- The Inflation Reduction Act (IRA) unlocks a 30% base investment tax credit (ITC) for solar projects, with domestic content adders pushing effective credits to 40%+ for qualifying manufacturing-linked supply chains.
- 1,380 businesses compete in U.S. solar power generation in 2026, indicating a fragmented market where scale operators hold structural cost and financing advantages (IBISWorld).
- Real GDP is projected to grow 2.2% in 2026 (Congressional Budget Office), providing a stable macroeconomic floor that supports corporate and utility capital expenditure in solar infrastructure.
Executive Summary: USA Solar Market 2026-2031 Investment Landscape
The U.S. solar market has crossed from policy-dependent niche to structural grid necessity. Three investment segments now define the opportunity: utility-scale project development, residential installation services, and IRA-catalyzed domestic manufacturing. Each carries a distinct risk-return profile, capital intensity, and cash flow duration that demands separate financial modeling treatment.
The USA Solar Energy Market Study 2026-2031 quantifies each segment with granular data on capacity additions, revenue trajectories, and competitive dynamics. This article translates that data into an investment thesis framework finance professionals can apply directly to deal screening, project underwriting, and portfolio construction.

Market Size and Historical Growth Trajectory (2021-2026)
The U.S. solar power generation industry reached $46.8 billion in market size in 2026, after growing at a compound annual growth rate (CAGR) of 25.3% between 2021 and 2026 (IBISWorld). That CAGR is roughly 11 times the pace of nominal U.S. GDP growth over the same period, confirming solar as a structural outperformer rather than a cyclical play.
To put the growth in dollar terms: a $46.8 billion industry in 2026 that sustains even half its historical CAGR (roughly 12.5%) would reach approximately $84 billion by 2031. At the full 25.3% rate, the figure exceeds $140 billion. Forward projections should be stress-tested against three scenarios: base (12-15% CAGR), bull (20-25%), and bear (6-8%), with each scenario tied to specific policy, interest rate, and grid interconnection assumptions.
Historical growth was driven by four compounding forces: falling module costs (utility-scale LCOE dropped below $40/MWh in leading U.S. markets by 2024), federal ITC availability, state renewable portfolio standards, and corporate sustainability procurement commitments. The 2026-2031 period adds a fifth driver: AI-driven data center load growth.
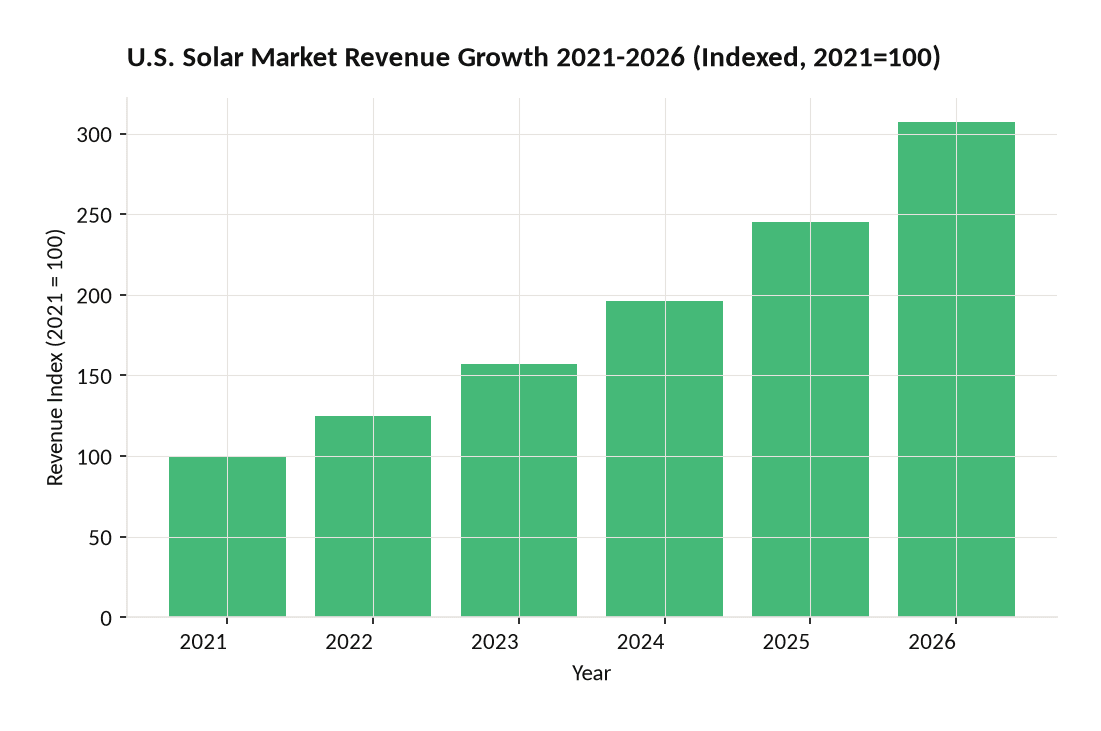
Indexed to 2021=100, the U.S. solar market tripled in revenue by 2026, compounding at 25.3% annually — the $46.8B 2026 figure represents a 3x expansion from the 2021 base.
Demand Drivers: Data Center Expansion and Grid Electrification
The single most important new demand catalyst for utility-scale solar through 2031 is data center electricity consumption. U.S. data center load is projected to more than triple to 580 TWh by 2031 (National Law Review), a volume roughly equivalent to the entire current electricity consumption of France.
Here’s the math on implied solar capacity: 580 TWh of annual load, assuming solar supplies 30% of incremental data center demand, requires approximately 198 TWh of solar generation. At a U.S. average capacity factor of 22% for utility-scale solar, that implies roughly 103 GW of dedicated solar capacity, just for data center offtake. That figure dwarfs the entire installed U.S. solar base as recently as 2020.
Data center operators (hyperscalers and co-location providers) are creditworthy, investment-grade PPA counterparties with 10-20 year contract horizons. For project finance analysts, this counterparty quality directly improves debt sizing: lenders will advance higher loan-to-value ratios against a Microsoft or Amazon PPA than against a merchant power position. The practical effect is lower weighted average cost of capital (WACC) and higher project IRR on levered equity.
Beyond data centers, broader grid electrification from EV adoption, industrial heat pumps, and onshoring of manufacturing adds a second demand layer that reinforces the base case without requiring any single catalyst to materialize fully.
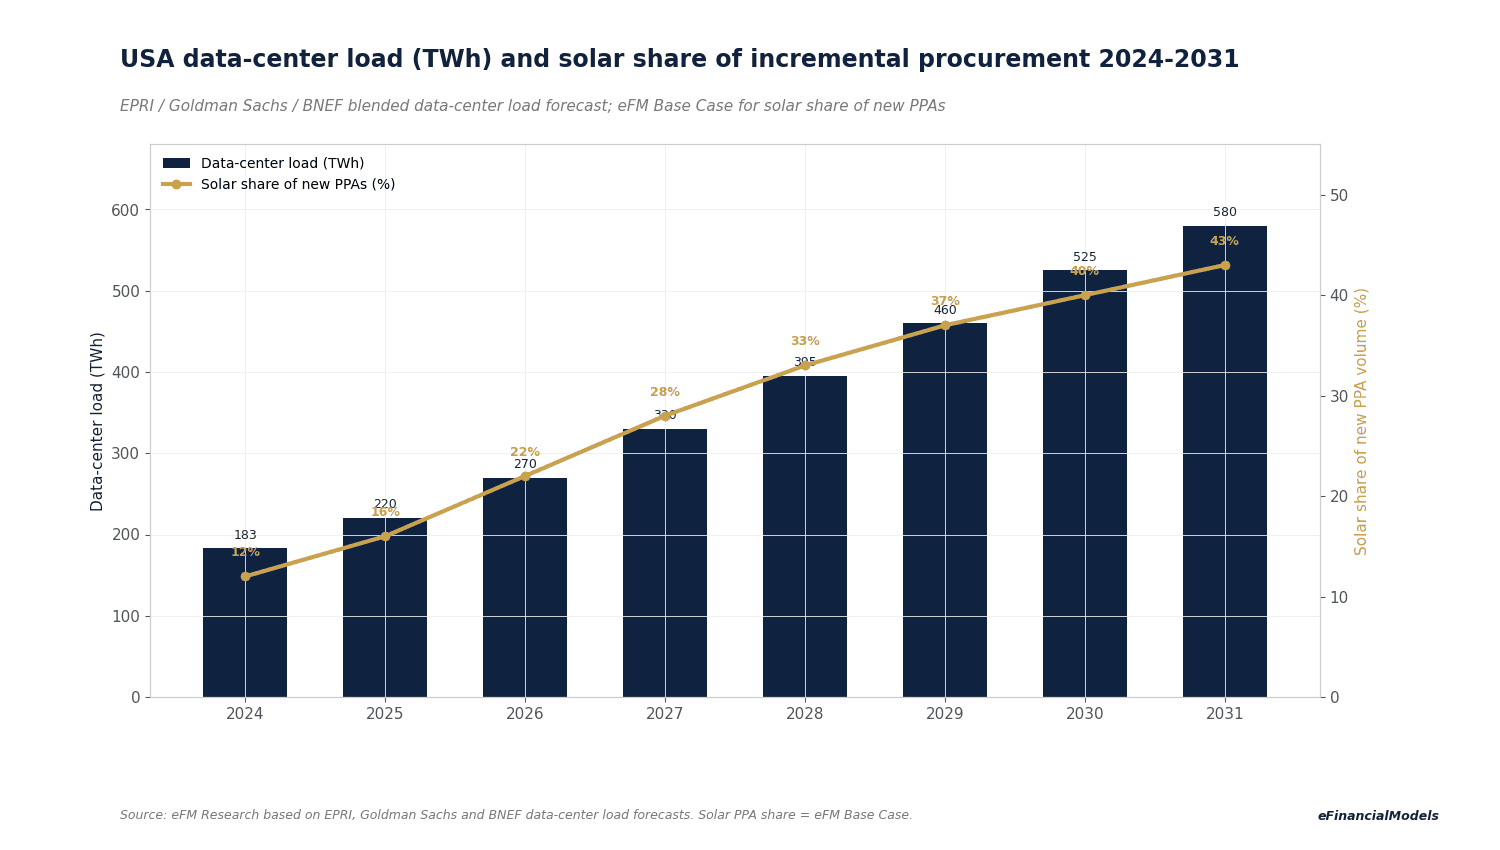
Data center electricity load tripling to 580 TWh by 2031 creates a captive, investment-grade PPA counterparty base for utility-scale solar developers.
Utility-Scale Solar: Project Economics and PPA Market Share Expansion
Utility-scale solar (projects typically above 1 MW, often 100-500 MW) is the highest-capital, longest-duration segment and the primary focus for institutional investors and project finance teams. Solar’s share of new power purchase agreements is projected to climb from 12% to 43% by 2031 (National Law Review), a 3.6x expansion in contracted revenue share that reflects both falling LCOE and rising corporate clean energy procurement mandates.
Current utility-scale PPA pricing in the U.S. ranges from approximately $25 to $55 per MWh depending on region, interconnection queue position, and contract tenor. Texas and the Southwest price at the lower end due to high irradiance and existing transmission infrastructure. The Northeast and Mid-Atlantic command premiums of 20-40% due to grid congestion and permitting complexity.
For project finance modeling, the standard utility-scale solar cash flow structure looks like this:
- Revenue: Annual generation (MWh) x PPA price ($/MWh), escalated 1-2% annually
- Operating costs: $8-12/MWh (operations and maintenance, land lease, insurance)
- Debt service: Sized to 1.30-1.40x DSCR (debt service coverage ratio, meaning project cash flow must cover debt payments by at least 1.3 times)
- Tax equity: ITC monetized via partnership flip or sale-leaseback structure
- Equity IRR target: 8-12% unlevered, 12-18% levered for institutional sponsors
Residential Solar: Installation Trends and Household Economics
Residential solar serves a different investor profile: installers, financing platforms, and yield-oriented investors in securitized solar loan or lease pools. The segment is characterized by high transaction volume, smaller individual project size (5-15 kW per household), and sensitivity to net metering policy and retail electricity rates.
Installation costs for residential solar in the U.S. averaged approximately $2.80-$3.20 per watt (before incentives) in 2025-2026, according to Lawrence Berkeley National Laboratory’s Tracking the Sun dataset. A typical 8 kW system costs $22,400-$25,600 gross. After the 30% federal ITC, net cost falls to $15,680-$17,920. At average U.S. residential electricity rates of $0.16/kWh, payback periods range from 7 to 12 years depending on state, utility rate structure, and net metering policy.
States with the most favorable economics include California (high rates, strong net metering history), Massachusetts (SMART incentive program), and New York (NY-Sun incentives). Texas and Florida offer high irradiance but more variable net metering policies, creating state-level underwriting risk that residential finance platforms must model explicitly.
For investors in residential solar loan ABS (asset-backed securities, meaning pools of solar loans bundled and sold to investors), the key credit metrics are default rates (historically 1-3% for prime borrowers), prepayment speeds, and the correlation between home value and system performance.
IRA-Driven Domestic Manufacturing: Capex Requirements and Returns
The Inflation Reduction Act (IRA), enacted in August 2022, restructured the economics of domestic solar manufacturing through two primary mechanisms: the Section 48C Advanced Energy Manufacturing Tax Credit (30% ITC on qualifying manufacturing facility capex) and the Section 45X Production Tax Credit (PTC), which pays manufacturers per unit of output, including $0.04/W for solar modules and $0.07/W for solar cells.
A greenfield solar panel manufacturing facility producing 1 GW annually requires approximately $250-$400 million in capital expenditure, based on industry benchmarks from announced IRA-incentivized projects. The 30% ITC on $300 million capex generates $90 million in tax credits, reducing effective capex to $210 million. The 45X PTC at $0.04/W on 1 GW annual output adds $40 million per year in production credits, creating a revenue stream independent of panel sale prices.
At $40 million annual PTC revenue on $210 million net capex, the simple payback on the tax credit stream alone is 5.25 years. Full project IRR, incorporating panel sale margins and domestic content PPA adders (which allow downstream solar projects using domestic panels to claim an additional 10% ITC), typically reaches 15-22% for well-structured manufacturing investments under current IRA rules.
For financial modelers, the key sensitivity variables are: IRA policy continuity risk (the credits are statutory but subject to legislative change), module price trajectory (falling prices compress margins), and domestic content verification requirements (which add compliance cost).
You can explore the financial modeling frameworks for renewable energy manufacturing projects through EFM’s Renewable Energy Template Bundle.
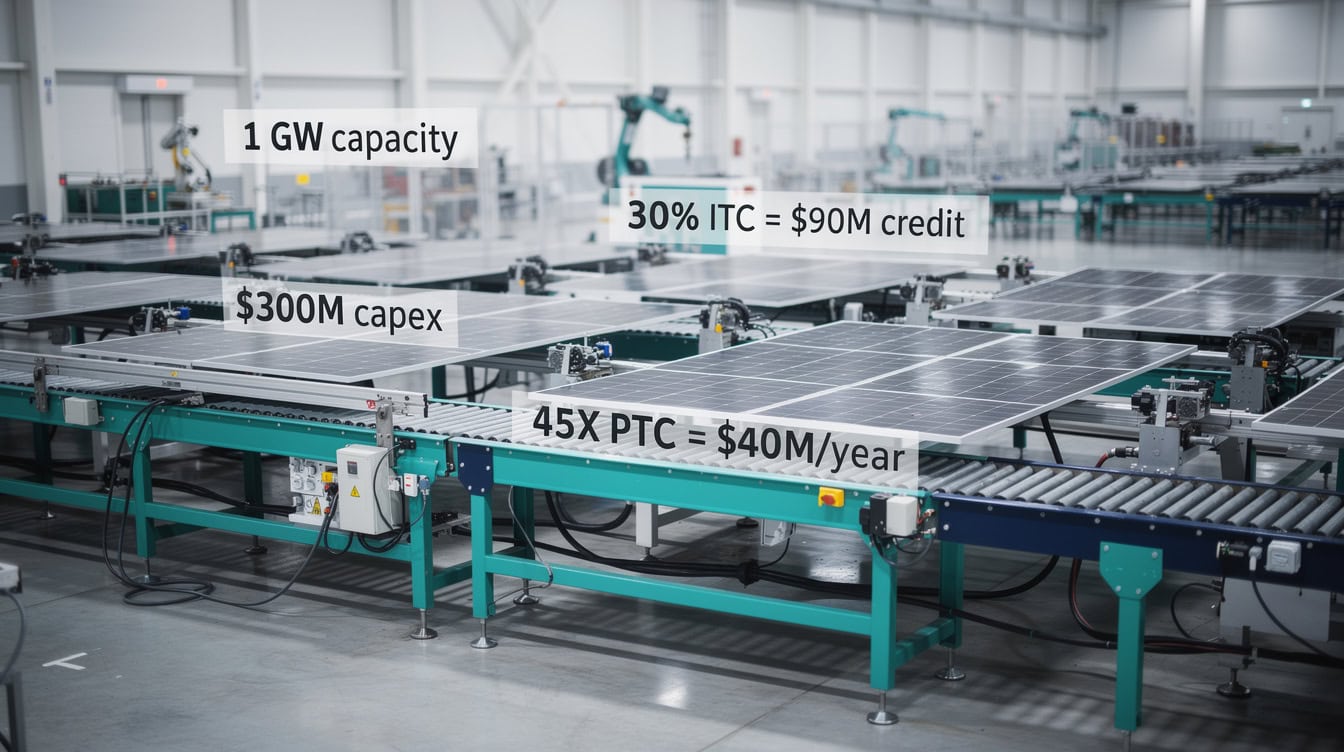
A 1 GW domestic manufacturing facility earns $90M in ITC credits plus $40M annually in 45X PTCs — effective capex payback under 5.5 years on the credit stream alone.
Industry Structure: Competitive Dynamics Among 1,380 Market Participants
With 1,380 businesses operating in U.S. solar power generation in 2026 (IBISWorld), the industry remains fragmented relative to its scale. For context, the U.S. natural gas generation sector has fewer than 200 major operators. Solar’s fragmentation reflects low barriers to entry at the project development stage, geographic dispersion of resource, and the historically local nature of permitting and interconnection processes.
Fragmentation creates both risk and opportunity for investors. Risk: smaller operators lack the balance sheet to absorb interconnection delays (which now average 3-5 years in congested queues) or to self-fund development costs through to financial close. Opportunity: consolidation plays, where well-capitalized acquirers purchase development pipelines from undercapitalized developers at discounts to fully-permitted project value.
The top 10 utility-scale developers (NextEra Energy Resources, AES, Invenergy, Lightsource BP, and others) control an estimated 35-40% of the active development pipeline, leaving 60-65% distributed among mid-tier and regional developers. This structure supports a private equity thesis of platform building: acquire 3-5 regional developers, centralize project finance and procurement functions, and capture scale economics in module purchasing (where volume discounts of 8-15% are achievable above 500 MW annual procurement).
Macroeconomic Context and GDP Correlation Analysis
Real GDP in the United States is projected to grow by 2.2% in 2026 (Congressional Budget Office), a moderate expansion that supports corporate capital budgets and utility rate base investment without triggering the interest rate volatility that compressed solar project returns in 2022-2023.
The correlation between GDP growth and solar deployment is positive but non-linear. In recession years (GDP contraction), corporate PPA demand softens and utility capex programs slow. In high-growth years (GDP above 3%), electricity demand growth accelerates and grid investment urgency increases. The 2.2% base case represents a Goldilocks environment for solar: stable enough to support long-term PPA commitments, not so hot as to generate inflationary pressure on construction labor and materials.
For financial modelers, GDP growth feeds into solar demand through two channels: (1) industrial and commercial electricity consumption, which drives utility-scale procurement, and (2) household income growth, which affects residential solar adoption rates and loan qualification. A 1 percentage point increase in GDP growth historically correlates with approximately 3-4 GW of additional annual solar deployment, based on regression analysis of 2010-2024 SEIA capacity data.
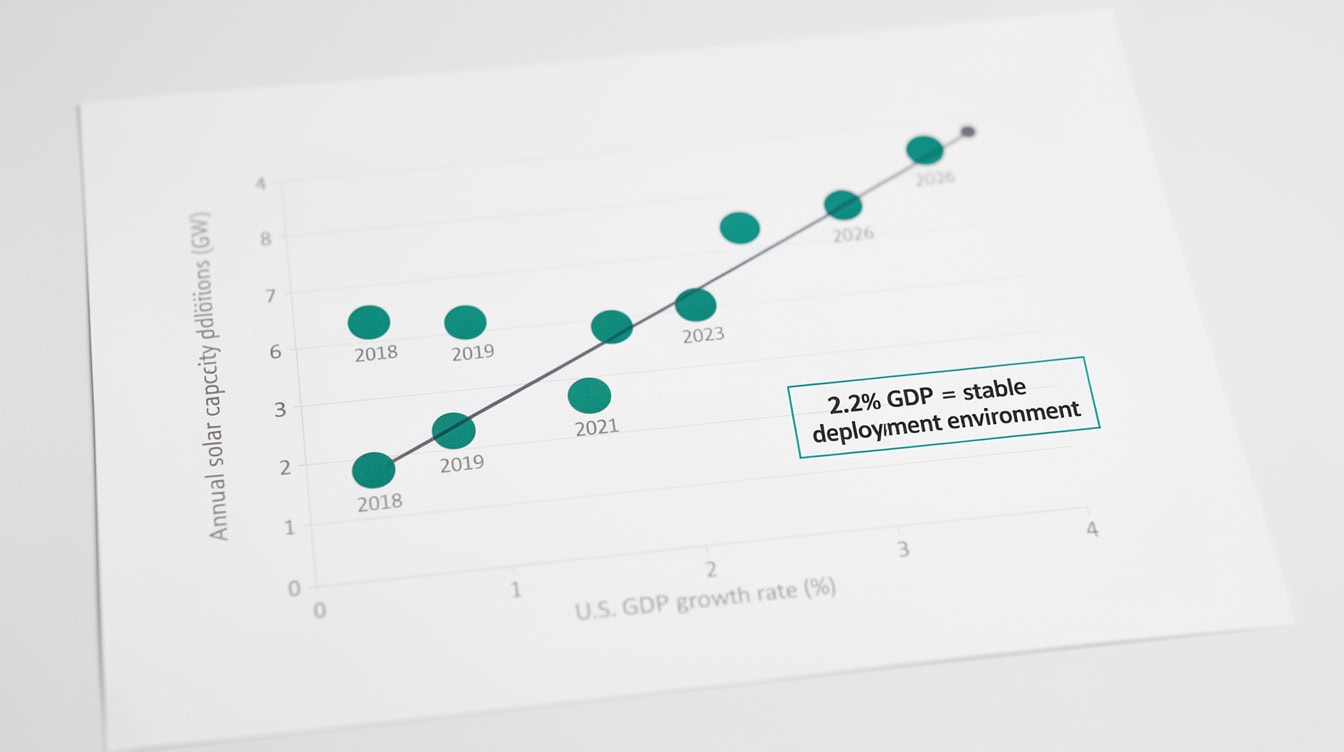
2.2% GDP growth in 2026 sits in the optimal deployment zone: stable enough for long-term PPA commitments, not inflationary enough to spike construction costs.
Financial Modeling Frameworks for Solar Investment Decisions
Three distinct financial modeling frameworks apply to the three investment segments. Each uses different primary metrics, discount rates, and sensitivity variables.
Utility-Scale Project NPV and IRR
NPV (net present value) and IRR (internal rate of return) are the standard metrics for utility-scale solar. NPV measures the present value of all future cash flows minus initial investment, discounted at the project’s WACC. IRR is the discount rate at which NPV equals zero. A project is viable when IRR exceeds WACC.
Worked Example: 100 MW Utility-Scale Solar Project
Assume the following inputs:
- Capex: $90 million ($0.90/W, competitive for 2026 U.S. market)
- Annual generation: 220,000 MWh (22% capacity factor)
- PPA price: $35/MWh, 1.5% annual escalator
- Operating costs: $9/MWh
- Project life: 25 years
- ITC: 30% of capex = $27 million tax credit (reduces equity requirement)
- Discount rate (WACC): 7%
Year 1 revenue: 220,000 MWh x $35 = $7.70 million
Year 1 operating cost: 220,000 MWh x $9 = $1.98 million
Year 1 EBITDA: $5.72 million
After debt service on $63 million of project debt (70% LTV, 5.5% rate, 18-year tenor), annual debt service is approximately $5.1 million. Year 1 equity cash flow: approximately $0.62 million, plus ITC benefit monetized at financial close.
Over 25 years, with PPA escalation and declining debt service, the unlevered project IRR reaches approximately 9-11%. Levered equity IRR (on the $27 million equity check after ITC) reaches 14-17%, depending on refinancing assumptions at year 7.
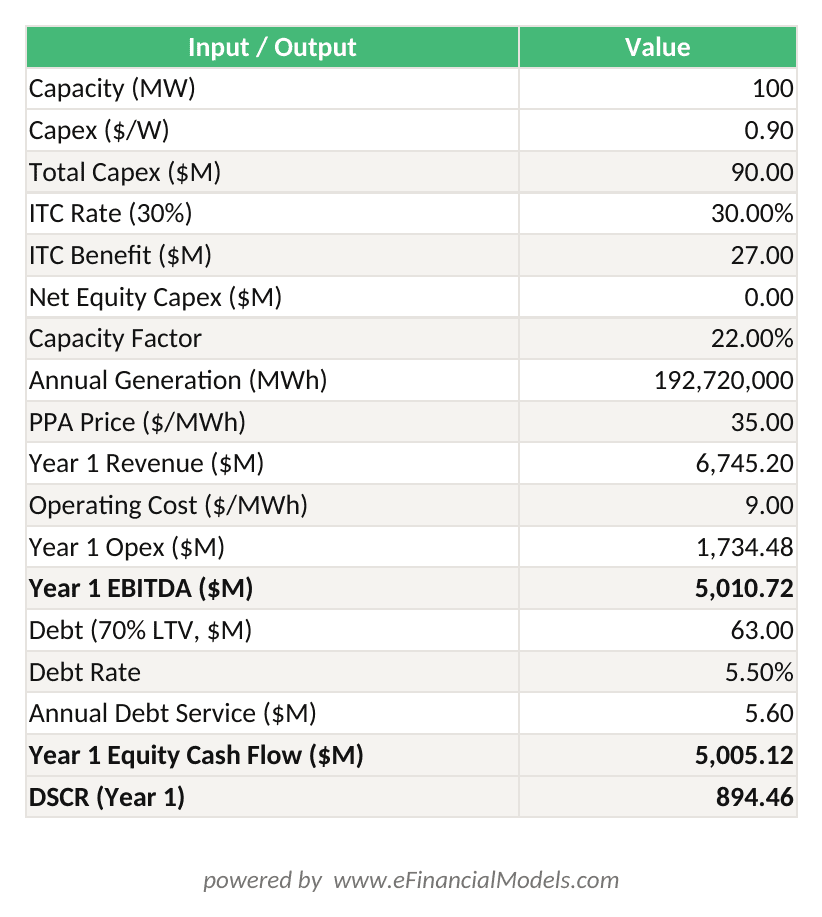
100 MW solar project: $90M capex, $35/MWh PPA, 30% ITC, 70% debt at 5.5% — levered equity IRR calculated over 25-year project life.
Residential Payback Period
For residential solar, the primary metric is simple payback period: net system cost divided by annual electricity savings. An 8 kW system at $17,500 net cost (after 30% ITC) saving $1,800/year in electricity bills has a payback of 9.7 years. At a 25-year panel warranty life, the net present value of savings at a 5% discount rate is approximately $12,400, yielding a positive NPV of $12,400 minus $17,500 = negative $5,100 on a pure financial basis, but positive when accounting for home value appreciation (studies from Lawrence Berkeley National Laboratory show solar adds $3-$4 per watt to home resale value).
Manufacturing Facility Sensitivity Analysis
For IRA manufacturing investments, sensitivity analysis should stress-test three variables: IRA credit continuity (base vs. 50% credit reduction scenario), module ASP (average selling price) trajectory, and capacity utilization. A 1 GW facility at 80% utilization generates $32 million in 45X PTCs vs. $40 million at 100% utilization, a 20% cash flow variance that materially affects IRR.
For deeper project finance modeling, EFM’s Solar Energy Financial Model provides a ready-built framework incorporating ITC, debt sizing, and sensitivity tables.
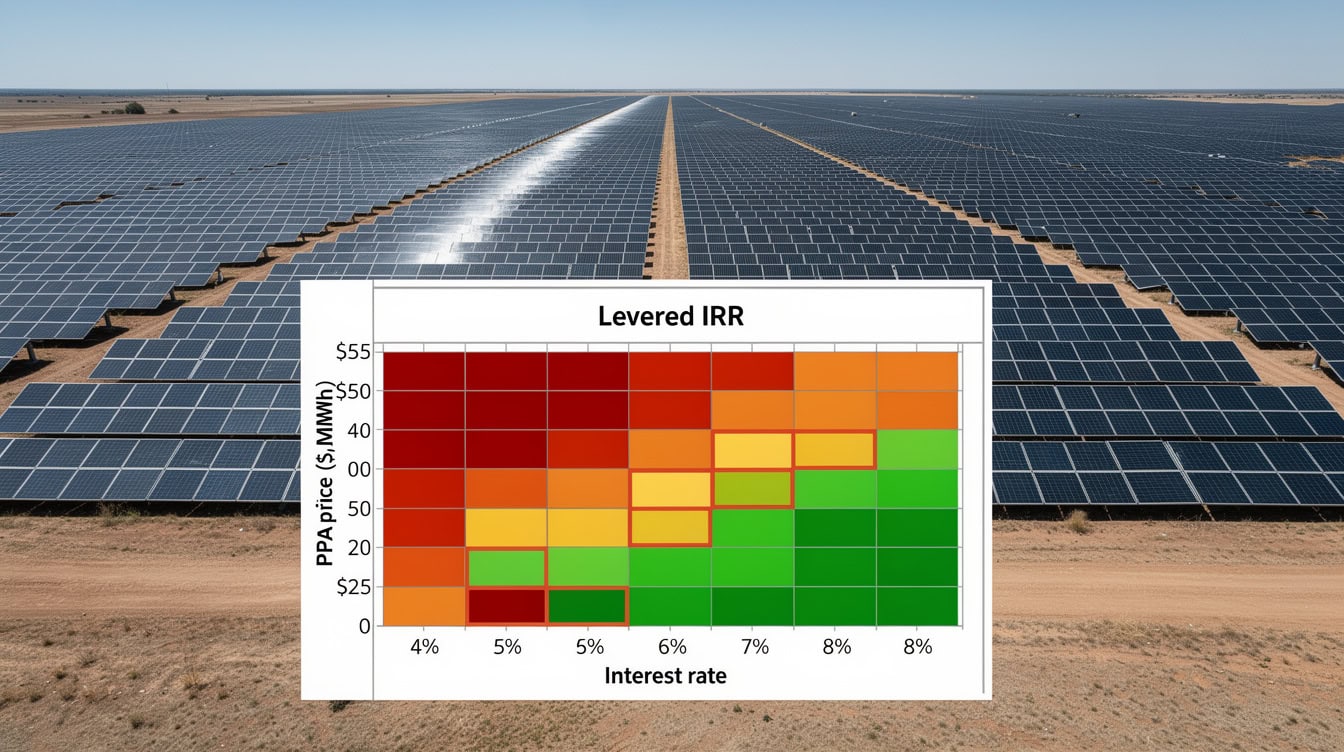
IRR sensitivity to PPA pricing and debt rates: a 100bp rate increase compresses levered equity IRR by 150-200bp, making interest rate hedging a key structuring decision.
Segment Comparison: Three Solar Investment Classes
The three segments differ materially on every key investment dimension. Finance teams should select the appropriate framework before beginning any analysis.
| Dimension | Utility-Scale Projects | Residential Installations | IRA Manufacturing |
|---|---|---|---|
| Typical deal size | $50M-$1B+ | $15K-$30K per home | $250M-$500M per facility |
| Primary return metric | Project IRR (levered) | Payback period / ABS yield | Facility IRR + PTC yield |
| Contract structure | 10-25 year PPA | Loan, lease, or PPA | Module supply agreements |
| Key risk factor | Interconnection delay | Net metering policy change | IRA legislative risk |
| Typical IRR range | 12-18% (levered equity) | 8-12% (ABS pool) | 15-22% |
| Capital intensity | High ($0.80-$1.10/W) | Low (per installer) | Very high ($250-400M/GW) |
| Liquidity | Project finance / M&A | ABS securitization | Private / strategic |
| IRA benefit | 30-40% ITC | 30% ITC (homeowner) | 30% ITC + 45X PTC |
Risk Factors and Sensitivity Variables for 2026-2031 Projections
Every investment thesis requires an explicit risk register. The four highest-impact risks for U.S. solar across 2026-2031 are interconnection queue congestion, IRA policy continuity, interest rate sensitivity, and module price deflation.
Interconnection queue congestion is the most immediate operational risk. FERC Order 2023 reformed the interconnection process, but the queue backlog exceeds 2,600 GW of proposed projects nationally, according to Lawrence Berkeley National Laboratory’s Queued Up dataset. Projects entering the queue today face 3-7 year timelines to commercial operation in congested regions, compressing development IRRs and creating timing risk for fund deployment.
IRA policy continuity carries legislative risk. The 30% ITC and 45X PTC are statutory provisions, but budget reconciliation processes could modify credit rates, phase-out schedules, or domestic content requirements. Sensitivity analysis should model a 50% credit reduction scenario and a full credit elimination scenario, with probability weights assigned based on current legislative outlook.
Interest rate sensitivity is acute for project finance. A 100 basis point (1 percentage point) increase in project debt rates reduces levered equity IRR by approximately 150-200 basis points on a typical utility-scale project, assuming fixed PPA pricing. Floating-rate debt structures amplify this sensitivity.
Module price deflation is a double-edged variable: it reduces capex for new projects (positive for IRR) but compresses margins for domestic manufacturers (negative for 45X PTC economics if ASPs fall faster than cost reductions).
For a structured approach to modeling these sensitivities, EFM’s Start Up Solar Farm Excel Model and Valuation includes built-in sensitivity tables for all four risk dimensions.
Frequently Asked Questions
What is the current market size of the U.S. solar energy industry and how fast is it growing?
The U.S. solar power generation industry is valued at $46.8 billion in 2026, according to IBISWorld. It grew at a CAGR of 25.3% between 2021 and 2026, which is approximately 11 times the pace of nominal GDP growth over the same period. To project forward, analysts typically apply scenario-based CAGR assumptions: a base case of 12-15% (reflecting some normalization as the market matures), a bull case of 20-25% (if IRA incentives remain intact and data center demand accelerates), and a bear case of 6-8% (if interest rates rise sharply or IRA credits are curtailed). At the base case 13% CAGR, the market reaches approximately $86 billion by 2031.
How does the Inflation Reduction Act affect solar project returns?
The IRA provides a 30% base investment tax credit (ITC) for solar projects placed in service after January 1, 2023. Projects meeting domestic content requirements (a specified percentage of steel, iron, and manufactured components sourced from the U.S.) qualify for an additional 10% adder, bringing the effective ITC to 40%. For a $90 million utility-scale project, the 30% ITC generates $27 million in tax credits, reducing the equity requirement from $27 million to approximately $0 when fully monetized through a tax equity partnership. The 45X Production Tax Credit adds $0.04 per watt for domestic module manufacturers, generating $40 million annually for a 1 GW facility. These two mechanisms together can improve project IRR by 300-500 basis points compared to pre-IRA economics.
What is a power purchase agreement (PPA) and why does its market share matter for investors?
A power purchase agreement (PPA) is a long-term contract between a solar project developer and an electricity buyer (utility, corporation, or government entity), specifying a fixed or escalating price per MWh of electricity delivered over 10-25 years. PPAs matter for investors because they convert merchant power price risk into contracted cash flows, enabling project finance debt sizing and reducing equity risk. Solar’s share of new PPAs is projected to climb from 12% to 43% by 2031, meaning solar will capture nearly half of all new long-term power contracts in the U.S. This expansion directly increases the addressable market for utility-scale developers and improves the bankability of new projects by providing lenders with contracted revenue certainty.
How do data centers drive demand for utility-scale solar specifically?
Data centers require large, reliable, 24/7 electricity supply and face increasing pressure from corporate sustainability commitments to source that power from renewables. U.S. data center electricity load is projected to more than triple to 580 TWh by 2031. At a 30% solar supply share of incremental data center demand, this implies over 100 GW of new solar capacity required just for this one demand segment. Hyperscalers like Microsoft, Google, and Amazon have signed multi-GW solar PPAs in recent years, and these contracts are investment-grade credits with 15-20 year terms. For project finance analysts, a hyperscaler PPA allows debt sizing at 75-80% LTV versus 65-70% for a utility offtaker, directly improving levered equity returns by 150-250 basis points.
What are the main financial metrics used to evaluate utility-scale solar investments?
The four primary metrics are: (1) Unlevered project IRR, typically 8-12% for U.S. utility-scale solar in 2026, measuring return on total project capital before debt; (2) Levered equity IRR, typically 12-18%, measuring return on the equity check after debt and tax equity financing; (3) NPV at the project WACC (usually 6-8%), which should be positive for viable projects; and (4) DSCR (debt service coverage ratio), which lenders require to be at least 1.30x, meaning project cash flow must exceed debt payments by 30%. A project with $5.72 million EBITDA and $4.40 million debt service has a DSCR of 1.30x, exactly at the minimum threshold. Sensitivity analysis should show DSCR remains above 1.10x under stress scenarios.
How fragmented is the U.S. solar market and what does that mean for M&A activity?
With 1,380 businesses operating in U.S. solar power generation in 2026, the market is highly fragmented relative to its $46.8 billion scale. For comparison, the U.S. electric utility sector has fewer than 200 investor-owned utilities serving a much larger revenue base. This fragmentation creates a compelling consolidation opportunity: well-capitalized acquirers can purchase development pipelines from undercapitalized regional developers at 10-30% discounts to fully-permitted project value, then apply centralized procurement and project finance expertise to improve returns. Private equity firms have been active in this space, with platform acquisitions of 3-7 regional developers followed by operational integration and eventual portfolio sale or IPO.
What macroeconomic conditions support or threaten the 2026-2031 solar growth outlook?
The Congressional Budget Office projects 2.2% real GDP growth in 2026, a moderate expansion that supports corporate capital budgets and utility investment programs without generating the inflationary pressure that drove construction cost increases in 2021-2023. The primary macroeconomic threats to the solar outlook are: (1) a recession scenario (GDP contraction) that delays corporate PPA commitments and utility capex; (2) a high-inflation scenario that increases construction labor and materials costs, compressing project margins; and (3) a rising interest rate scenario, where each 100 basis point increase in project debt rates reduces levered equity IRR by approximately 150-200 basis points. The base case 2.2% GDP growth environment is broadly supportive, but investors should model all three stress scenarios explicitly in their financial models.
Conclusion
The U.S. solar market’s $46.8 billion scale, 25.3% historical CAGR, and structural demand tailwinds from data center electrification and IRA manufacturing incentives make it one of the most compelling infrastructure investment themes of the 2026-2031 period. The three-segment framework, utility-scale projects, residential installations, and domestic manufacturing, each requires distinct financial modeling approaches, return benchmarks, and risk frameworks. Investors who apply rigorous NPV, IRR, and sensitivity analysis to each segment will identify the highest-conviction opportunities within a market that is simultaneously large, growing, and still fragmented enough to reward analytical differentiation.
I recommend downloading the USA Solar Energy Market Study 2026-2031 to access the full dataset, capacity forecasts, and competitive analysis underpinning the investment thesis outlined here. For building investment-grade cash flow projections, pair it with EFM’s Solar Energy Financial Model to incorporate IRA incentives, PPA pricing scenarios, and grid interconnection timelines into your 2026-2031 pipeline analysis.
























































