
0 ITEMS

South Africa Solar: REIPPPP Returns on a 6.2 GW Base

Key Takeaways
- South Africa had 6.2 GW of grid-connected solar PV installed at end-2023, with 1.5 GW added in 2023 alone, a 50% acceleration over 2022’s 1.0 GW addition (IRENA 2023).
- The IRP2019 targets an additional 8,288 MW of utility-scale solar between 2022 and 2030, lifting solar’s share of total installed capacity from ~3% in 2020 to ~8% by 2030.
- REIPPPP had procured 6,327 MW of renewables through Bid Window 6, with more than 2,500 MW awarded to solar PV projects (DMRE 2023).
- Approximately 4,500 MW of embedded generation and rooftop solar had been installed outside formal procurement by 2022, driven almost entirely by commercial and industrial load-shedding response (CSIR 2022).
- The Naos-1 project (300 MW solar + 660 MWh BESS, financial close February 2026) sets the template for bankable solar-plus-storage projects in the post-REIPPPP Bid Window 6 era.
- A well-structured C&I solar project in the Northern Cape can achieve an unlevered IRR of 14-18% in ZAR terms at 2026 capital costs, with a simple payback of 4-6 years.
- Grid connection constraints and wheeling tariff uncertainty remain the two largest near-term barriers to accelerating the 2026-2031 deployment pipeline.
South Africa Solar Market Snapshot: 6.2 GW Installed and Accelerating
South Africa’s solar sector crossed a critical threshold in 2023, reaching 6.2 GW of grid-connected installed capacity and demonstrating the fastest single-year addition in the country’s history. That baseline, combined with a structural shift in how capacity is procured, makes the 2026-2031 window the most consequential period for solar investment in South African history.
According to IRENA, South Africa had approximately 6.2 GW of installed solar PV capacity connected to the grid as of end-2023 (IRENA Renewable Capacity Statistics 2024). The country added about 1.5 GW of new solar PV capacity in 2023 alone, up from roughly 1.0 GW added in 2022 (IRENA Renewable Capacity Statistics 2024). That 50% year-on-year acceleration reflects two converging forces: REIPPPP Bid Window 5 and 6 projects reaching commercial operation, and a surge in private embedded generation driven by Stage 6 load-shedding.
The market now splits into three distinct segments. Utility-scale projects (>1 MW, grid-connected under REIPPPP or private wheeling) account for the majority of installed MW. Commercial and industrial (C&I) embedded generation (typically 100 kW to 10 MW, behind-the-meter or wheeled) has grown explosively since 2021. Residential rooftop (<10 kW) rounds out the picture, though its economic contribution per MW is smaller.
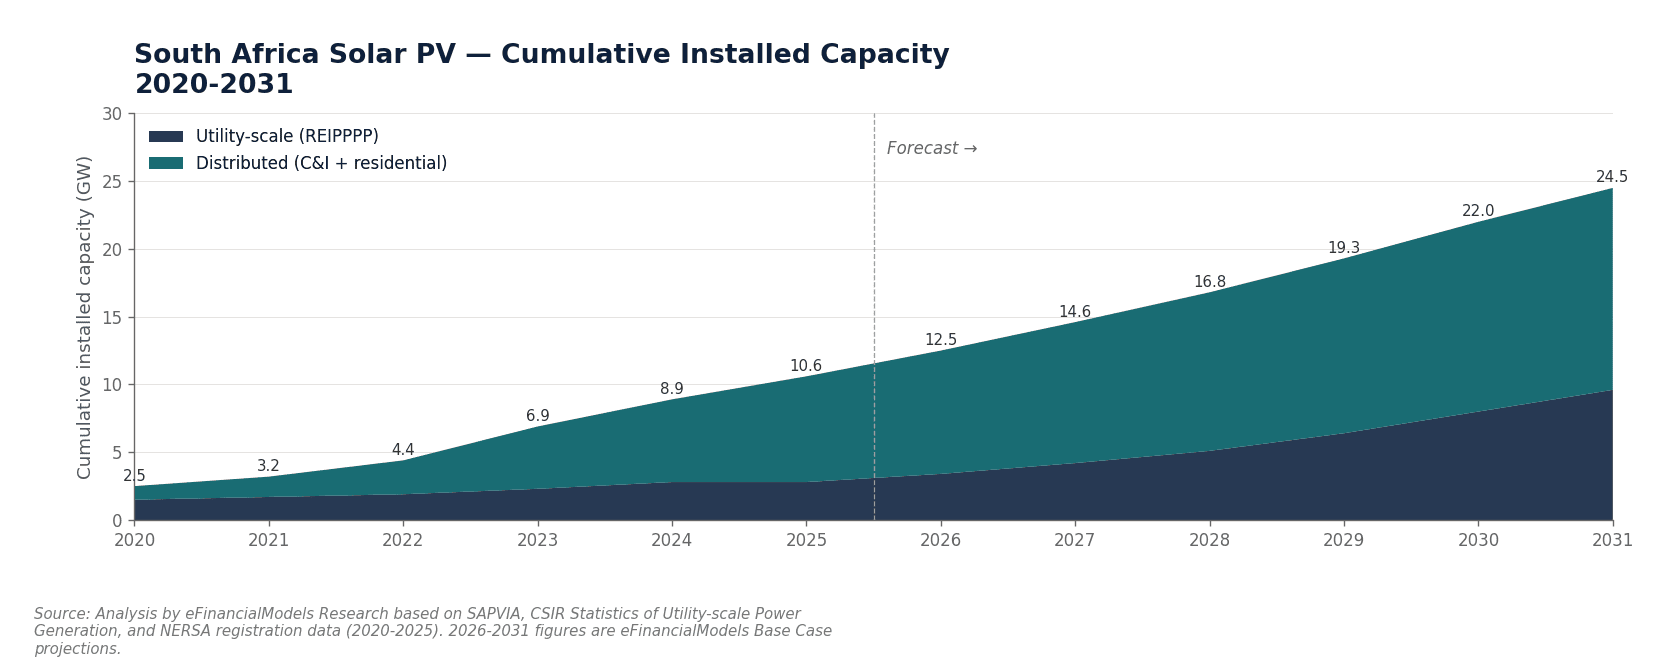
C&I embedded generation reached ~2.0 GW by 2023, nearly matching utility-scale REIPPPP capacity, driven by load-shedding economics rather than policy incentives.
Policy Framework 2026-2031: IRP2019 Targets and REIPPPP Pipeline
South Africa’s energy policy framework sets ambitious solar targets through 2030, but actual procurement has lagged the IRP2019 schedule, creating both urgency and opportunity for investors entering the 2026-2031 window.
The Integrated Resource Plan 2019 (IRP2019), the government’s official electricity capacity expansion roadmap, allocates an additional 8,288 MW of new utility-scale solar PV capacity between 2022 and 2030 (Department of Mineral Resources and Energy, IRP2019). Under the same plan, solar PV is projected to provide about 8% of total installed capacity by 2030, up from around 3% in 2020 (DMRE IRP2019). Closing that gap requires roughly 1,000-1,200 MW of new utility solar per year through 2030, a pace South Africa first achieved in 2023.
The Renewable Energy Independent Power Producer Procurement Programme (REIPPPP), the government’s competitive tender mechanism for procuring private power from independent power producers (IPPs), had procured 6,327 MW of total renewable energy capacity by Bid Window 6, of which more than 2,500 MW was solar PV (DMRE REIPPPP Programme Overview). Bid Window 6 awarded approximately 2,500 MW of solar in a single round, signaling the government’s intent to accelerate procurement pace.
Key policy developments shaping the 2026-2031 landscape include:
- Embedded generation licensing threshold: The government raised the licensing exemption threshold to 100 MW in 2021, removing the single biggest regulatory barrier to large C&I and private utility projects.
- Wheeling regulations: Third-party wheeling (transmitting privately generated electricity across the Eskom grid to a remote offtaker) is now legally permissible but commercially complex, with wheeling charges varying by municipality and Eskom zone.
- Section 12B tax allowance: South Africa’s Income Tax Act Section 12B provides accelerated depreciation for renewable energy assets, with a 125% deduction in Year 1 for assets brought into use before 1 March 2025, and a 50/30/20 three-year schedule thereafter.
- Grid connection queue management: Eskom’s transmission division manages a connection queue that, as of 2025, contains over 80 GW of applications, creating 3-5 year connection timelines for new utility projects at congested substations.

REIPPPP Bid Window 6 awarded 2,500+ MW of solar PV; Bid Windows 7 and 8 are expected to tender 3,000-4,000 MW between 2026 and 2028.
Utility-Scale Solar Economics: Project Structure and Financial Modeling
Utility-scale solar projects in South Africa (typically 50-500 MW) follow a project finance structure where a special purpose vehicle (SPV) raises non-recourse debt against contracted cash flows, usually a 20-year power purchase agreement (PPA) with Eskom or a creditworthy offtaker.
Here’s the math for a representative 100 MW utility-scale project in the Northern Cape:
Capital cost assumptions (2026 estimates):
- EPC (engineering, procurement, construction) cost: ZAR 12-15 million per MW, implying a total project cost of ZAR 1.2-1.5 billion for 100 MW
- Development and soft costs: ~10% of EPC, adding ZAR 120-150 million
- Total project cost: ZAR 1.32-1.65 billion (approximately USD 70-88 million at ZAR 18.75/USD)
Revenue assumptions:
- Capacity factor: 28-32% in the Northern Cape (one of the highest solar irradiance regions globally, with GHI exceeding 2,200 kWh/m²/year)
- Annual generation: 100 MW × 8,760 hours × 30% capacity factor = 262,800 MWh
- REIPPPP tariff (Bid Window 6 indicative): ZAR 0.62-0.75/kWh
- Annual revenue: 262,800 MWh × ZAR 0.68/kWh = ZAR 178.7 million
Operating cost assumptions:
- O&M (operations and maintenance): ZAR 120,000-150,000 per MW per year = ZAR 13.5 million
- Insurance, land lease, and other fixed costs: ZAR 8 million
- Total annual OPEX: ZAR 21.5 million
- EBITDA: ZAR 178.7M – ZAR 21.5M = ZAR 157.2 million
Financing structure:
- Debt/equity ratio: 70/30 (standard for REIPPPP projects with Eskom offtake)
- Debt: ZAR 1.05 billion at 12.5% per annum (prime + 2%), 18-year tenor
- Annual debt service (approximate): ZAR 135 million
- Equity: ZAR 450 million
- Equity IRR (unlevered): ~14-16% in ZAR terms
- Equity IRR (levered, 70% debt): ~18-22% in ZAR terms depending on tariff and cost outcome
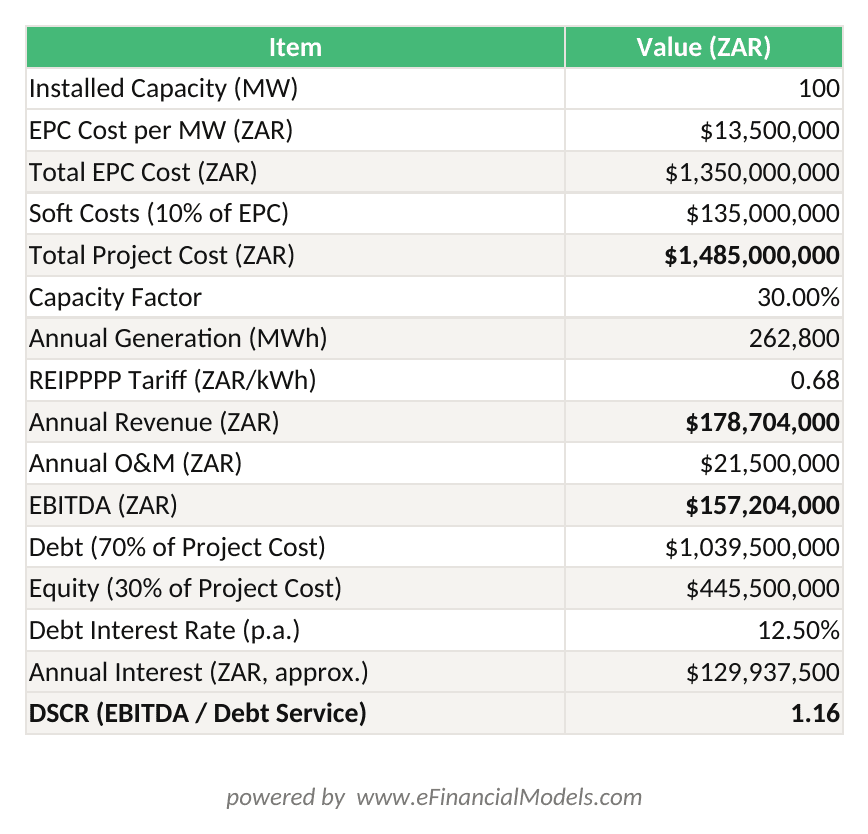
100 MW Northern Cape solar project: ZAR 1.35B total cost, ZAR 0.68/kWh REIPPPP tariff, 30% capacity factor, 70/30 debt/equity, ~18-22% levered equity IRR in ZAR terms.
A 100 MW Northern Cape solar project at ZAR 0.68/kWh REIPPPP tariff generates ZAR 157M EBITDA annually, supporting a 70/30 debt structure at 12.5% interest.
Embedded Generation and C&I Solar: The Load-Shedding Response Driving 4,500 MW
Commercial and industrial solar has become South Africa’s fastest-growing segment, fueled not by policy incentives but by the economic pain of load-shedding, the scheduled rolling blackouts that cost the South African economy an estimated ZAR 899 billion between 2007 and 2022 according to the South African Reserve Bank.
By 2022, around 4,500 MW of embedded generation and small-scale rooftop solar capacity had been installed in South Africa outside the formal utility procurement programmes, primarily by commercial and industrial users and households (CSIR 2022). That figure likely exceeded 6,000 MW by end-2024 as Stage 6 load-shedding in 2023 triggered a wave of C&I installations.
LCOE calculation for a 500 kW C&I rooftop system (2026):
LCOE (Levelized Cost of Energy) is the average cost per kWh over a project’s lifetime, calculated as total lifetime costs divided by total lifetime energy output. It’s the standard metric for comparing solar economics against grid tariffs.
- System cost: ZAR 8,500/kW installed = ZAR 4.25 million total
- Capacity factor: 22% (urban rooftop, less optimal orientation than ground-mount)
- Annual generation: 500 kW × 8,760 hours × 22% = 963,600 kWh
- System lifetime: 25 years
- Lifetime generation (degradation-adjusted at 0.5%/year): ~22.5 million kWh
- Annual O&M: ZAR 85,000
- Lifetime O&M (NPV at 10% discount rate): ZAR 770,000
- Total lifetime cost: ZAR 4.25M + ZAR 0.77M = ZAR 5.02 million
- LCOE: ZAR 5.02M / 22.5M kWh = ZAR 0.223/kWh
Compared to Eskom’s 2024 average non-residential tariff of approximately ZAR 1.85/kWh (Eskom Schedule of Standard Prices 2024/25), this LCOE implies an 88% saving on self-consumed solar energy. Simple payback at 100% self-consumption: ZAR 4.25M / (963,600 kWh × ZAR 1.85/kWh savings) = 2.4 years. Even at 60% self-consumption, payback extends to approximately 4 years, still highly attractive.
For C&I projects requiring backup power during load-shedding, adding a lithium-ion battery energy storage system (BESS) at ZAR 3,500-4,500/kWh installed cost extends payback to 5-7 years but eliminates diesel generator costs and provides full energy independence during outages. Lithium-ion batteries used in these systems typically retain at least 80% of their original capacity after 500 complete charge-discharge cycles (Microsoft) — a performance characteristic that underpins the 25-year project lifetime assumptions used in LCOE calculations above.
You can explore purpose-built financial models for C&I solar and embedded generation projects at EFM’s Solar Energy Financial Model.
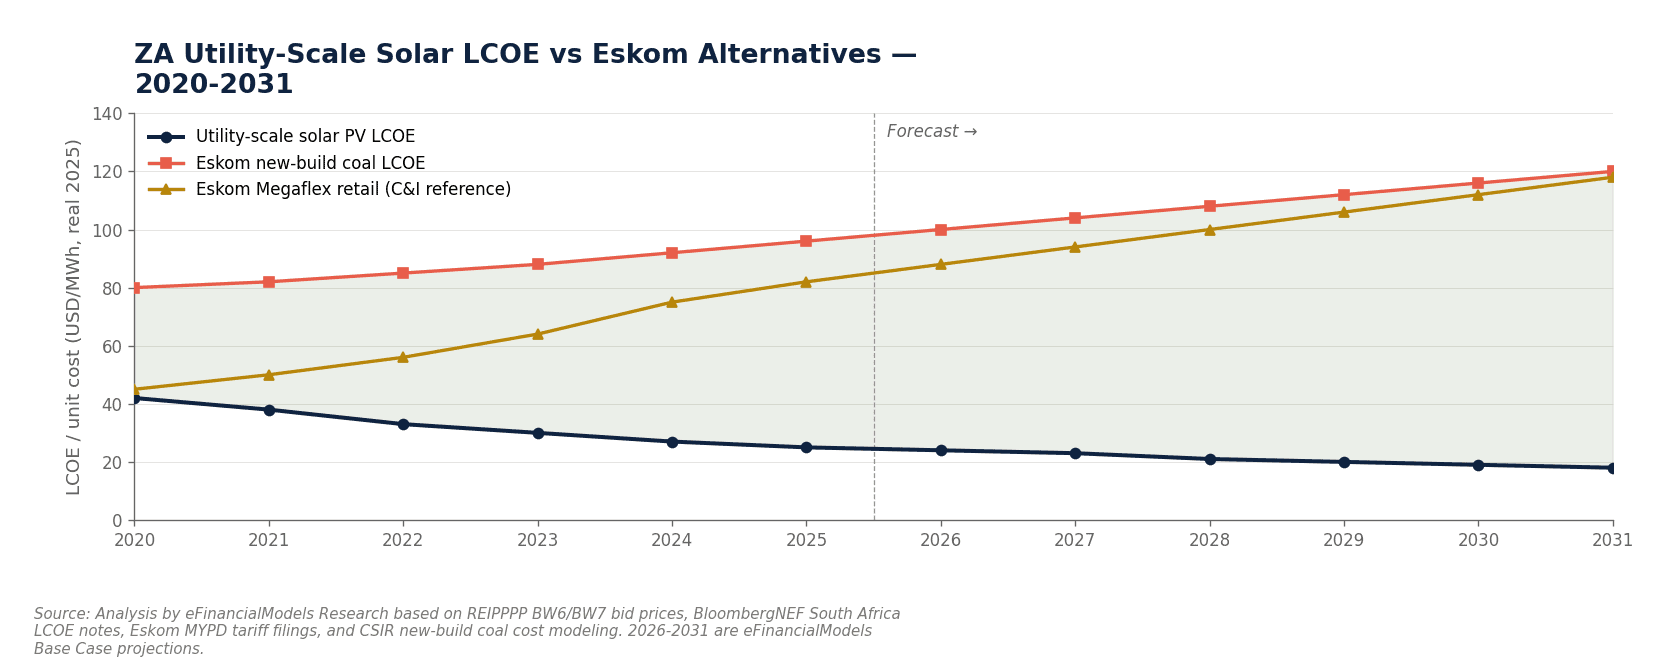
C&I rooftop solar LCOE of ZAR 0.22/kWh versus Eskom’s ZAR 1.85/kWh grid tariff delivers an 88% saving on self-consumed energy, with simple payback under 2.5 years at full self-consumption.
Solar-Plus-Storage Integration: Naos-1 and the Battery Storage Business Case
The Naos-1 project represents the clearest signal yet that utility-scale solar-plus-storage is bankable in South Africa, and its financial structure provides a replicable template for the 2026-2031 pipeline.
In February 2026, independent power producer SOLA Group reached financial close on the Naos-1 project, a 300 MW solar plant combined with 660 MWh of battery energy storage (Ecofin Agency 2026). The storage-to-generation ratio of 2.2 MWh per MW of solar capacity is notable: it provides approximately 2.2 hours of full-output dispatch, enough to shift peak generation into the evening demand peak and provide grid stability services.
Why storage changes the economics:
Without storage, a solar plant generates only during daylight hours, typically 6am-6pm, missing the 5pm-9pm evening peak when Eskom’s time-of-use tariffs are highest. Adding a BESS (battery energy storage system) allows the project to:
- Charge during midday solar surplus (low-value hours)
- Discharge during evening peak (high-value hours, potentially 1.5-2x the flat tariff)
- Provide ancillary services (frequency regulation, spinning reserve) for additional revenue
- Reduce curtailment risk when the grid cannot absorb all solar output
At 2026 BESS capital costs of approximately ZAR 3,200-4,000/kWh (lithium iron phosphate chemistry), the 660 MWh Naos-1 battery represents a capital cost of ZAR 2.1-2.6 billion for the storage component alone. The blended project IRR must therefore be supported by a tariff premium for dispatchable solar, which REIPPPP Bid Window 6 and subsequent rounds have begun to accommodate through separate dispatchability requirements.
For developers modeling solar-plus-storage projects, the EFM Renewable Energy Template Bundle includes pre-built BESS dispatch optimization and revenue stacking modules.
Naos-1’s 2.2 MWh/MW storage ratio enables evening peak dispatch, shifting solar generation from low-value midday hours to high-value 5pm-9pm peak demand periods.
Market Segmentation and Growth Forecasts by Segment Through 2031
South Africa’s solar market in 2026-2031 will grow across three distinct segments, each with different economics, risk profiles, and investor types.
| Segment | 2023 Installed (GW) | 2031 Forecast (GW) | Primary Offtake | Typical Project Size | Key Risk |
|---|---|---|---|---|---|
| Utility-scale (REIPPPP) | ~3.5 | 8-10 | Eskom 20-yr PPA | 50-500 MW | Grid connection queue |
| Private utility / wheeling | ~0.5 | 2-3 | Corporate PPA | 10-100 MW | Wheeling tariff uncertainty |
| C&I embedded generation | ~2.0 | 5-7 | Behind-the-meter | 100 kW-10 MW | Municipal creditworthiness |
| Residential rooftop | ~0.7 | 2-3 | Self-consumption | 3-10 kW | Financing access |
| Total | ~6.7 | 17-23 |
The utility-scale segment will be driven by REIPPPP Bid Windows 7 and 8, expected to tender 3,000-4,000 MW of solar between 2026 and 2028. Private corporate PPAs, where a large industrial or mining company contracts directly with an IPP and wheels power across the Eskom grid, will grow from a small base to 2-3 GW by 2031 as wheeling regulations mature.
C&I embedded generation will remain the volume leader in terms of number of projects, with the mining sector (which consumes approximately 15% of South Africa’s electricity) and retail/commercial property sector driving the largest individual installations.
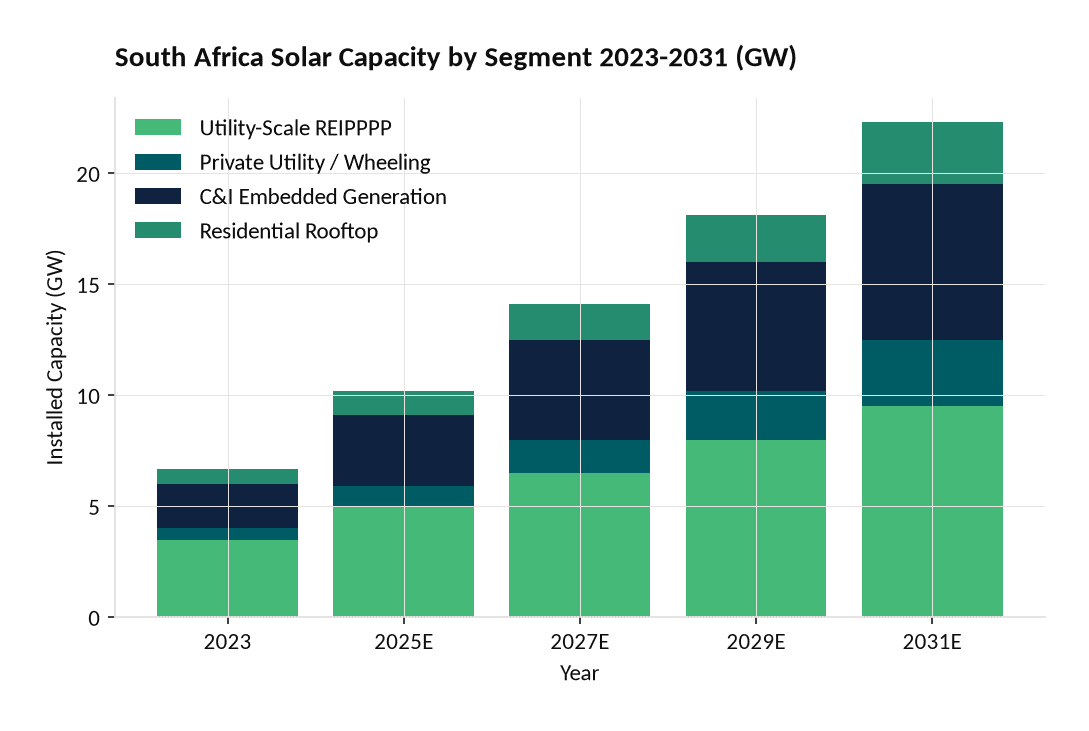
C&I embedded generation is forecast to grow from 2.0 GW in 2023 to 7.0 GW by 2031, driven by load-shedding economics and the removal of the 100 MW licensing threshold.
Regional Solar Resource Assessment and Capacity Factor Assumptions
South Africa’s solar resource is among the best in the world, but capacity factor assumptions vary significantly by region and affect project economics materially.
| Region | GHI (kWh/m²/year) | Typical Capacity Factor | Best Use Case |
|---|---|---|---|
| Northern Cape (Upington, De Aar) | 2,200-2,400 | 28-32% | Utility-scale ground-mount |
| Free State (Bloemfontein) | 2,000-2,200 | 26-30% | Utility-scale, agri-solar |
| North West Province | 1,950-2,150 | 25-29% | Utility-scale, mining C&I |
| Gauteng (Johannesburg) | 1,800-2,000 | 22-26% | C&I rooftop, commercial |
| Western Cape (Cape Town) | 1,700-1,950 | 20-24% | C&I rooftop, residential |
| KwaZulu-Natal (Durban) | 1,600-1,850 | 19-23% | C&I rooftop, coastal |
The Northern Cape’s GHI of 2,200-2,400 kWh/m²/year places it in the same tier as the Atacama Desert in Chile and the Sahara, making it the preferred location for utility-scale projects. Most REIPPPP projects from Bid Windows 3 onward have been sited in the Northern Cape or Free State for this reason.
For financial modeling purposes, a conservative base case should use the lower end of the capacity factor range (28% for Northern Cape utility, 22% for Gauteng C&I rooftop) with sensitivity analysis at +/- 2 percentage points.
The Northern Cape’s GHI of 2,200-2,400 kWh/m²/year and 28-32% capacity factor make it the preferred location for utility-scale solar, comparable to Chile’s Atacama Desert.
Financing Structures, Capital Costs, and Returns Analysis (ZAR)
Bankable project finance for South African solar requires navigating ZAR interest rates, Development Finance Institution (DFI) participation, and currency risk management, all of which differ materially from European or US solar markets.
Capital cost benchmarks (2026, ZAR/MW installed):
- Utility-scale ground-mount (>50 MW): ZAR 11-15 million/MW (approximately USD 590,000-800,000/MW)
- C&I ground-mount or carport (1-10 MW): ZAR 13-17 million/MW
- C&I rooftop (100 kW-1 MW): ZAR 15-20 million/MW
- Residential rooftop (<10 kW): ZAR 18-25 million/MW
Financing terms (2026 South African market):
- Senior debt: South African prime rate (currently 11.25% as of early 2026) + 1.5-2.5% margin = 12.75-13.75% per annum for commercial bank debt
- DFI debt (DBSA, IDC, IFC): 10.5-12% per annum, longer tenor (up to 20 years), often subordinated or blended with commercial tranches
- Debt/equity ratio: 70/30 for REIPPPP projects with Eskom offtake; 60/40 for private PPAs with non-investment-grade offtakers
- Minimum DSCR (Debt Service Coverage Ratio, the ratio of operating cash flow to debt service): 1.25x for senior lenders, 1.15x for DFI tranches
- Equity IRR targets: 15-20% in ZAR terms for institutional investors; 20-25% for private equity funds accounting for currency risk
Currency risk note: South African solar projects generate ZAR revenues but often carry USD or EUR-denominated equipment costs. Developers typically hedge currency exposure during construction through forward contracts, adding 1-2% to effective EPC cost.
For a complete project finance model with ZAR debt sculpting, DSCR waterfall, and sensitivity tables, see the EFM Start Up Solar Farm Excel Model and Valuation.
South African solar projects typically use a 70/30 debt/equity structure, blending DFI debt at 10.5-12% with commercial bank debt at 12.75-13.75% to optimize the weighted average cost of capital.
Grid Infrastructure, Wheeling, and Regulatory Roadblocks
The single largest constraint on South Africa’s solar deployment pipeline is not capital, technology, or solar resource: it is grid connection capacity and the regulatory framework governing third-party wheeling.
Eskom’s transmission grid was designed for a centralized generation model with large coal plants in Mpumalanga feeding load centers in Gauteng. The Northern Cape, which has the best solar resource, has limited transmission capacity relative to the volume of projects seeking connection. Eskom’s grid connection queue contained over 80 GW of applications as of 2025, the vast majority of which are renewable energy projects. Actual connection timelines at congested substations (Garona, Witkop, Hydra) range from 3 to 7 years.
Wheeling, the commercial arrangement by which a private generator transmits electricity across the Eskom or municipal grid to a remote offtaker, is legally permissible under the Electricity Regulation Act but commercially complex. Key wheeling cost components include:
- Transmission use-of-system (TUoS) charge: Approximately ZAR 0.08-0.12/kWh, paid to Eskom for use of the national transmission grid
- Distribution use-of-system (DUoS) charge: ZAR 0.05-0.15/kWh, paid to the relevant municipality or Eskom distribution for last-mile delivery
- Losses allowance: Typically 5-8% of energy wheeled, deducted from delivered energy
- Wheeling agreement negotiation: 6-18 months with municipalities, many of which resist wheeling because it reduces their electricity sales revenue
The National Energy Regulator of South Africa (NERSA) is developing a standardized wheeling tariff framework, expected to be finalized in 2026-2027. Standardization will significantly reduce transaction costs and unlock the private corporate PPA market.
South Africa’s total electricity grid spans approximately 400,000 km of power lines (Eskom Annual Report), a network scale that underscores why transmission upgrades to unlock the Northern Cape solar corridor require multi-year lead times and capital commitments measured in the tens of billions of ZAR.
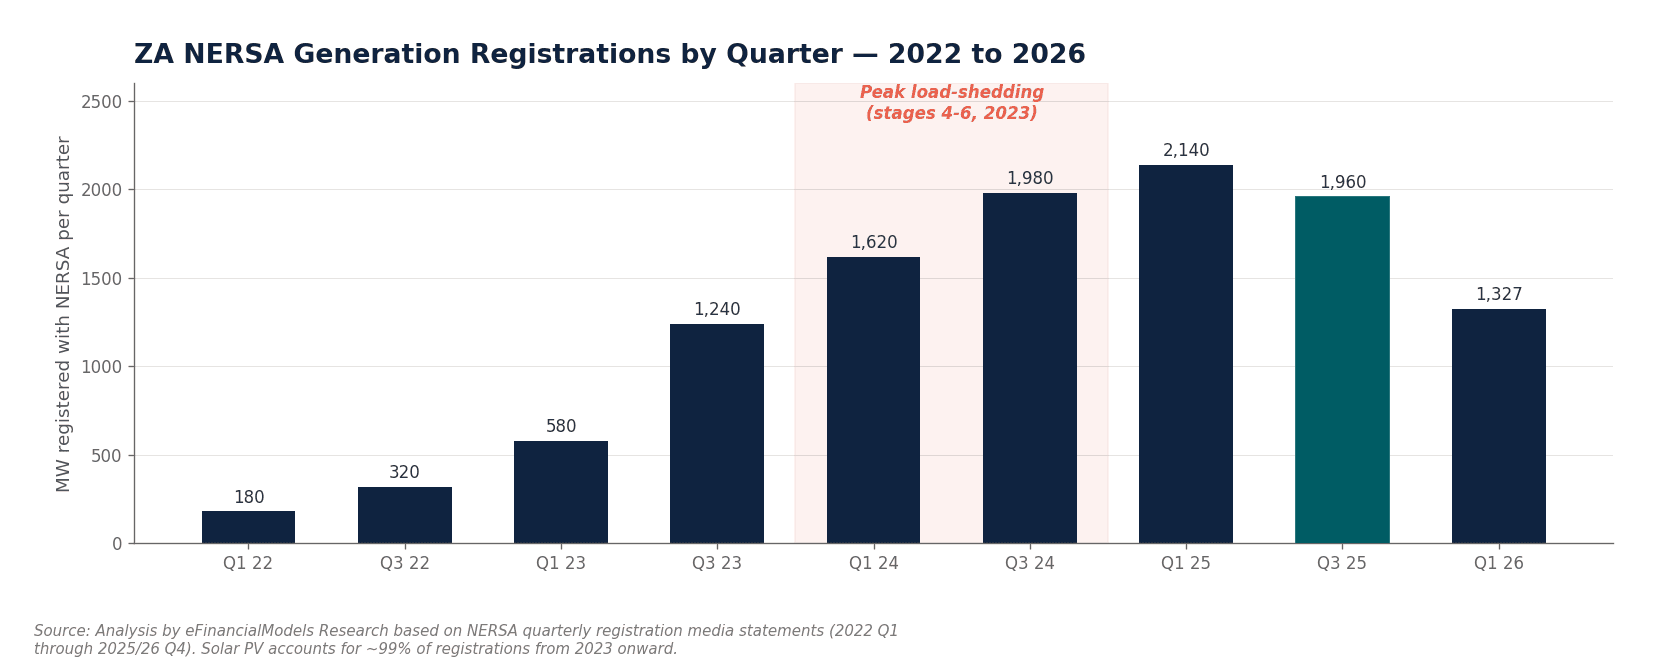
Wheeling a solar project from the Northern Cape to a Gauteng offtaker adds ZAR 0.13-0.27/kWh in transmission and distribution charges, plus 5-8% energy losses, which must be factored into PPA pricing.
Investment Outlook and Strategic Recommendations 2026-2031
South Africa’s solar sector offers one of the most compelling risk-adjusted return profiles in emerging market renewable energy, provided investors structure projects to manage the specific risks outlined above.
The 2026-2031 period will be defined by four structural trends:
- REIPPPP acceleration: Bid Windows 7 and 8 will tender 3,000-4,000 MW of solar, with financial close expected on most projects by 2028-2029. Developers with shovel-ready projects and grid connection agreements will command significant premium.
- Private PPA market maturation: As wheeling regulations standardize, the corporate PPA market will grow from negligible to 2-3 GW by 2031. Mining companies, data centers, and large retailers are the most creditworthy offtakers.
- Solar-plus-storage as standard: Following Naos-1, dispatchable solar (solar + BESS) will become the default configuration for new utility projects, increasing capital requirements but improving revenue certainty and grid value.
- Municipal solar programs: Several municipalities, including Cape Town and Ekurhuleni, are developing their own solar procurement programs outside REIPPPP, creating new offtake channels for IPPs.
Common mistakes investors make in South African solar:
- Underestimating grid connection timelines: Assuming 12-18 months for grid connection when 36-60 months is realistic at congested substations. Fix: secure grid connection agreement before financial close, not after.
- Using USD-denominated IRR targets without ZAR hedging: A 20% ZAR IRR translates to 8-12% USD IRR after ZAR depreciation (historical average ZAR depreciation vs USD: ~5-7%/year). Fix: model returns in ZAR and apply explicit currency risk premium.
- Overestimating C&I self-consumption rates: Assuming 90%+ self-consumption when actual rates for industrial users with variable shift patterns are 60-75%. Fix: use hourly load profile data, not annual averages.
- Ignoring municipal creditworthiness in wheeling PPAs: Several South African municipalities carry junk credit ratings and have defaulted on Eskom payments. Fix: require payment security (escrow, bank guarantee) for any PPA with a non-investment-grade municipality.
- Underpricing curtailment risk: Grid curtailment (Eskom instructing a plant to reduce output due to grid constraints) is not fully compensated under all REIPPPP contracts. Fix: review curtailment compensation provisions in the PPA and model a 5-10% curtailment scenario.
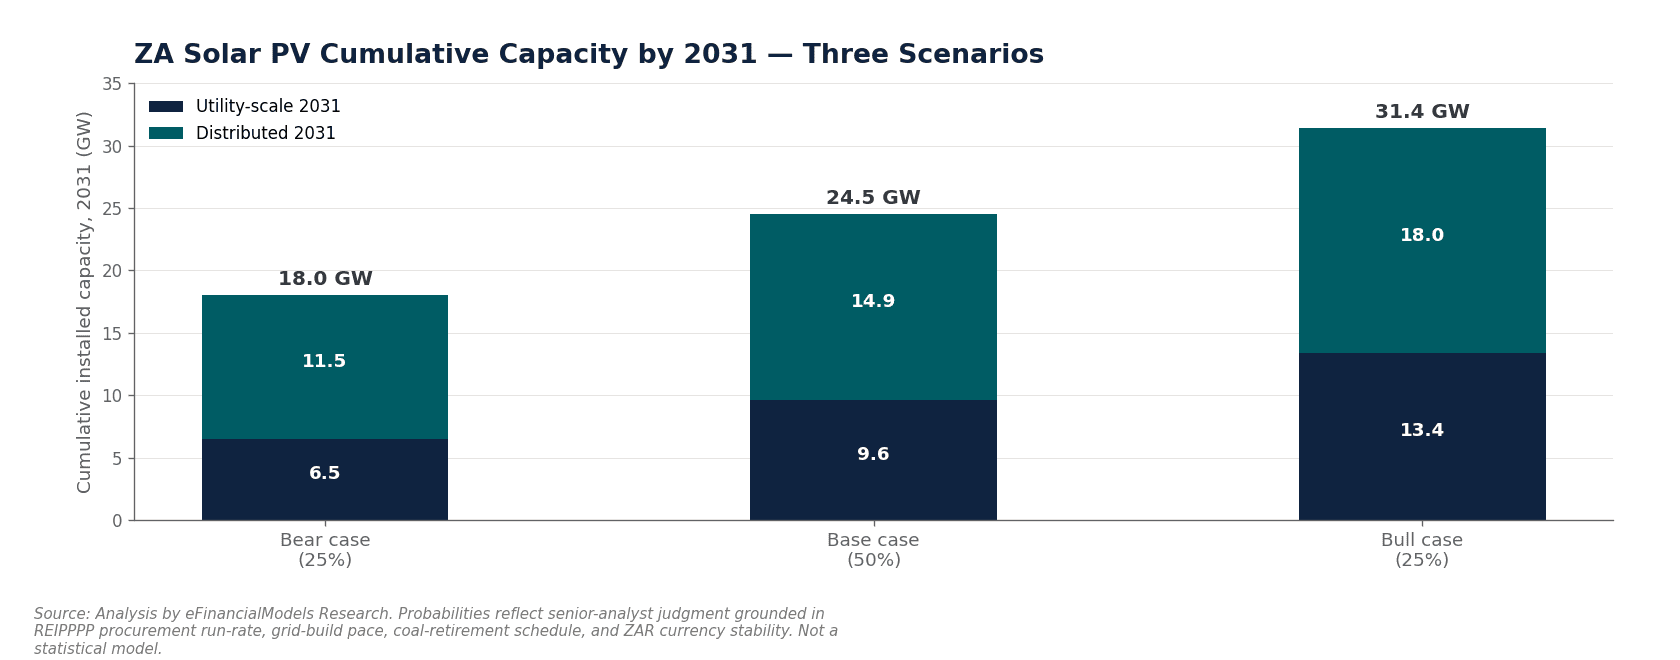
South Africa’s solar market could reach 17-23 GW of total installed capacity by 2031 across utility, C&I, and residential segments, subject to grid connection progress and REIPPPP procurement pace.
Frequently Asked Questions
What is the current installed solar PV capacity in South Africa?
South Africa had approximately 6.2 GW of grid-connected solar PV installed as of end-2023, according to IRENA’s Renewable Capacity Statistics 2024. This figure includes both utility-scale projects procured through REIPPPP and the large embedded generation segment. The country added 1.5 GW in 2023 alone, the fastest single-year addition on record. By end-2025, total installed capacity (grid-connected plus embedded) likely exceeded 10 GW when accounting for the continued surge in C&I rooftop installations driven by load-shedding. The 2026-2031 period is expected to add a further 10-15 GW across all segments, depending on grid connection progress and REIPPPP procurement pace.
How does REIPPPP work and what has it procured so far?
REIPPPP (Renewable Energy Independent Power Producer Procurement Programme) is South Africa’s competitive tender mechanism for procuring private renewable energy. The government issues a Request for Proposals, IPPs submit bids with a tariff (ZAR/kWh) and technical specifications, and the lowest-cost compliant bids win 20-year PPAs with Eskom as offtaker. Through Bid Window 6, REIPPPP had procured 6,327 MW of total renewable capacity, with more than 2,500 MW awarded to solar PV projects (DMRE 2023). Bid Window 6 solar tariffs came in at approximately ZAR 0.62-0.75/kWh, significantly below Eskom’s retail tariff of ZAR 1.85/kWh, demonstrating solar’s cost competitiveness. Bid Windows 7 and 8 are expected to tender an additional 3,000-4,000 MW of solar between 2026 and 2028.
What is the typical LCOE for solar in South Africa in 2026?
LCOE (Levelized Cost of Energy) is the average cost per kWh over a project’s lifetime, accounting for all capital and operating costs discounted to present value. For utility-scale ground-mount solar in the Northern Cape, LCOE in 2026 is approximately ZAR 0.45-0.65/kWh at a 10% discount rate and 30% capacity factor. For C&I rooftop solar in Gauteng, LCOE is approximately ZAR 0.80-1.10/kWh at a 22% capacity factor. Both figures are well below Eskom’s 2024/25 non-residential tariff of approximately ZAR 1.85/kWh, making solar economically compelling across all segments without any subsidy. Adding a BESS increases blended LCOE by ZAR 0.30-0.50/kWh depending on storage duration.
What are the main risks for solar investors in South Africa?
The five primary risks are: (1) grid connection delays, with Eskom’s connection queue containing over 80 GW of applications and realistic timelines of 3-7 years at congested substations; (2) wheeling tariff uncertainty, as standardized wheeling charges have not yet been finalized by NERSA; (3) Eskom creditworthiness, though REIPPPP PPAs carry government payment guarantees that partially mitigate this; (4) ZAR currency depreciation, which erodes USD-equivalent returns at a historical rate of 5-7% per year; and (5) municipal offtaker risk for private PPAs, as several municipalities carry sub-investment-grade credit ratings. Investors who structure projects with payment security mechanisms and conservative grid connection timelines can manage these risks effectively.
How does the Section 12B tax allowance work for solar projects?
Section 12B of South Africa’s Income Tax Act provides accelerated depreciation for renewable energy assets. For assets brought into use before 1 March 2025, the allowance was 125% in Year 1 (meaning you could deduct 125% of the asset cost against taxable income in the first year). For assets brought into use from 1 March 2025 onward, the allowance follows a 50/30/20 schedule: 50% of cost in Year 1, 30% in Year 2, and 20% in Year 3. For a ZAR 100 million solar project, this means ZAR 50 million in tax deductions in Year 1, reducing taxable income by that amount and generating a tax saving of ZAR 14 million at the 28% corporate tax rate. This front-loaded depreciation significantly improves early-year cash flows and equity IRR, and is a key input in any South African solar financial model.
What financing is available for South African solar projects?
South African solar projects can access several financing sources. Commercial banks (Nedbank, Standard Bank, Absa, FirstRand) provide senior debt at prime + 1.5-2.5% (approximately 12.75-13.75% in 2026) for projects with investment-grade offtake. Development Finance Institutions (DFIs) including the Development Bank of Southern Africa (DBSA), Industrial Development Corporation (IDC), and International Finance Corporation (IFC) provide longer-tenor debt at 10.5-12%, often with concessional terms for projects with developmental impact. Blended finance structures combining DFI and commercial debt are common for REIPPPP projects. Equity is typically provided by infrastructure funds, pension funds, and strategic investors, with target IRRs of 15-20% in ZAR terms. The standard debt/equity ratio is 70/30 for REIPPPP projects and 60/40 for private PPAs.
What is the Naos-1 project and why does it matter for investors?
Naos-1 is a 300 MW solar plant combined with 660 MWh of battery energy storage, developed by SOLA Group, which reached financial close in February 2026 (Ecofin Agency 2026). It matters for investors for three reasons. First, it demonstrates that utility-scale solar-plus-storage is bankable in South Africa, attracting senior debt from commercial and development finance lenders. Second, its storage ratio of 2.2 MWh per MW of solar sets a benchmark for dispatchable solar projects in REIPPPP Bid Windows 7 and 8. Third, it validates the revenue stacking model where a BESS generates income from both energy arbitrage (charging cheap, discharging expensive) and ancillary services. Developers can use Naos-1’s structure as a template for their own solar-plus-storage projects in the 2026-2031 pipeline.
Conclusion
South Africa’s solar market is at an inflection point. The 6.2 GW installed base, the 1.5 GW annual addition rate, the 8,288 MW IRP2019 target still to be filled, and the 4,500 MW embedded generation segment already operating outside formal procurement all point to a decade of sustained growth. The Naos-1 financial close confirms that solar-plus-storage is bankable. The policy framework, while imperfect, is directionally supportive. The economics, with C&I LCOE at ZAR 0.22/kWh against a ZAR 1.85/kWh grid tariff, are overwhelming.
The investors who will capture the best returns in 2026-2031 are those who move now on grid connection agreements, structure PPAs with creditworthy offtakers and payment security, and build financial models that honestly reflect ZAR financing costs, curtailment risk, and currency depreciation.
I recommend downloading the South Africa Solar Energy Market Study 2026-2031 from eFinancialModels, which includes pre-built financial models for utility-scale, C&I, and solar-plus-storage projects with REIPPPP tariff structures, ZAR financing terms, Section 12B tax modeling, and load-shedding demand scenarios for the full 2026-2031 investment horizon.
























































