
0 ITEMS

South Africa Solar Market Outlook 2026-2031: Capacity & Investment

South Africa is the most investable solar market on the African continent, and the reason is not just sunshine. It is load-shedding. Years of rolling blackouts turned solar from an environmental choice into a financial necessity, and that demand now sits on top of an established procurement framework and a project finance ecosystem that has closed more than ninety independent power projects. The result is a market growing at nearly three times the continental average, with a clear five-year capital deployment window measured in billions. But the same dynamics that make South Africa attractive carry risks that headline growth rates hide: a currency that drifts against the dollar, a grid approaching saturation, and a load-shedding driver that weakens if Eskom stabilises supply. This guide breaks down the capacity trajectory to 2031, the technology and grid segments that actually move revenue, the payback math behind the commercial solar boom, and the four risks every investor should stress-test before financial close.
Key Takeaways
- South Africa’s installed solar capacity is forecast to reach 9.76 GW in 2026, up from 8.75 GW in 2025, a year-on-year addition of roughly 1.01 GW (Mordor Intelligence).
- The market grows at an 11.58% CAGR from 2026 to 2031, reaching 16.88 GW — more than 7 GW of new capacity in five years (Mordor Intelligence).
- Photovoltaic (PV) technology commands 92.62% of market revenue, making it the only technology segment that matters for most investment decisions (Mordor Intelligence).
- On-grid systems hold 93.66% market share, but off-grid is the faster-growing segment through 2031, driven by load-shedding response economics (Mordor Intelligence).
- Market value rises by USD 1.44 billion between 2026 and 2030 at a 12.7% CAGR, representing a concrete capital deployment window for project developers and infrastructure funds (Technavio).
- South Africa’s 11.58% capacity CAGR is nearly 2.7 times the broader Africa solar market CAGR of 4.32%, signalling disproportionate regional investment concentration (Market Data Forecast).
- Load-shedding creates a commercially quantifiable payback driver: commercial and industrial (C&I) buyers face diesel backup costs that make sub-5-year solar payback periods achievable at current system prices.
South Africa Solar Capacity Baseline and 2026 Forecast
South Africa’s solar market enters 2026 with confirmed momentum: installed capacity is forecast at 9.76 GW for 2026, up from 8.75 GW in 2025, according to Mordor Intelligence. That 1.01 GW year-on-year addition continues a pattern established in 2024, when capacity expanded by 11.9% to reach 8.97 GW (RatedPower).
The 2024 figure is important for financial analysts because it validates the growth rate, not just the endpoint. An 11.9% expansion in a single calendar year, against a base of roughly 8 GW, means the market added close to 960 MW in 2024 alone. The 2026 forecast of 9.76 GW implies a similar annual run rate, confirming that the pipeline is not front-loaded or dependent on a single large project.
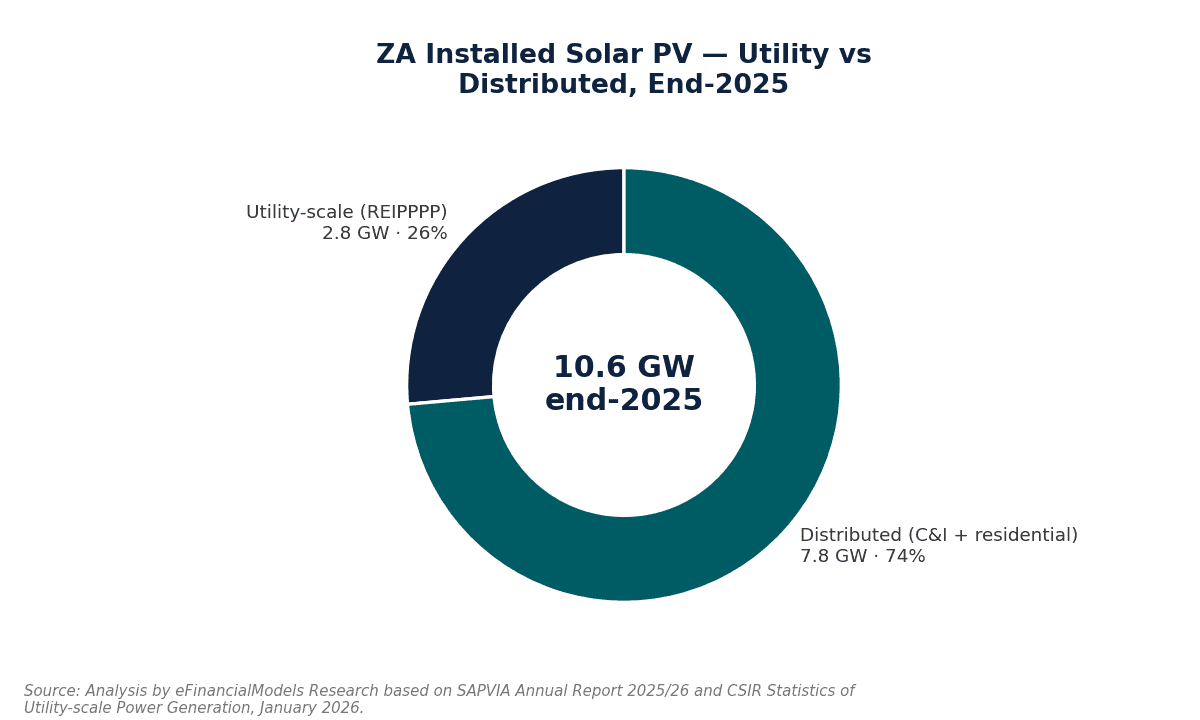
For project developers and infrastructure investors, the 2026 baseline sets the competitive entry point. Projects reaching financial close in 2026 will connect to a grid that already carries nearly 10 GW of solar, which has implications for curtailment risk, grid code compliance, and wheeling tariff negotiations.
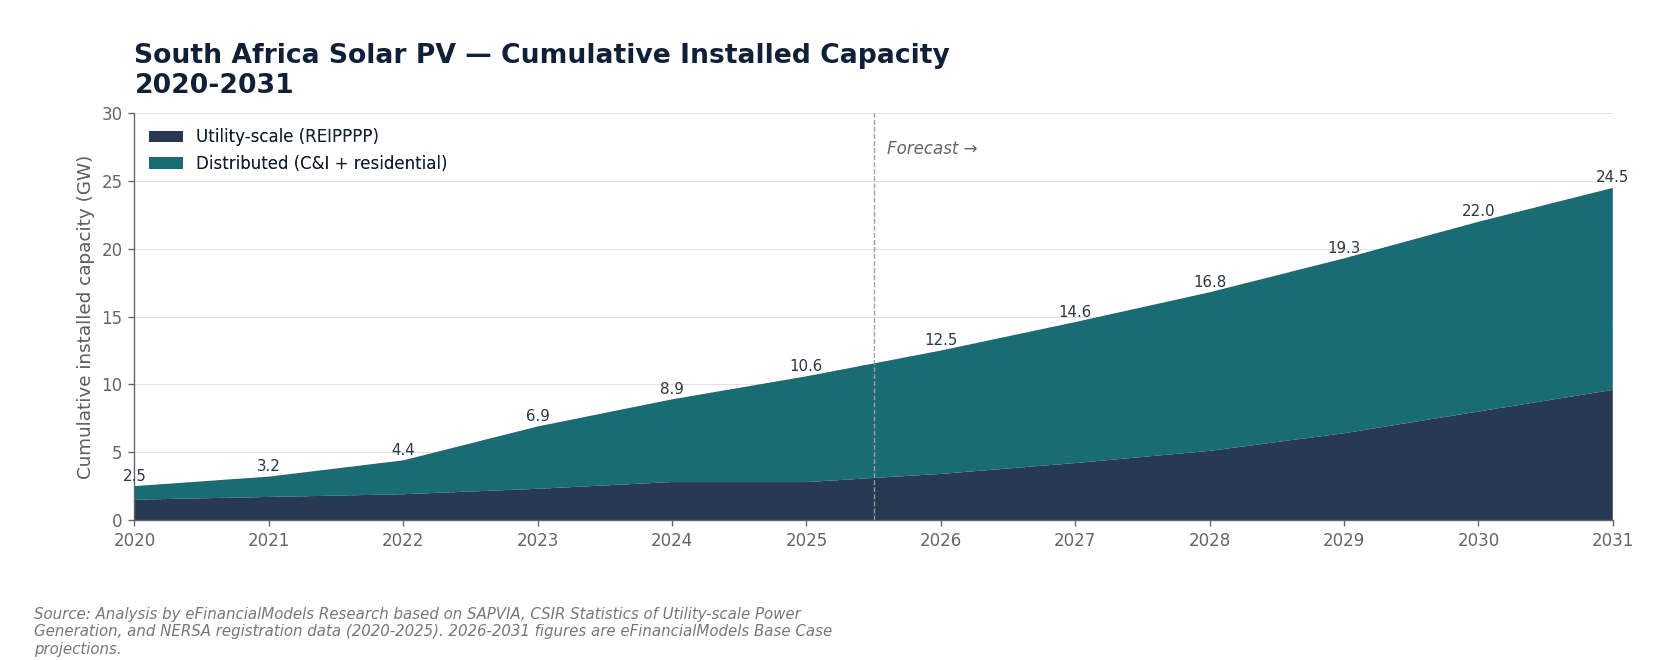
South Africa added 960 MW in 2024 and is on track to add 1.01 GW in 2025-2026, validating the 11.58% CAGR trajectory.
The 2026-2031 Growth Trajectory: CAGR and Annual Capacity Additions
The 2026-2031 growth trajectory projects an 11.58% compound annual growth rate (CAGR), taking installed capacity from 9.76 GW to 16.88 GW by 2031 (Mordor Intelligence). A CAGR is the smoothed annual growth rate that would take a starting value to an ending value over a defined period, assuming growth compounds each year.
Worked Calculation: Compound Growth from 9.76 GW to 16.88 GW
Here’s the math. The CAGR formula is:
CAGR = (End Value / Start Value)^(1/n) – 1
Where n = number of years = 5 (2026 to 2031).
CAGR = (16.88 / 9.76)^(1/5) – 1
CAGR = (1.7295)^(0.2) – 1
CAGR = 1.1158 – 1
CAGR = 11.58%
This confirms the reported figure. Now, translating CAGR into annual MW additions:
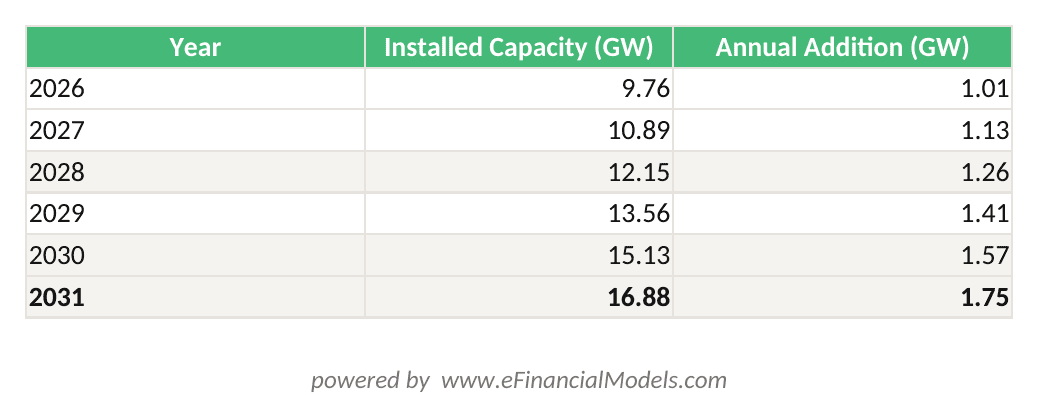
Annual capacity = Prior Year × (1 + 11.58%). Annual MW additions grow from ~1.13 GW in 2027 to ~1.75 GW in 2031, requiring USD 900M+ in project financing per GW at USD 0.9/Wp.
By 2031, annual additions approach 1.75 GW per year. For context, South Africa’s entire solar fleet was under 2 GW as recently as 2020. The pipeline required to sustain this trajectory demands consistent project financing, grid connection approvals, and equipment procurement — all of which represent structured investment opportunities.
At 11.58% CAGR, South Africa adds over 7 GW of solar capacity between 2026 and 2031, with annual additions approaching 1.75 GW by 2031.
Technology Segment Performance: PV Dominance and Revenue Implications
Photovoltaic (PV) technology — which converts sunlight directly into electricity using semiconductor cells — captured 92.62% of South Africa’s solar energy market revenue in 2025 (Mordor Intelligence). The remaining share belongs primarily to Concentrated Solar Power (CSP), which uses mirrors or lenses to focus sunlight and generate heat-driven electricity.
PV’s dominance is not accidental. Three structural factors drive it:
- Capital cost trajectory: Utility-scale PV module prices have fallen over 90% since 2010 (International Renewable Energy Agency data), making PV the lowest-cost new generation technology in South Africa’s high-irradiance zones. According to IRENA, the global weighted-average cost of electricity from utility-scale solar PV fell by 90% between 2010 and 2020 (IRENA).
- Deployment speed: A utility-scale PV plant can reach commercial operation in 12-18 months from financial close. CSP projects typically require 3-5 years, creating a financing duration mismatch that most project finance structures penalise.
- C&I scalability: PV scales from a 50 kW rooftop system to a 500 MW ground-mount without fundamental technology changes. CSP has no meaningful sub-50 MW application, excluding it from the fast-growing C&I segment entirely.
For investment committees, the 92.62% PV revenue share means that any South Africa solar exposure is, in practice, a PV exposure. CSP retains a role in baseload-capable projects with storage, but it represents a niche allocation, not a core strategy.
PV’s 92.62% revenue dominance reflects cost, speed, and scalability advantages that CSP cannot match in the C&I segment.
On-Grid vs Off-Grid: Market Share and Strategic Growth Dynamics
On-grid solar systems, which connect to the national transmission or distribution network, held 93.66% of the South Africa solar market in 2025 (Mordor Intelligence). Despite this dominant share, off-grid systems are projected to grow faster through 2031.
This apparent paradox resolves when you separate share from growth rate. On-grid dominates because utility-scale IPP (Independent Power Producer) projects and large C&I grid-tied installations represent the bulk of installed MW. Off-grid systems are smaller per installation but multiplying in number, driven by load-shedding economics that make grid independence financially rational for commercial buyers.
| Segment | 2025 Market Share | Growth Outlook to 2031 | Primary Driver |
|---|---|---|---|
| On-Grid Solar | 93.66% | Moderate, capacity-led | REIPPP utility projects, large C&I |
| Off-Grid Solar | 6.34% | Faster-growing | Load-shedding response, rural electrification |
| PV Technology | 92.62% revenue | Dominant, sustained | Cost, speed, scalability |
| CSP Technology | ~7.38% revenue | Niche, stable | Baseload storage applications |
For investors, the off-grid acceleration signals a distributed generation (DG) opportunity that differs structurally from utility-scale project finance. Off-grid and hybrid systems typically use lease, ESCO (Energy Services Company), or power purchase agreement structures at the building or campus level, with payback periods driven by avoided diesel and grid electricity costs rather than wholesale PPA tariffs.
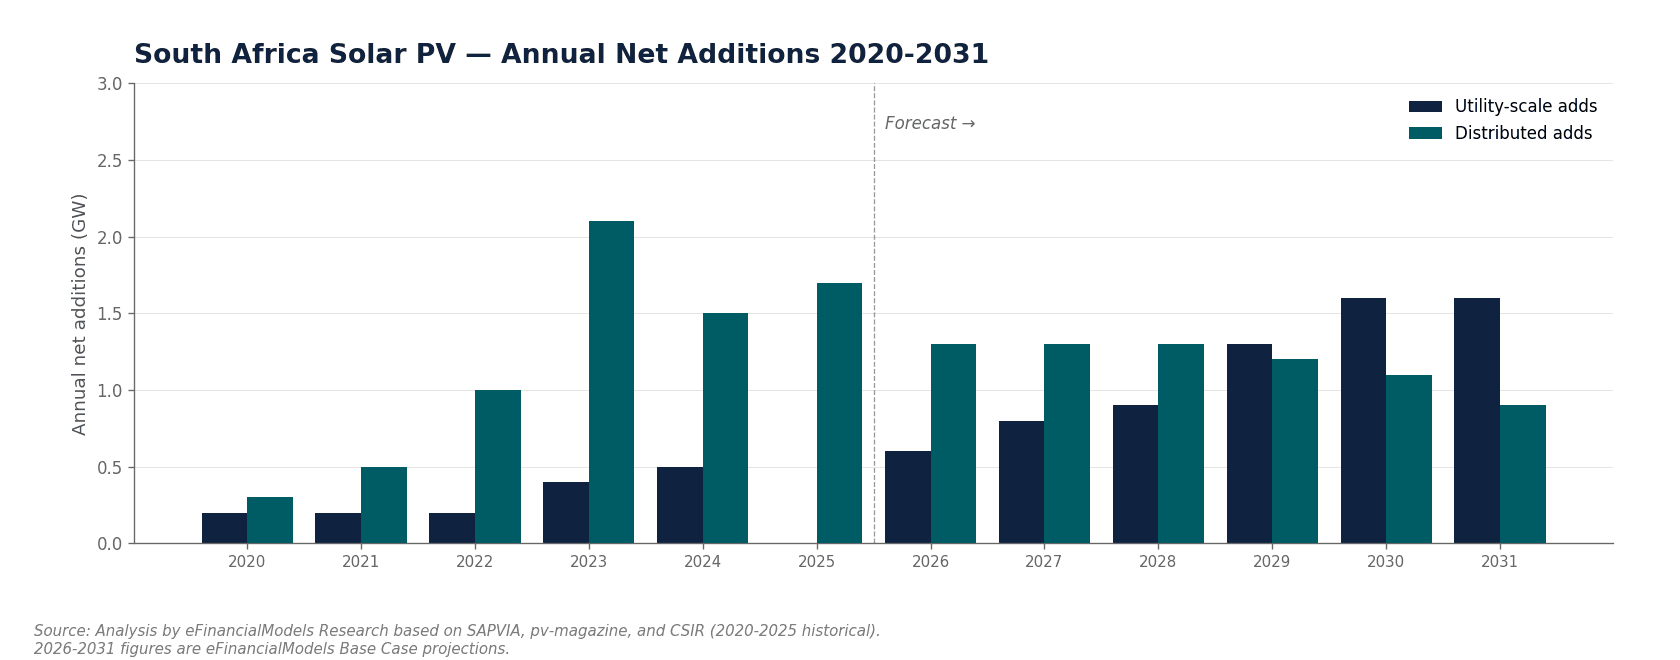
On-grid dominates at 93.66% share, but off-grid is the faster-growing segment through 2031 as load-shedding drives distributed generation adoption.
Market Value Projections: The USD 1.44 Billion Opportunity Window
Between 2026 and 2030, the South Africa solar energy market is expected to increase in value by approximately USD 1.44 billion, at a CAGR of 12.7% (Technavio). This figure represents cumulative incremental market value, not total market size, and it is the most direct measure of new capital deployment opportunity over the four-year window.
Translating USD 1.44 billion into investment sizing: if the market adds roughly USD 360 million in incremental value per year on average, and typical utility-scale solar projects in South Africa are capitalised at USD 0.8-1.2 million per MW (based on regional cost benchmarks), this implies 300-450 MW of new utility-scale capacity per year at the lower end of the value estimate. That aligns closely with the capacity CAGR math above.
For infrastructure funds and development finance institutions (DFIs), the 12.7% value CAGR over 2026-2030 compares favourably to most emerging market infrastructure benchmarks. The South Africa Solar Energy Market Study 2026-2031 provides the segment-level breakdown that supports portfolio construction decisions within this window.
Load-Shedding as a Commercial Solar Driver: Financial Decision Framework
Load-shedding, South Africa’s system of scheduled rolling blackouts implemented by Eskom (the state utility) to manage grid supply shortfalls, is the single most commercially powerful driver of C&I solar adoption. It converts solar from an environmental preference into a financial necessity.
The financial logic works as follows. A commercial facility running diesel generators during load-shedding pays approximately ZAR 6-8 per kWh for diesel-generated electricity (based on 2024-2025 diesel price levels and generator efficiency benchmarks). Grid electricity from Eskom costs roughly ZAR 2.5-3.5 per kWh for commercial tariffs. A solar-plus-storage system, once installed, delivers electricity at an effective cost of ZAR 1.2-2.0 per kWh over a 20-year asset life, depending on system size and financing structure.
The payback calculation for a C&I buyer facing regular load-shedding:
- Without load-shedding: Solar payback period is typically 6-9 years against grid tariff savings alone.
- With load-shedding (diesel displacement): Payback compresses to 3-5 years when diesel cost avoidance is included in the savings stack.
This payback compression is why South Africa’s C&I solar segment accelerated sharply during the 2022-2024 peak load-shedding period, when Stage 6 blackouts (up to 12 hours of outages per day) became routine. Even as Eskom’s grid stability improved in 2024-2025, the installed base of C&I solar created by that period now anchors the off-grid growth trajectory through 2031.
For financial modellers, the key variable is the load-shedding frequency assumption in year 1-3 of a project’s life. A conservative model should stress-test payback periods at both high (Stage 4-6) and low (Stage 0-2) load-shedding scenarios to bound the investment case.
Utility-Scale Project Economics and Pipeline Outlook for 2026
Utility-scale solar projects in South Africa, typically defined as installations above 1 MW connected to the transmission or distribution grid, are the primary driver of the 9.76 GW 2026 baseline. The financial structure for these projects follows a project finance model: a special purpose vehicle (SPV) raises non-recourse debt against contracted revenue, usually a Power Purchase Agreement (PPA) with Eskom or a private offtaker.
Key financial parameters for 2026 utility-scale projects:
- Capacity factor: South Africa’s Northern Cape and Western Cape provinces achieve solar irradiance levels that support capacity factors of 22-28% for fixed-tilt PV and 28-34% for single-axis tracking systems. A capacity factor is the ratio of actual energy output to the maximum possible output if the plant ran at full rated power continuously.
- PPA pricing: Bid prices under South Africa’s Renewable Energy Independent Power Producer Procurement Programme (REIPPP) have ranged from ZAR 0.62 to ZAR 1.03 per kWh in recent bid windows. Private bilateral PPAs for C&I offtakers typically price at a discount to Eskom’s retail tariff, often ZAR 1.8-2.5 per kWh for 10-20 year terms.
- Capital costs: Utility-scale PV in South Africa is estimated at USD 0.75-1.10 per watt (Wp) for 2025-2026 installations, reflecting global module price declines partially offset by local balance-of-system and grid connection costs.
- Debt tenor and gearing: Project finance structures typically achieve 70-75% debt gearing with 15-18 year loan tenors, supported by REIPPP or bilateral PPA contracts.
The 11.58% capacity CAGR implies a project pipeline of approximately 1.2-1.75 GW per year by the late 2020s. At USD 0.9/Wp average capital cost, each gigawatt of new capacity requires roughly USD 900 million in project financing. This scale demands participation from DFIs, commercial banks with project finance capabilities, and institutional infrastructure funds. South Africa’s REIPPP programme has brought more than 90 IPP projects to financial close since its launch in 2011 (Department of Mineral Resources and Energy), demonstrating the depth of the country’s project finance ecosystem and its capacity to absorb large annual capital commitments.
For detailed financial modelling of utility-scale and C&I solar projects in South Africa, the Solar Energy Financial Model provides a structured framework covering PPA pricing, capacity factor sensitivity, and capital cost scenarios.
South Africa’s Position in the Africa Solar Market Context
South Africa’s 11.58% capacity CAGR significantly outpaces the broader Africa solar market, which is projected to grow from USD 14.94 billion in 2026 to USD 20.95 billion by 2034 at a CAGR of 4.32% (Market Data Forecast). South Africa’s growth rate is nearly 2.7 times the continental average.
This outperformance reflects three structural advantages that other African markets have not yet replicated at scale:
- Established project finance infrastructure: South Africa has a functioning REIPPP procurement framework, bankable PPA structures, and a track record of over 90 IPP projects reaching financial close since 2011.
- Grid connectivity: With 93.66% of its solar capacity on-grid, South Africa can absorb large utility-scale additions in a way that off-grid-dominated markets cannot.
- Commercial demand depth: A large industrial and commercial sector, combined with load-shedding-driven demand, creates a private offtaker market that does not depend solely on government procurement.
For investors allocating to Africa renewable energy, South Africa represents the highest-conviction market for near-term capital deployment. The Renewable Energy Template Bundle covers financial modelling frameworks applicable across South Africa’s utility and C&I segments.
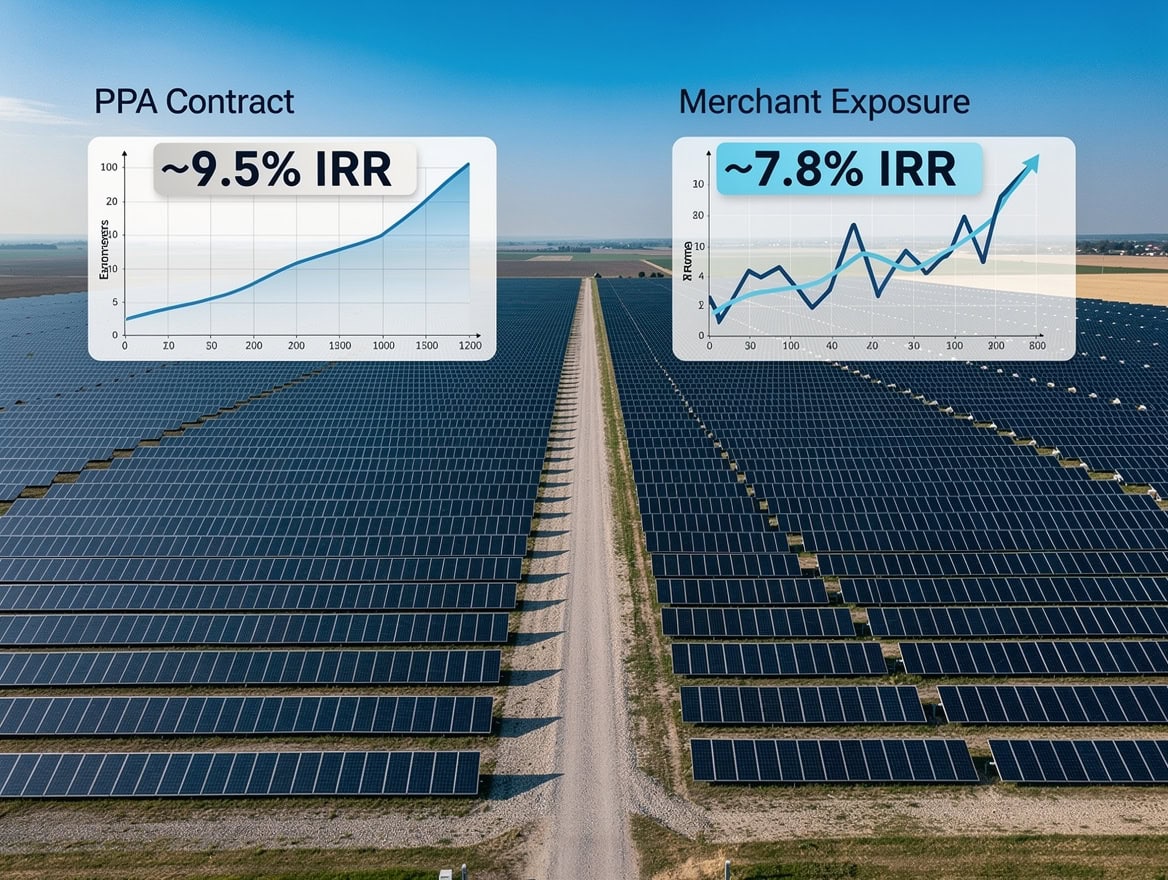
South Africa’s 11.58% solar CAGR is 2.7 times the Africa continental average of 4.32%, reflecting its structural advantages in project finance, grid connectivity, and commercial demand.
Investment Considerations and Risk Factors for 2026 Solar Deployment
South Africa’s solar market offers a compelling growth case, but investors must price four specific risks into their financial models.
1. Currency risk: All capacity and value figures cited in USD are subject to ZAR/USD exchange rate volatility. South Africa’s rand has historically depreciated against the dollar at 4-6% per year over multi-year periods. Projects with USD-denominated debt and ZAR-denominated revenue face a structural currency mismatch that requires hedging or natural offset through USD-linked PPA escalators.
2. Grid curtailment risk: As on-grid solar approaches 10 GW, grid saturation in high-irradiance zones becomes a real constraint. Eskom’s transmission expansion programme has historically lagged generation additions, creating curtailment risk for projects in congested corridors.
3. Regulatory and procurement risk: REIPPP bid windows have experienced delays of 12-24 months in the past. Projects dependent on government procurement face timeline risk that affects equity IRR calculations.
4. Load-shedding normalisation risk: If Eskom’s grid stabilisation programme succeeds beyond current projections, the diesel displacement payback driver for C&I solar weakens. A conservative model should test project viability at Stage 0 load-shedding (no outages) to confirm the investment case holds on grid tariff savings alone.
For a structured approach to these risk factors, the Start Up Solar Farm Excel Model and Valuation includes sensitivity analysis tabs covering currency, curtailment, and tariff escalation scenarios.
Frequently Asked Questions
What is South Africa’s solar installed capacity forecast for 2026?
South Africa’s solar installed capacity is forecast to reach 9.76 GW in 2026, up from 8.75 GW in 2025, according to Mordor Intelligence. This represents a year-on-year addition of approximately 1.01 GW, consistent with the 11.9% expansion rate recorded in 2024 when capacity reached 8.97 GW (RatedPower). For financial modellers, the 2026 baseline of 9.76 GW is the starting point for any capacity-based market sizing or project pipeline analysis covering the 2026-2031 investment horizon. The compound growth from this base at 11.58% CAGR reaches 16.88 GW by 2031, implying cumulative additions of over 7 GW across the five-year period.
How does the 11.58% CAGR translate into annual MW additions?
At an 11.58% CAGR from a 9.76 GW base, annual capacity additions grow from approximately 1.13 GW in 2027 to roughly 1.75 GW by 2031. The compound growth formula is: Year N capacity = 9.76 × (1.1158)^N. By year 3 (2029), capacity reaches approximately 13.56 GW, meaning the market adds over 1.4 GW in that single year. For project developers, this trajectory implies a sustained pipeline of 1.2-1.75 GW per year requiring financial close, grid connection, and equipment procurement. At USD 0.9/Wp capital cost, each gigawatt of new capacity requires roughly USD 900 million in project financing, making this a multi-billion-dollar annual capital deployment market by the late 2020s.
Why does PV dominate over CSP in South Africa’s solar market?
Photovoltaic technology captured 92.62% of South Africa’s solar market revenue in 2025 because it offers three decisive advantages over Concentrated Solar Power (CSP): lower capital cost per MW, faster construction timelines of 12-18 months versus 3-5 years for CSP, and scalability from small C&I rooftop systems to large utility-scale ground mounts. CSP requires a minimum viable scale of around 50 MW to be economically rational and cannot serve the C&I segment at all. For investors, the 92.62% PV revenue share means South Africa solar exposure is effectively a PV technology bet, with CSP representing a niche allocation for baseload-capable projects with integrated thermal storage.
What financial payback period should C&I buyers expect from solar in South Africa?
Commercial and industrial buyers in South Africa can expect solar payback periods of 3-5 years when diesel displacement savings are included, or 6-9 years on grid tariff savings alone. The key variable is load-shedding frequency: a facility experiencing Stage 4-6 load-shedding (8-12 hours of outages per day) pays ZAR 6-8 per kWh for diesel generation, compared to ZAR 1.2-2.0 per kWh for solar over a 20-year asset life. A 500 kW C&I system costing approximately ZAR 6-8 million installed can generate annual savings of ZAR 1.5-2.5 million under moderate load-shedding assumptions, producing a simple payback of 3-4 years. Financial models should stress-test this against Stage 0 scenarios to confirm viability on grid savings alone.
How does South Africa’s solar growth compare to the rest of Africa?
South Africa’s 11.58% capacity CAGR from 2026 to 2031 is approximately 2.7 times the broader Africa solar market CAGR of 4.32% (Market Data Forecast projects the Africa market growing from USD 14.94 billion in 2026 to USD 20.95 billion by 2034). South Africa outperforms because it combines an established REIPPP procurement framework, a functioning project finance ecosystem with over 90 IPP projects completed since 2011, a large on-grid capacity base at 93.66% of installed solar, and a deep C&I demand pool driven by load-shedding economics. For Africa-focused renewable energy investors, South Africa represents the highest near-term capital deployment conviction within the continent.
What are the main risks for solar investors entering South Africa in 2026?
Four risks require explicit financial modelling for 2026 solar investments in South Africa. First, ZAR/USD currency risk: the rand has historically depreciated 4-6% annually against the dollar, creating a structural mismatch for USD-debt, ZAR-revenue projects. Second, grid curtailment risk: with nearly 10 GW of solar on-grid, transmission congestion in high-irradiance zones is increasing. Third, REIPPP procurement delays: government bid windows have slipped 12-24 months historically, affecting equity IRR timelines. Fourth, load-shedding normalisation: if Eskom stabilises the grid, the diesel displacement payback driver weakens, and projects must justify returns on grid tariff savings alone. Sensitivity analysis across all four variables is essential before financial close.
What PPA pricing should utility-scale solar projects expect in South Africa in 2026?
Utility-scale solar projects in South Africa can expect REIPPP bid prices in the range of ZAR 0.62-1.03 per kWh based on recent bid window outcomes, while private bilateral PPAs with C&I offtakers typically price at ZAR 1.8-2.5 per kWh for 10-20 year terms. The bilateral PPA market has grown significantly since 2021 as the licensing threshold for embedded generation was raised to 100 MW, removing the requirement for government approval for most C&I and mid-scale utility projects. For financial modelling purposes, a base case PPA of ZAR 1.90-2.10 per kWh with 5-7% annual escalation is a reasonable starting assumption for 2026 C&I projects, subject to site-specific offtaker creditworthiness assessment.
Conclusion
South Africa’s solar market in 2026 is not a speculative growth story. It’s a 9.76 GW installed base growing at 11.58% CAGR, backed by quantifiable demand drivers, an established procurement framework, and a commercial sector that has already demonstrated willingness to pay for energy independence. The USD 1.44 billion value increase expected between 2026 and 2030 represents a concrete capital deployment window, not a forecast abstraction.
The segment data is equally clear: PV at 92.62% revenue share is the only technology that matters for most investment mandates, on-grid dominates at 93.66% but off-grid is accelerating, and load-shedding compresses C&I payback periods to 3-5 years in a way that no other African market can replicate at scale.
I recommend downloading the South Africa Solar Energy Market Study 2026-2031 to access the full segment-level capacity forecasts, revenue projections, and investment sizing data that underpin the analysis in this article. Pair it with the Solar Energy Financial Model to run your own sensitivity analysis across PPA pricing, capacity factors, and capital cost scenarios for the 2026-2031 horizon.
























































