
0 ITEMS

Brazil Beverage Manufacturing Market 2026-2031: Investment Guide
Key Takeaways
- Brazil’s food and beverage market reached 1,161 billion BRL in revenue, making it one of Latin America’s largest consumer goods sectors and a credible anchor for beverage manufacturing investment.
- The global soft drink and bottled water manufacturing industry is valued at USD 242.6 billion in 2026, and Brazil’s soft drinks segment is projected to grow at a 6.32% CAGR through 2030.
- Brazil’s energy drinks subsector is worth USD 2.15 billion in 2026 and is forecast to reach USD 3.21 billion by 2031 at an 8.40% CAGR, the fastest growth rate among tracked beverage categories.
- The global food and beverage market grows at 3.75% CAGR through 2031; Brazil’s premium and functional beverage subsectors are outpacing that benchmark by 2-4 percentage points.
- Beer manufacturing dominates Brazil’s beverage production by volume, but juice and functional drinks offer higher margin potential for new entrants with differentiated positioning.
- A 5-year revenue projection using the compound growth formula Future Value = Present Value × (1 + CAGR)^years is the standard modeling tool for sizing addressable market by subsector.
- Private equity and strategic buyers should prioritize soft drinks and energy drinks for growth-oriented mandates, while beer offers stable cash flows suited to leveraged buyout structures.
Brazil Beverage Manufacturing Market Overview: 2026-2031 Baseline
Brazil’s beverage manufacturing sector sits inside a food and beverage market that generated over 1,161 billion BRL in revenue (Statista, 2024), positioning the country as the dominant consumer goods economy in Latin America. The three core manufacturing subsectors covered in this analysis are beer, soft drinks, and juice, each with distinct growth trajectories, capital profiles, and margin structures relevant to investors building 5-year financial models.
The global food and beverage market is valued at approximately USD 9.79 trillion in 2026 and is projected to reach USD 11.78 trillion by 2031 (Mordor Intelligence, 2026), growing at a compound annual growth rate (CAGR) of 3.75%. Brazil’s beverage manufacturing segments are tracking at or above this global benchmark in several categories, which creates a compelling relative-value argument for capital allocation.
Key 2026 baseline figures for Brazil beverage manufacturing:
- Soft drinks: The Brazilian soft drinks market is projected to reach USD 14.18 billion by 2025, with a 6.32% CAGR anticipated between 2025 and 2030 (Market Report Analytics, 2025). This implies a 2026 manufacturing revenue base in the USD 14.5-15.0 billion range at retail value.
- Energy drinks (a high-growth soft drinks subcategory): USD 2.15 billion in 2026, rising to USD 3.21 billion by 2031 at an 8.40% CAGR (Mordor Intelligence, 2026).
- Beer and juice: Segment-specific 2026 USD baselines are not publicly disclosed in the available citation package. Analysts building bottom-up models should apply Brazil’s share of global beer production (approximately 3rd globally by volume) and apply a manufacturing-to-retail value ratio of 55-65% to derive production-level revenue estimates.
Note on metric distinction: All revenue figures in this article refer to manufacturing or production-level market value unless explicitly labeled as retail market value. The 1,161 billion BRL figure represents total Brazilian food market revenue across the value chain, not manufacturing output alone.
Soft drinks lead confirmed CAGR data at 6.32% through 2030; energy drinks within that category grow at 8.40% through 2031.
Market Sizing Methodology: Calculating Addressable Market by Subsector
Calculating the total addressable market (TAM) for a specific beverage subsector in Brazil requires three inputs: a verified base-year revenue figure, a defensible CAGR assumption, and a clear definition of the value chain layer being measured (manufacturing vs. retail vs. wholesale).
The standard compound growth formula used across investment research and financial modeling is:
Future Value = Present Value × (1 + CAGR)^years
Where:
- Present Value = base year revenue (2026)
- CAGR = compound annual growth rate for the subsector
- Years = number of periods (1 through 5 for a 2026-2031 model)
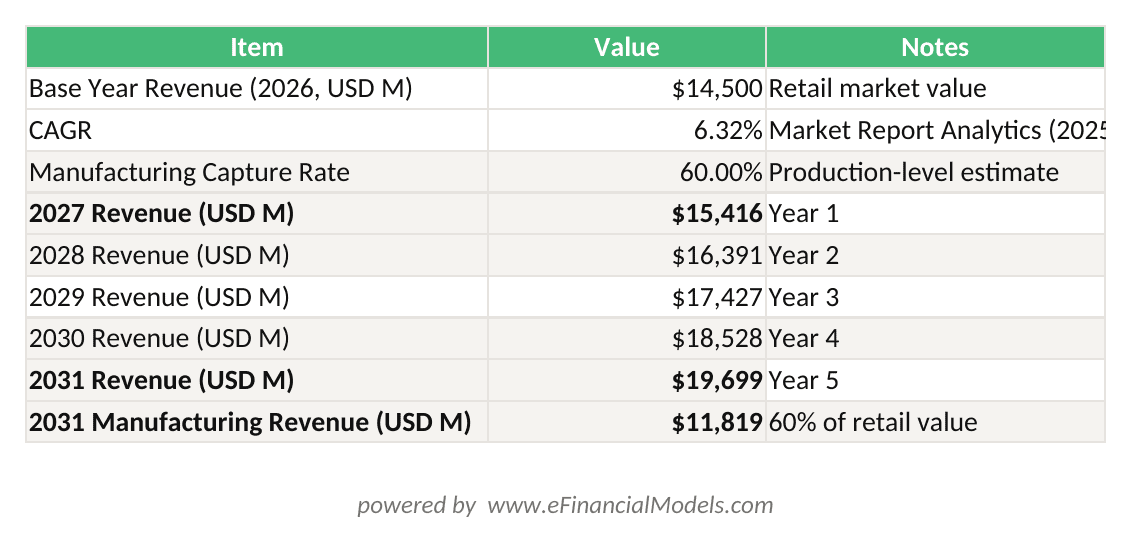
Future Value = Present Value × (1 + CAGR)^years applied to Brazil soft drinks at 6.32% CAGR; manufacturing-level revenue estimated at 60% of retail value.
Applying this formula to Brazil’s soft drinks segment with a USD 14.5 billion 2026 base and a 6.32% CAGR:
- 2027: USD 14.5B × (1.0632)^1 = USD 15.42 billion
- 2028: USD 14.5B × (1.0632)^2 = USD 16.39 billion
- 2029: USD 14.5B × (1.0632)^3 = USD 17.43 billion
- 2030: USD 14.5B × (1.0632)^4 = USD 18.53 billion
- 2031: USD 14.5B × (1.0632)^5 = USD 19.70 billion
This produces a 5-year cumulative revenue pool of approximately USD 85.5 billion at retail value. Applying a manufacturing capture rate of 60% yields a production-level addressable market of roughly USD 51.3 billion across the forecast period for soft drinks alone.
For beer and juice, analysts should build analogous models once segment-specific base-year data is sourced from IBGE (Brazil’s national statistics agency) or ABRABE (Brazilian Beverage Association) industry reports, which publish annual production volume and average ex-factory price data.
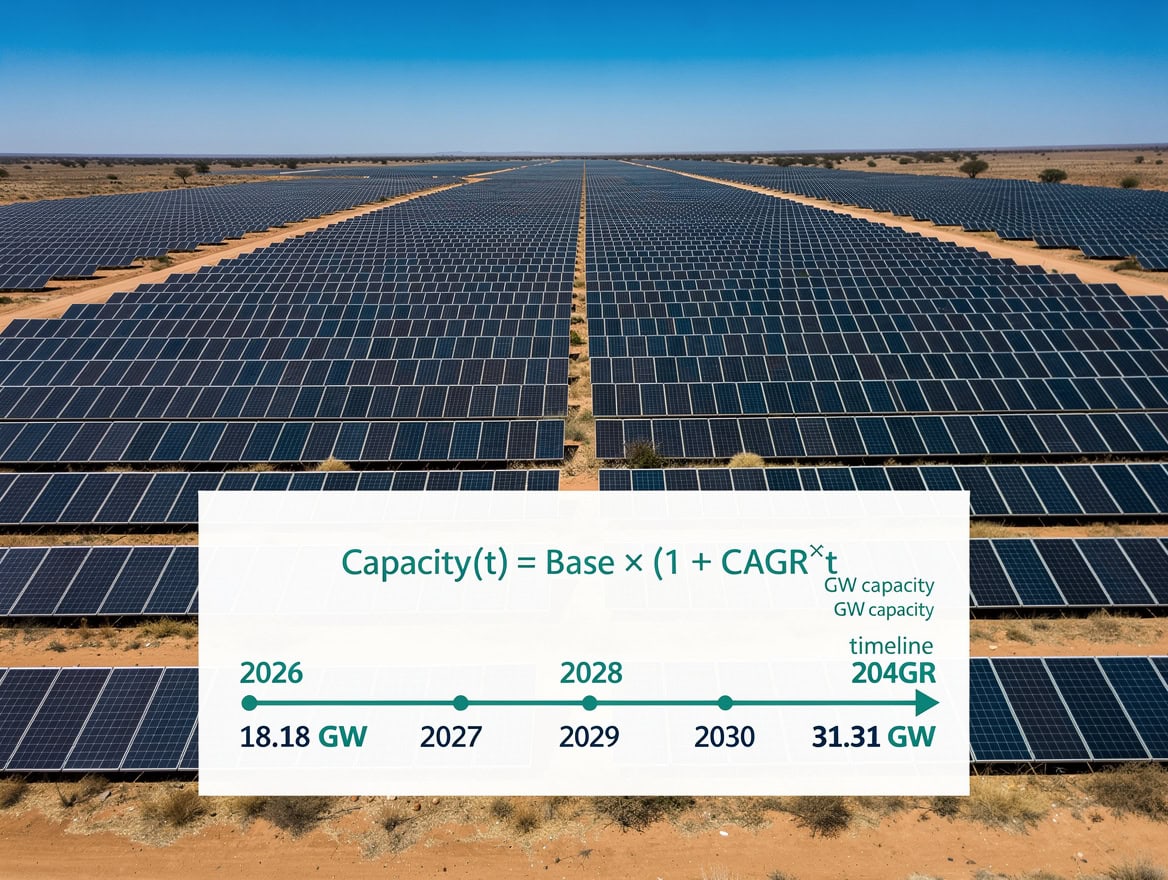
Applying a 6.32% CAGR to a USD 14.5B base year produces USD 19.70B by 2031, a 35.9% absolute increase over 5 years.
Beer Manufacturing Segment: Growth Drivers and Financial Profile
Beer is Brazil’s largest beverage manufacturing segment by production volume, and the country ranks among the top 3 global beer producers by volume. The segment is highly consolidated: AB InBev (through Ambev) controls an estimated 60-65% of the Brazilian beer market by volume, with Heineken Brazil and Grupo Petrópolis holding most of the remainder.
Key financial characteristics of Brazil beer manufacturing:
- EBITDA margins: Large-scale beer manufacturers in Brazil typically operate at EBITDA margins of 28-38%, driven by scale economics in malt processing, canning, and distribution. Craft and regional brewers operate at 12-20% EBITDA, reflecting lower volume leverage and higher raw material costs per unit.
- Capex intensity: Greenfield beer plant construction in Brazil requires approximately USD 80-150 per hectoliter of annual capacity, depending on automation level and location. A 1-million-hectoliter facility represents a USD 80-150 million capital commitment before working capital.
- Raw material cost structure: Malt and hops account for approximately 30-40% of COGS for standard lager production. Water treatment, packaging (cans and glass), and energy represent another 25-35% of COGS. Sugar adjuncts used in Brazilian-style lagers reduce malt costs but compress premium positioning.
- Working capital: Beer manufacturers typically carry 45-60 days of raw material inventory due to malt import lead times. Days sales outstanding (DSO) runs 30-45 days for distributor channels. Cash conversion cycles of 20-40 days are achievable at scale.
Growth drivers for 2026-2031 include premiumization (craft, imported, and flavored beer gaining share), the expansion of returnable glass bottle programs reducing packaging COGS, and rising per-capita beer consumption in Brazil’s interior cities as income levels increase.
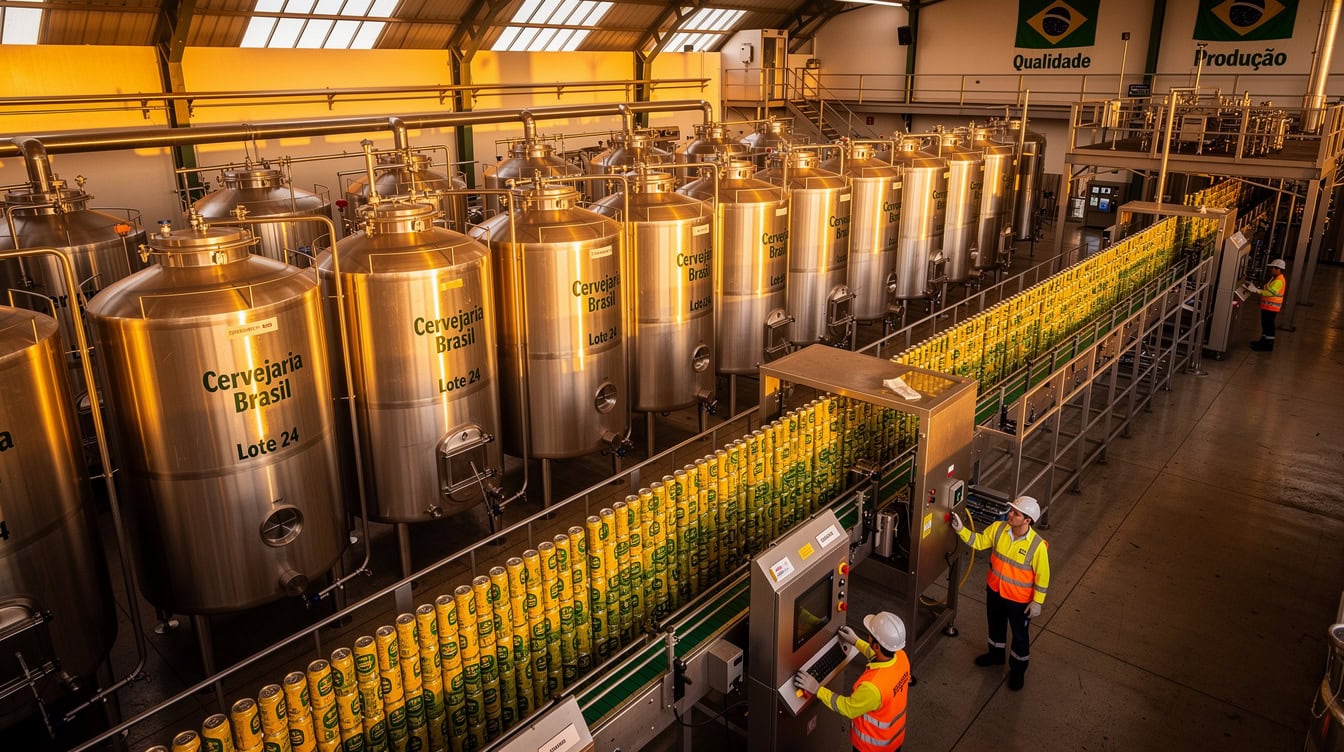
Brazil ranks among the top 3 global beer producers by volume; large-scale operators achieve EBITDA margins of 28-38% through scale economics in malt processing and distribution.
Soft Drinks Manufacturing: Market Dynamics and CAGR Projections
Brazil’s soft drinks manufacturing segment is the most data-rich subsector for financial modeling, with a projected 6.32% CAGR between 2025 and 2030 (Market Report Analytics, 2025). This growth rate exceeds the global food and beverage benchmark of 3.75% by approximately 260 basis points, signaling above-average demand momentum.
The global soft drink and bottled water manufacturing industry reached USD 242.6 billion in 2026 (IBISWorld, 2026). Brazil captures an estimated 5-7% of that global figure, consistent with its position as the 5th largest economy by GDP and a high per-capita soft drink consumption market. Brazil is the 5th largest economy in the world by nominal GDP (World Bank), a ranking that directly supports the country’s outsized share of global soft drink consumption relative to other emerging markets.
Financial profile for soft drinks manufacturing in Brazil:
- EBITDA margins: 18-28% for large-scale carbonated soft drink (CSD) producers. Energy drink manufacturers, operating in a higher-margin premium segment, typically achieve 25-35% EBITDA.
- Capex intensity: PET bottle filling lines cost approximately USD 5-15 million per line at 20,000-40,000 bottles per hour. A mid-scale soft drink plant with 3-4 lines represents USD 20-50 million in equipment capex, plus civil works.
- Sugar cost exposure: Sugar represents 15-25% of COGS for standard CSD production. Brazil is the world’s largest sugar producer, accounting for approximately 22% of global sugar production (USDA Foreign Agricultural Service), which provides a structural cost advantage versus global peers, though BRL/USD exchange rate volatility affects USD-denominated margin reporting.
- Distribution economics: Soft drink manufacturers in Brazil typically split revenue approximately 40% through direct distribution (own trucks to retail), 35% through third-party distributors, and 25% through foodservice channels. Direct distribution carries higher fixed costs but improves shelf placement and reduces distributor margin leakage of 8-15%.
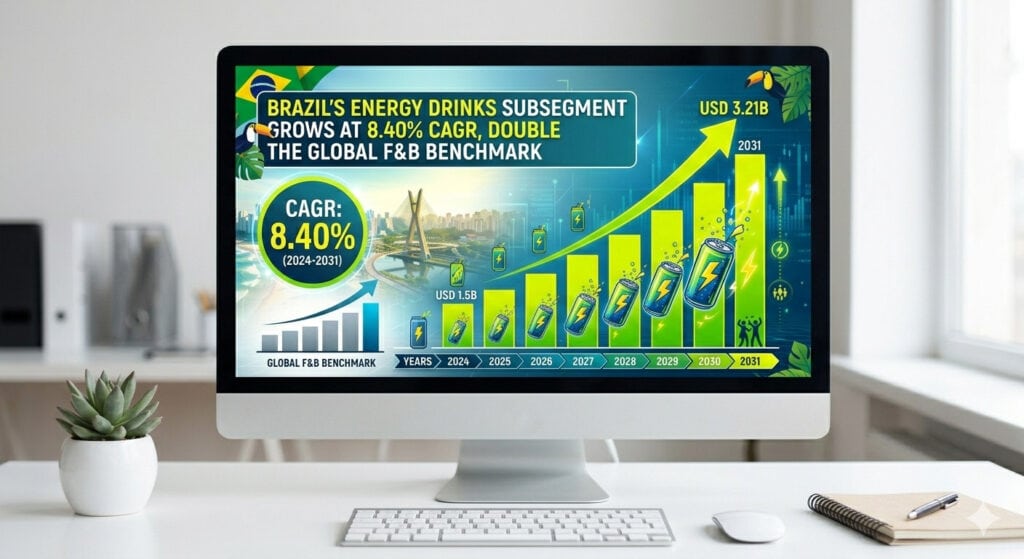
Brazil’s energy drinks subsegment grows at 8.40% CAGR, more than double the global F&B benchmark of 3.75%, reaching USD 3.21B by 2031.
Juice Manufacturing Subsector: Positioning and Growth Trajectory
Juice manufacturing in Brazil benefits from the country’s position as the world’s largest producer of orange juice concentrate, supplying approximately 70-80% of global orange juice exports (USDA Foreign Agricultural Service). This raw material advantage creates a structural cost moat for domestic juice manufacturers that is difficult for international competitors to replicate.
Segment-specific 2026 USD baseline and CAGR data for Brazil juice manufacturing are not available in the current citation package. Analysts should reference USDA Foreign Agricultural Service reports and ABECITRUS (Brazilian Citrus Exporters Association) annual data for production volume and ex-factory price benchmarks.
Key financial characteristics of Brazil juice manufacturing:
- EBITDA margins: NFC (not-from-concentrate) juice manufacturers operate at 15-25% EBITDA. Concentrate producers serving export markets typically achieve 20-30% EBITDA, supported by USD-denominated export revenues that provide a natural hedge against BRL depreciation.
- Capex intensity: Juice extraction and pasteurization lines require USD 10-25 million per processing line. Cold chain infrastructure (refrigerated storage and transport) adds 20-30% to total facility capex versus ambient-temperature beverage plants.
- Fruit cost structure: Fruit (primarily orange, but also mango, açaí, and passion fruit) represents 40-55% of COGS for NFC juice, making it the most raw-material-intensive subsector among the three analyzed.
- Growth drivers: Rising domestic demand for functional and natural beverages, export growth to Europe and Asia, and premiumization toward cold-pressed and NFC formats are the primary revenue growth levers for 2026-2031.
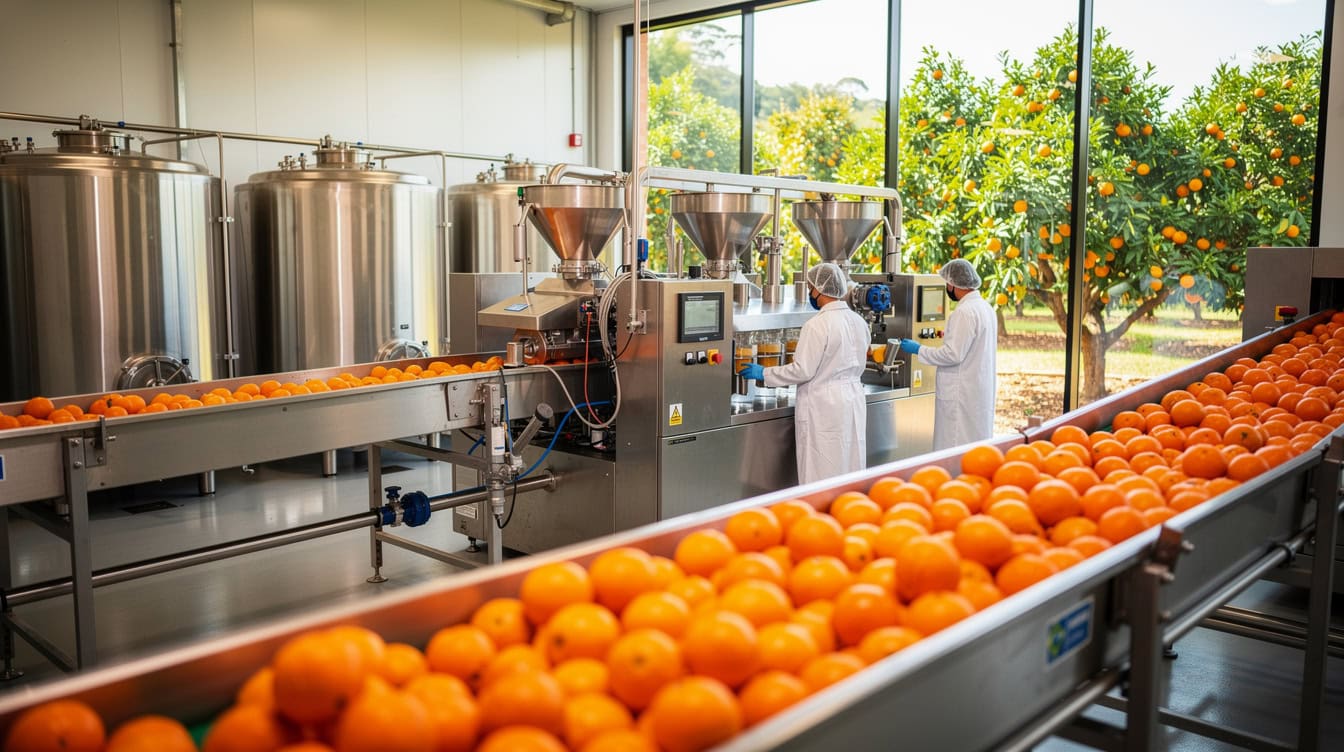
Brazil supplies approximately 70-80% of global orange juice concentrate exports, giving domestic juice manufacturers a structural raw material cost advantage.
Comparative Subsector Performance: Beer vs. Soft Drinks vs. Juice
The three subsectors offer materially different risk-return profiles for investors. The table below summarizes key financial benchmarks for financial modeling and investment screening purposes.
| Metric | Beer Manufacturing | Soft Drinks Manufacturing | Juice Manufacturing |
|---|---|---|---|
| 2026 Market CAGR (2026-2031) | ~4-5% (estimated) | 6.32% | ~5-7% (estimated) |
| EBITDA Margin Range | 28-38% (large scale) | 18-28% (CSD); 25-35% (energy) | 15-25% (NFC); 20-30% (concentrate) |
| Capex per Unit Capacity | USD 80-150/hL | USD 5-15M per filling line | USD 10-25M per processing line |
| Raw Material as % of COGS | 55-75% | 40-55% | 60-70% |
| Cash Conversion Cycle | 20-40 days | 15-30 days | 30-55 days |
| Market Concentration | Very High (Ambev ~60%) | High (Coca-Cola, PepsiCo dominant) | Moderate (fragmented in NFC) |
| FX Revenue Exposure | Low (domestic BRL) | Low (domestic BRL) | High (USD export revenues) |
| Acquisition Multiple Range (EV/EBITDA) | 8-14x | 7-12x | 6-10x |
Note: CAGR estimates for beer and juice are analyst estimates based on available market data and global comparable growth rates. Investors should validate against IBGE and ABRABE primary data before committing capital.
Beer delivers the highest EBITDA margins (28-38%) while energy drinks offer the strongest CAGR (8.40%); juice provides USD revenue exposure through concentrate exports.
Financial Modeling Framework: Projecting 5-Year Revenues and Margins
Building a credible 5-year financial model for Brazil beverage manufacturing requires four interconnected modules: revenue projection, gross margin build, EBITDA bridge, and working capital schedule.
Revenue projection module: Apply the compound growth formula to each subsector’s base-year revenue. Use segment-specific CAGRs (6.32% for soft drinks, 8.40% for energy drinks) rather than blended market averages. For beer and juice, use conservative estimates of 4.5% and 5.5% respectively until primary data is available.
Gross margin build: Start with raw material costs as a percentage of revenue (see subsector profiles above). Layer in packaging, energy, and direct labor. Brazilian beverage manufacturers typically achieve gross margins of 35-55%, with beer at the high end and juice at the lower end due to fruit cost intensity.
EBITDA bridge: Subtract SG&A (typically 10-18% of revenue for branded beverage companies), distribution costs (8-15% of revenue), and marketing spend (5-12% of revenue for consumer-facing brands). The resulting EBITDA margin range of 15-35% is consistent with publicly reported figures from Ambev and other listed Brazilian beverage companies.
Working capital schedule: Model days inventory outstanding (DIO), days sales outstanding (DSO), and days payable outstanding (DPO) separately by subsector. Beer: DIO 45-60 days, DSO 30-45 days, DPO 30-45 days. Soft drinks: DIO 20-35 days, DSO 25-40 days, DPO 30-45 days. Juice: DIO 30-50 days, DSO 30-45 days, DPO 25-40 days.
For food and beverage financial models that include pre-built subsector assumptions, EFM’s template library provides a starting framework that analysts can calibrate to Brazil-specific inputs.

A four-module financial model structure covers revenue projection, gross margin build, EBITDA bridge, and working capital scheduling for Brazil beverage manufacturing investments.
Brazil Market Context: Global Benchmarking and Competitive Positioning
Brazil’s beverage manufacturing sector outperforms the global food and beverage CAGR of 3.75% in its highest-growth subsegments. The global food and beverage market is projected to grow from USD 9.79 trillion in 2026 to USD 11.78 trillion by 2031 (Mordor Intelligence, 2026), representing USD 1.99 trillion in incremental market value over the forecast period.
Brazil’s competitive advantages in beverage manufacturing include:
- Raw material abundance: World’s largest sugar and orange juice producer, with significant water resources for brewing and bottling.
- Scale of domestic demand: A population of 215 million with rising middle-class income supports volume growth across all three subsectors. Brazil’s population of approximately 215 million people (World Bank) represents the largest consumer base in Latin America, underpinning sustained volume demand across all beverage manufacturing subsectors through 2031.
- Manufacturing infrastructure: Established cold chain, glass and PET packaging industries, and port infrastructure for export-oriented juice manufacturers.
- Currency dynamics: BRL depreciation against USD increases the competitiveness of Brazilian beverage exports while compressing USD-reported margins for domestic-focused businesses.
The energy drinks subsector deserves specific attention: Brazil’s energy drinks market is worth USD 2.15 billion in 2026 and is projected to reach USD 3.21 billion by 2031 (Mordor Intelligence, 2026), a 49% absolute increase over 5 years at an 8.40% CAGR. This growth rate is more than double the global F&B benchmark, making it the highest-conviction growth subsegment within Brazilian beverage manufacturing for the 2026-2031 window.
For manufacturing financial models that incorporate global benchmarking inputs, analysts can adapt EFM’s manufacturing templates to Brazil-specific cost and revenue assumptions.
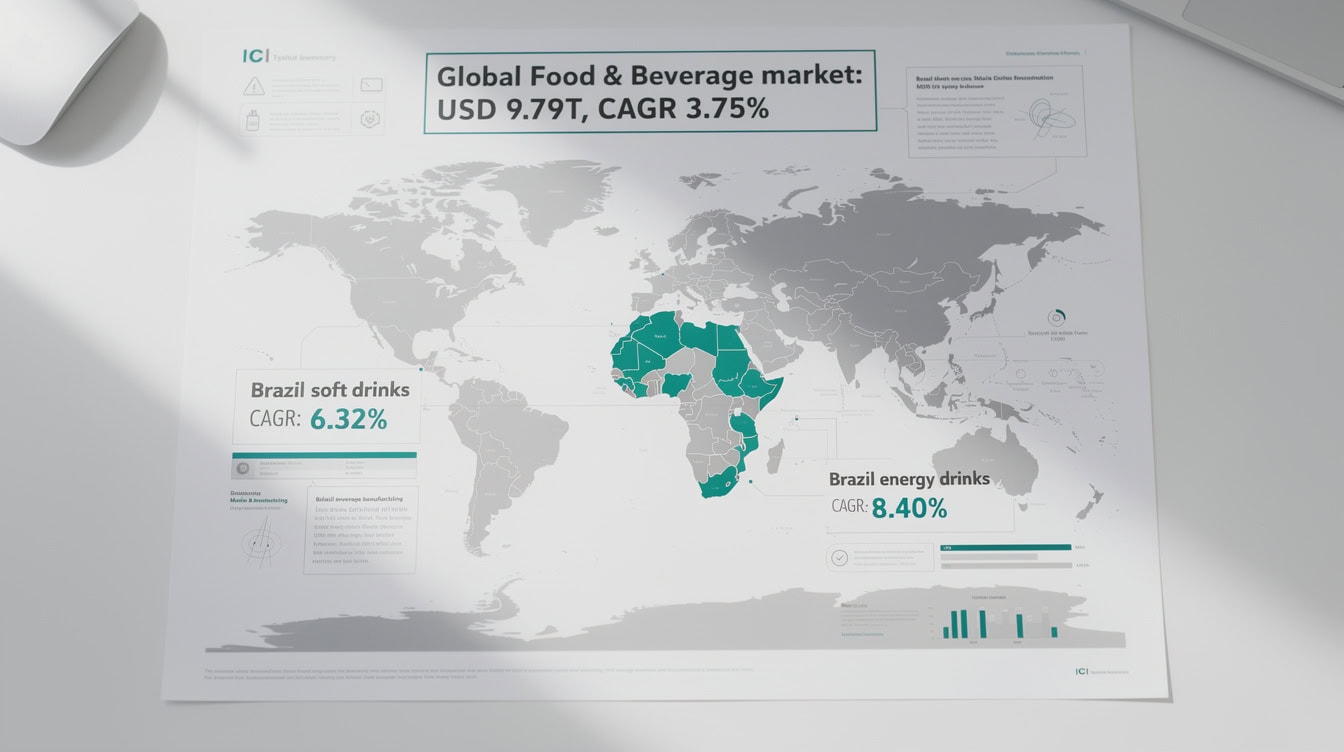
Brazil’s energy drinks CAGR of 8.40% exceeds the global F&B benchmark of 3.75% by 465 basis points, the largest growth premium among tracked beverage categories.
Investment Thesis and Capital Allocation: Where to Deploy in 2026-2031
The optimal capital allocation strategy across Brazil’s three beverage manufacturing subsectors depends on the investor’s mandate, return horizon, and risk tolerance.
Beer: Stable cash flow, LBO-suitable
Beer manufacturing offers the highest EBITDA margins (28-38% at scale) and predictable cash flows, making it well-suited to leveraged buyout structures. The market is highly concentrated, so acquisition targets are primarily regional brewers and craft operators. EV/EBITDA multiples of 8-14x reflect the premium for established brands and distribution networks. The primary risk is market share erosion from Ambev’s pricing power and distribution dominance.
Soft drinks and energy drinks: Growth-oriented, platform-building
The 6.32% CAGR for soft drinks and 8.40% for energy drinks make this the preferred subsector for growth equity and strategic acquirers seeking revenue expansion. Platform acquisitions in regional CSD brands or energy drink manufacturers offer consolidation upside. Multiples of 7-12x EBITDA are achievable, with premium pricing for brands with demonstrated energy drink or functional beverage exposure.
Juice: Export-driven, FX-hedged returns
Juice manufacturing offers a natural USD revenue hedge through orange juice concentrate exports. For investors with USD return requirements, acquiring a juice manufacturer with export contracts provides partial insulation from BRL depreciation. Multiples of 6-10x EBITDA reflect the higher raw material cost volatility and cold chain capex requirements.
Integration considerations: All three subsectors benefit from shared distribution infrastructure. Strategic buyers with existing Brazilian beverage or food distribution networks can extract 15-25% cost synergies through route consolidation and shared cold chain assets.
The Brazil Beverage Manufacturing Market Study 2026-2031 provides the detailed subsector data, growth projections, and competitive landscape analysis that underpins the investment thesis outlined above.
Beer suits LBO structures at 8-14x EBITDA; soft drinks and energy drinks suit growth equity at 7-12x; juice offers FX-hedged returns at 6-10x for USD-mandated investors.
Operational Benchmarks and Manufacturing Economics by Subsector
Operational benchmarks translate market-level growth projections into plant-level financial performance metrics that investors and operators use for capacity planning and margin management.
Capacity utilization: Brazilian beverage manufacturers typically operate at 70-85% capacity utilization in steady state. Beer plants run at 75-85% utilization, with seasonal peaks during Carnival and summer months (November-February). Soft drink plants operate at 65-80%, with higher utilization in warmer regions. Juice plants run at 60-75% due to seasonal fruit availability constraints.
Production cost as % of revenue: Beer: 45-55% (COGS/revenue). Soft drinks: 50-65%. Juice: 55-70%. The higher production cost intensity in juice reflects fruit input costs and cold chain energy consumption.
Inventory turns: Beer: 8-12 turns per year. Soft drinks: 10-15 turns. Juice (NFC): 6-10 turns due to refrigerated storage constraints and shorter shelf life.
Distribution cost as % of revenue: Direct distribution (own fleet): 8-12% of revenue. Third-party distributor model: 4-7% of revenue (net of distributor margin). Hybrid models, common among mid-scale Brazilian manufacturers, average 6-10% of revenue in distribution costs.
For beverage manufacturing financial models that incorporate these operational benchmarks, EFM’s template includes capacity utilization schedules, production cost drivers, and distribution cost modeling by channel.
Frequently Asked Questions
What is the total size of Brazil’s beverage manufacturing market in 2026?
A precise, single-figure total for Brazil’s beverage manufacturing market in 2026 is not available from a single authoritative public source. The broader Brazilian food and beverage market generated over 1,161 billion BRL in revenue (Statista, 2024), which includes the full value chain from manufacturing through retail. For the soft drinks subsector specifically, the market is projected at approximately USD 14.5-15.0 billion in 2026 at retail value, implying a manufacturing-level figure of USD 8.5-9.5 billion after applying a 60% manufacturing capture rate. Beer and juice segment baselines require IBGE or ABRABE primary data for precise quantification. Analysts building investment models should use the compound growth formula Future Value = Present Value × (1 + CAGR)^years applied to the most recent verified base-year figure available from official Brazilian statistics.
Which beverage subsector offers the best CAGR for 2026-2031 in Brazil?
Energy drinks, classified within the soft drinks manufacturing category, offer the highest confirmed CAGR at 8.40% for 2026-2031, growing from USD 2.15 billion to USD 3.21 billion (Mordor Intelligence, 2026). This rate is more than double the global food and beverage benchmark of 3.75%. Broader soft drinks manufacturing grows at 6.32% CAGR through 2030. Beer and juice CAGRs are estimated at 4-5% and 5-7% respectively based on comparable market data, pending primary source confirmation. For investors with a growth mandate, energy drinks and functional soft drinks represent the highest-conviction subsegment within Brazil’s beverage manufacturing sector for the 2026-2031 investment window.
What EBITDA margins should I model for a Brazilian beverage manufacturer?
EBITDA margins vary significantly by subsector and scale. Large-scale beer manufacturers in Brazil, led by Ambev, achieve 28-38% EBITDA margins due to scale economics in malt processing, canning, and distribution. Soft drink manufacturers operate at 18-28% EBITDA for carbonated soft drinks, with energy drink producers reaching 25-35%. Juice manufacturers run at 15-25% for NFC formats and 20-30% for concentrate producers with export revenues. Craft beer and small-scale juice operators typically achieve 12-20% EBITDA. For financial modeling purposes, use 25% EBITDA as a conservative mid-point for a diversified Brazilian beverage manufacturer, and stress-test at 18% and 32% for downside and upside scenarios respectively.
How do I calculate a 5-year revenue projection for a Brazil beverage investment?
Use the compound growth formula: Future Value = Present Value × (1 + CAGR)^years. For example, a soft drinks manufacturing business with USD 50 million in 2026 revenue growing at 6.32% CAGR produces: Year 1 = USD 53.16M, Year 2 = USD 56.52M, Year 3 = USD 60.09M, Year 4 = USD 63.89M, Year 5 = USD 67.93M. Total 5-year revenue = USD 301.6 million. Apply your gross margin assumption (35-50% for soft drinks) to derive gross profit, then subtract SG&A (10-18%), distribution (6-10%), and marketing (5-12%) to reach EBITDA. This framework applies to all three subsectors; the key variable is the CAGR input, which should be sourced from verified market research rather than estimated.
What acquisition multiples apply to Brazilian beverage manufacturers?
Acquisition multiples for Brazilian beverage manufacturers in 2026 range from 6-14x EV/EBITDA depending on subsector, scale, and brand strength. Beer manufacturers with established regional distribution command 8-14x EBITDA, reflecting stable cash flows and brand equity. Soft drink manufacturers trade at 7-12x, with premium pricing for energy drink exposure. Juice manufacturers, particularly those with export contracts, trade at 6-10x EBITDA, reflecting higher raw material volatility and cold chain capex requirements. Strategic buyers with synergy potential (shared distribution, cross-selling) typically pay 1-2x turns above financial buyer multiples. These ranges are consistent with comparable transactions in Latin American consumer goods reported by S&P Global Market Intelligence and Mergermarket databases.
What are the main risks to beverage manufacturing investment in Brazil?
Five material risks affect the 2026-2031 investment thesis. First, BRL/USD exchange rate volatility compresses USD-reported margins for domestic-revenue businesses; a 10% BRL depreciation reduces USD EBITDA by approximately the same percentage for unhedged operators. Second, Brazil’s ICMS (state-level value-added tax) and IPI (federal excise tax) on beverages create regulatory cost exposure, particularly for beer and soft drinks. Third, raw material price volatility, especially sugar and fruit, directly impacts COGS for soft drink and juice manufacturers. Fourth, Ambev’s distribution dominance creates a structural barrier for new beer entrants seeking shelf space. Fifth, infrastructure constraints in Brazil’s interior regions increase distribution costs for manufacturers expanding beyond major metropolitan areas.
How does Brazil’s beverage market compare to global growth benchmarks?
Brazil’s beverage manufacturing subsectors outperform the global food and beverage CAGR of 3.75% in their highest-growth categories. The global food and beverage market grows from USD 9.79 trillion in 2026 to USD 11.78 trillion by 2031 (Mordor Intelligence, 2026). Brazil’s soft drinks segment at 6.32% CAGR exceeds the global benchmark by 257 basis points. Brazil’s energy drinks at 8.40% CAGR exceeds it by 465 basis points. The global soft drink and bottled water manufacturing industry is valued at USD 242.6 billion in 2026 (IBISWorld, 2026), and Brazil’s share of approximately 5-7% of that figure reflects its status as a top-5 global soft drink market. For investors benchmarking Brazil against other emerging markets, this growth premium justifies a higher entry multiple relative to mature market beverage assets.
Conclusion
Brazil’s beverage manufacturing market offers a differentiated investment opportunity across three subsectors with distinct financial profiles. Soft drinks and energy drinks deliver the strongest CAGR momentum at 6.32% and 8.40% respectively through 2031. Beer provides the highest EBITDA margins and most predictable cash flows for leveraged structures. Juice manufacturing offers USD revenue exposure through orange concentrate exports, providing a natural FX hedge for dollar-denominated investors.
Building a credible 5-year model requires applying the compound growth formula to verified base-year data, layering in subsector-specific margin assumptions, and stress-testing working capital and capex requirements against Brazil’s operational benchmarks.
I recommend downloading the Brazil Beverage Manufacturing Market Study 2026-2031 to access the full dataset, subsector projections, and competitive landscape analysis that supports the investment thesis outlined in this article. Pair it with EFM’s beverage manufacturing financial model to build detailed 5-year projections calibrated to Brazil market entry or acquisition scenarios.

























































