
0 ITEMS

India Solar Market Will Reach 280 GW by 2031

India has built one of the world’s largest solar fleets, yet the hardest part of the story is still ahead. Reaching the country’s 2030 target means installing solar nearly three times faster than it does today, and the constraints are no longer about cost or ambition. Auction tariffs have already collapsed to among the lowest on earth, but transmission bottlenecks, land acquisition delays, a struggling rooftop segment, and uneven off-taker credit now decide which projects actually earn their returns. This guide separates the policy ceiling from the realistic forecast, walks through the auction and LCOE economics, builds a full IRR model for a representative 100 MW project, and maps the state-by-state and regulatory risks that determine whether an Indian solar investment is bankable or stranded.
Key Takeaways
- India’s cumulative installed solar capacity stood at 73.32 GW as of March 31, 2024, requiring an average of 34.5 GW per year to hit the 280 GW target by 2030 — nearly 2.7x the 12.78 GW added in FY2023-24.
- Utility-scale auction tariffs collapsed from INR 10-12/kWh in 2010 to INR 2.44/kWh in 2017, and forward projections suggest tariffs stabilizing in the INR 2.20-2.50/kWh band through 2031 as module cost declines slow.
- Rooftop solar reached only 11.08 GW against a 40 GW National Solar Mission target — a 72% shortfall driven by net metering policy reversals, DISCOM resistance, and financing access gaps.
- The Production-Linked Incentive (PLI) scheme targets 10 GW of domestic module manufacturing capacity, aiming to reduce India’s 80%+ import dependency on Chinese modules by 2026-2027.
- A representative 100 MW utility-scale project at INR 2.40/kWh PPA tariff, INR 40 million/MW CapEx, and 70:30 debt-equity yields a project IRR of approximately 12-14% under base-case assumptions.
- State-level variation is decisive: Rajasthan, Gujarat, and Karnataka lead on auction volumes and grid readiness, while several eastern states carry significant off-taker credit risk.
- The India Solar Energy Market Study 2026-2031 provides granular scenario modeling, state-by-state pipeline data, and sensitivity tables for investors running their own IRR analysis.
India Solar Market Snapshot: 73.32 GW Installed Base and 280 GW Ambition
India’s solar sector has scaled from near-zero to a globally significant installed base, but the math to reach 2030 targets demands a step-change in annual deployment. India’s cumulative installed solar power capacity reached 73.32 GW as of March 31, 2024 (MNRE, Government of India, 2024), representing 16.1% of total installed power capacity (CEA, Government of India, 2024).
The government has set a target of 280 GW of installed solar capacity by 2030 as part of a broader 500 GW non-fossil fuel goal (CEA, Government of India, 2020). Closing the gap from 73.32 GW to 280 GW in six years requires adding 206.68 GW — an average of 34.5 GW annually. India added 12.78 GW of solar capacity in FY2023-24 (MNRE, 2024), meaning the required annual run rate is 2.7x the current pace.
Three deployment scenarios frame the investment opportunity:
| Scenario | Annual Addition (GW) | 2030 Installed Base (GW) | Implied CAGR |
|---|---|---|---|
| Base Case (linear acceleration) | 22-28 GW | ~210-230 GW | ~18% |
| Accelerated (policy + grid unlock) | 30-38 GW | ~255-275 GW | ~22% |
| Target Achievement | 34.5 GW | 280 GW | ~25% |
The base case is the most defensible given historical execution rates. Investors should model the 210-230 GW range as the realistic 2030 outcome, with the 280 GW figure representing a policy ceiling rather than a central forecast.

Utility-Scale Auction Economics: From INR 10/kWh to Sub-INR 2.50 Tariffs
Utility-scale solar auctions have driven India’s capacity growth, and tariff trajectories directly determine project bankability. The average tariff discovered in India’s solar auctions fell to approximately INR 2.44/kWh in 2017 from around INR 10-12/kWh in 2010 (CEA, Government of India, 2020) — a reduction of roughly 80% in seven years, driven by global module cost deflation, competitive bidding, and developer learning curves.
For the 2026-2031 period, the tariff compression story is largely over. Module prices have stabilized after the 2022-2023 supply chain disruptions, and the introduction of Basic Customs Duty (BCD) of 40% on solar modules and 25% on cells has structurally raised the cost floor for imported equipment. Forward tariff projections for new auctions sit in the INR 2.20-2.50/kWh range, with downside risk if domestic PLI manufacturing delivers cost-competitive modules by 2027.
LCOE Calculation Methodology
Levelized Cost of Energy (LCOE) is the all-in cost per unit of electricity generated over a project’s lifetime, expressed in INR/kWh. It accounts for capital expenditure, operating costs, financing costs, and energy yield. The standard formula is:
LCOE = (Total Lifetime Costs) / (Total Lifetime Energy Output)
For a utility-scale project in India’s high-irradiance states:
- CapEx: INR 38-45 million per MW (2024-2026 vintage, including EPC and land)
- Annual O&M: INR 0.8-1.0 million per MW
- Capacity Utilization Factor (CUF): 22-28% depending on location
- Project life: 25 years
- WACC: 9-11% (blended debt-equity)
At these inputs, LCOE for a well-sited Rajasthan project runs approximately INR 2.10-2.30/kWh, leaving a thin but positive margin against current auction tariffs. India’s solar sector has benefited from a global trend in which the cost of solar photovoltaic electricity fell by 90% between 2010 and 2020 (IRENA), underscoring how dramatically the economics of the technology have shifted over a single decade.
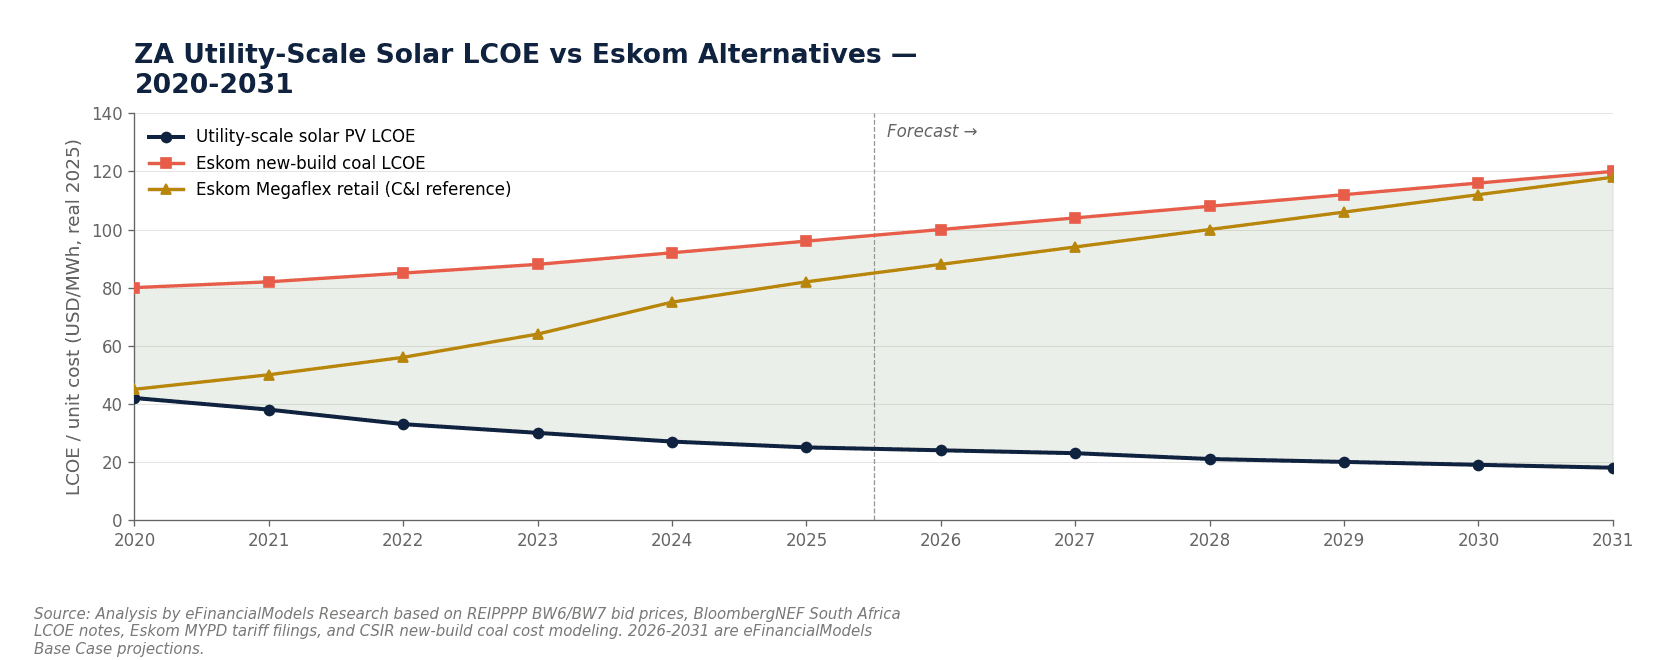
LCOE for a well-sited Rajasthan project runs INR 2.10-2.30/kWh at current CapEx levels, leaving a thin positive margin against auction tariffs.
Rooftop Solar Deployment Gap: 11.08 GW Against 40 GW Target
Rooftop solar is the most underperforming segment in India’s solar program, and understanding why matters for anyone forecasting the 2026-2031 market. India’s National Solar Mission originally targeted 40 GW of rooftop solar and 60 GW of ground-mounted capacity by 2022 (MNRE, 2019). Actual rooftop capacity reached only 11.08 GW as of December 31, 2023 (MNRE, 2023) — a 72% shortfall against the revised target.
The failure points are specific and structural:
- Net metering policy reversals: Several state DISCOMs (electricity distribution companies) capped net metering at 10 kW or switched to gross metering, eliminating the financial case for residential installations.
- DISCOM resistance: Distribution companies lose revenue when rooftop generation displaces grid sales. Many have delayed interconnection approvals by 6-18 months.
- Financing access: Small commercial and residential customers cannot access project finance at utility-scale rates. Effective cost of capital for sub-1 MW systems runs 14-18%, versus 8-10% for large IPPs.
- Awareness and trust gaps: First-generation solar buyers face information asymmetry on system quality, installer credentials, and performance guarantees.
For 2026-2031, the PM Surya Ghar Muft Bijli Yojana scheme targets 10 million rooftop installations. Even at 3 kW average system size, that adds only 30 GW — still short of the original 40 GW target. Realistic rooftop forecasts for 2031 sit at 25-35 GW cumulative, implying 14-24 GW of new installations over the forecast period.
PLI Manufacturing Scheme and Supply Chain Localization 2026-2031
India’s Production-Linked Incentive (PLI) scheme for solar PV manufacturing is the most consequential supply-side policy for the 2026-2031 investment cycle. The PLI scheme provides financial incentives to manufacturers based on incremental production above a baseline, rewarding domestic output rather than installed capacity. The government approved PLI tranches targeting approximately 10 GW of integrated solar module manufacturing capacity, with disbursements linked to production milestones over five years.
The strategic rationale is clear: India currently imports over 80% of its solar modules, predominantly from China. The 40% Basic Customs Duty on modules introduced in April 2022 raised project CapEx by an estimated INR 3-5 million per MW for developers relying on imported equipment. Domestic PLI-backed manufacturers, including Adani Solar, Waaree Energies, and Vikram Solar, are scaling gigawatt-scale integrated facilities that could supply 15-20 GW annually by 2027.
For project developers, the supply chain transition creates a 2025-2027 transition risk: domestic capacity is not yet sufficient to meet demand at competitive prices, but import duties make Chinese modules expensive. Developers bidding in 2025-2026 auctions must model a blended supply scenario and stress-test CapEx assumptions against a INR 5-8 million/MW range.
State-Level Market Dynamics and Regional Investment Priorities
India is not a monolithic solar market. State-level variation in solar resource quality, auction pipeline, grid infrastructure, and DISCOM financial health creates materially different risk-return profiles across regions.
| State | Solar Resource (GHI kWh/m²/yr) | Auction Pipeline Strength | DISCOM Credit Risk | Key Risk |
|---|---|---|---|---|
| Rajasthan | 2,000-2,200 | Very High | Moderate | Land acquisition delays |
| Gujarat | 1,900-2,100 | High | Low | Grid congestion in some zones |
| Karnataka | 1,700-1,900 | High | Low-Moderate | Curtailment risk |
| Andhra Pradesh | 1,800-2,000 | Moderate | High | PPA renegotiation history |
| Tamil Nadu | 1,700-1,900 | Moderate | Moderate | Transmission constraints |
| Uttar Pradesh | 1,600-1,800 | Growing | High | Payment delays |
| Odisha / West Bengal | 1,500-1,700 | Low | High | Infrastructure gaps |
Rajasthan and Gujarat remain the preferred destinations for utility-scale investment, combining high irradiance, large land parcels, and relatively mature auction frameworks. Andhra Pradesh carries elevated risk after its 2019 attempt to renegotiate PPAs (Power Purchase Agreements — long-term contracts between generators and buyers that lock in tariff and volume terms), which damaged investor confidence and triggered international arbitration.
Financial Modeling Framework: 100 MW Solar Project IRR and NPV
A worked financial example grounds the investment thesis in real numbers. The following analysis models a 100 MW utility-scale solar project commissioned in 2026 in Rajasthan under a 25-year PPA.
Project Assumptions
- Installed capacity: 100 MW DC
- PPA tariff: INR 2.40/kWh (fixed, 25-year)
- Capacity Utilization Factor (CUF): 26% (Rajasthan high-irradiance site)
- Annual energy generation: 100 MW × 26% × 8,760 hours = 227.76 million kWh
- CapEx: INR 40 million/MW = INR 4,000 million total
- Debt-equity ratio: 70:30 (INR 2,800M debt / INR 1,200M equity)
- Debt interest rate: 9.5% per annum, 18-year tenor
- Annual O&M: INR 0.9 million/MW = INR 90 million/year (escalating at 3% p.a.)
- Degradation rate: 0.5% per year on energy output
- Tax rate: 25.17% (Indian corporate tax)
Year 1 Revenue and Cash Flow
Here’s the math:
- Gross Revenue: 227.76M kWh × INR 2.40 = INR 546.6 million
- O&M Cost: INR 90 million
- EBITDA: INR 456.6 million
- Debt Service (Year 1): Principal + Interest ≈ INR 280 million (approximate, based on annuity structure)
- Pre-tax Cash Flow to Equity: INR 456.6M – INR 280M = INR 176.6 million
- Tax (simplified): INR 44.4 million
- Post-tax Equity Cash Flow (Year 1): approximately INR 132 million
IRR and NPV Calculation
The equity IRR (Internal Rate of Return — the discount rate at which the net present value of all equity cash flows equals zero) is calculated by solving for the rate that discounts 25 years of post-tax equity cash flows back to the initial equity investment of INR 1,200 million.
Under base-case assumptions, the equity IRR for this project sits at approximately 12.8%. The project NPV at a 10% equity discount rate is approximately INR 320 million (positive, indicating value creation above the hurdle rate).
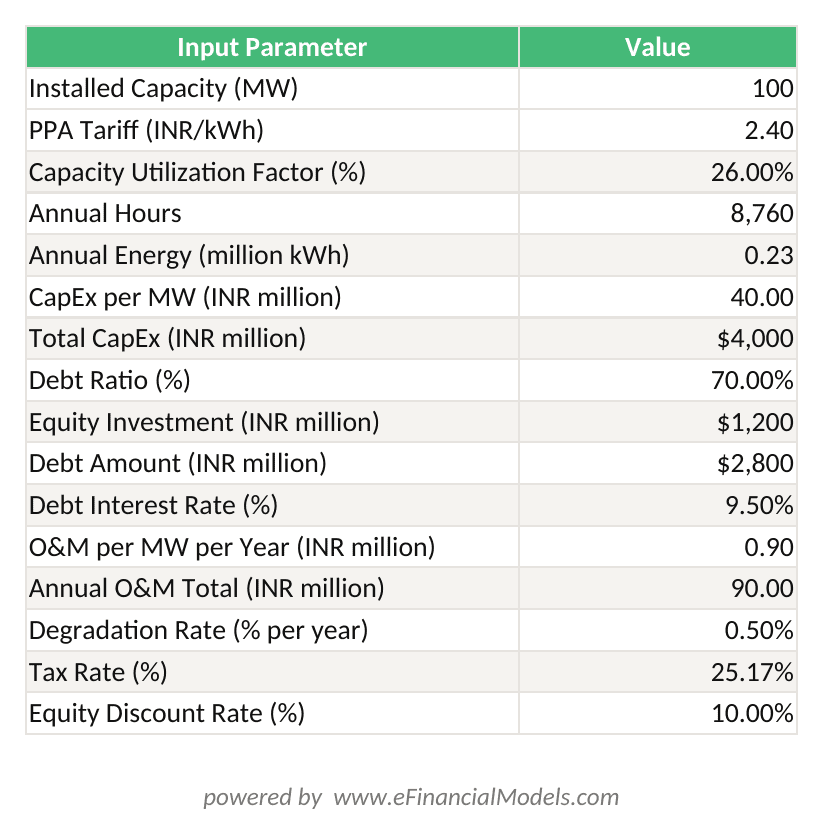
Base case: 100 MW Rajasthan solar project, INR 2.40/kWh PPA, INR 40M/MW CapEx, 70:30 D/E, 9.5% debt cost — equity IRR 12.8%, NPV INR 320M at 10% hurdle rate.
IRR Sensitivity Table
| CapEx (INR M/MW) | Tariff INR 2.20/kWh | Tariff INR 2.40/kWh | Tariff INR 2.60/kWh |
|---|---|---|---|
| 35 | 11.2% | 13.8% | 16.1% |
| 40 | 9.8% | 12.8% | 15.0% |
| 45 | 8.4% | 11.2% | 13.5% |
The table shows that at INR 45M/MW CapEx and INR 2.20/kWh tariff, equity IRR drops to 8.4% — below most institutional hurdle rates of 10-12%. CapEx discipline and tariff floor protection are the two most critical levers for project bankability.
For a deeper sensitivity analysis with your own assumptions, the Solar Energy Financial Model on EFM provides a fully integrated 25-year DCF with debt sculpting and scenario toggles.
Transmission Infrastructure and Grid Integration Constraints
Transmission bottlenecks are the most underappreciated risk in India’s solar scale-up. Grid infrastructure readiness, not auction pipeline, is the binding constraint in several high-irradiance states. India’s Green Energy Corridors program (Phase I and Phase II) has committed investment to build dedicated transmission lines evacuating renewable power from solar-rich states to load centers, but execution has lagged commissioning timelines by 18-36 months in multiple cases.
Key transmission risks for 2026-2031 projects include:
- Curtailment: Grid operators instruct generators to reduce output when transmission lines are congested. Curtailment rates of 5-15% have been observed in Karnataka and Tamil Nadu, directly reducing revenue against PPA assumptions.
- Evacuation infrastructure delays: Projects commissioned without matching transmission capacity face months of zero-revenue operation, destroying IRR.
- Interstate transmission charges: Projects selling power across state lines face additional charges that can add INR 0.20-0.40/kWh to effective cost, eroding margins.
Developers should require transmission readiness certificates before financial close and model a 5% curtailment haircut on energy yield in base-case projections.
Policy and Regulatory Risk Assessment Through 2031
Policy risk in India’s solar sector is real, quantifiable, and unevenly distributed across project vintages. The four highest-impact risk categories for 2026-2031 investments are:
1. Customs Duty and GST Treatment: The 40% Basic Customs Duty on modules and 25% on cells, introduced in 2022, significantly raised CapEx for developers without grandfathering provisions. GST treatment of solar components has shifted multiple times, creating input tax credit uncertainty. Projects bidding today must assume current duty structures persist, but model a scenario where duties are reduced as domestic manufacturing scales.
2. PPA Renegotiation Risk: Andhra Pradesh’s 2019 attempt to unilaterally reduce tariffs on signed PPAs remains the sector’s most damaging precedent. While central government intervention and court rulings have largely protected existing contracts, state-level political risk requires careful counterparty assessment.
3. Land Acquisition Timelines: Large utility-scale projects require 4-6 acres per MW. In Rajasthan, land acquisition for a 500 MW project can take 18-36 months and add INR 1-3 million/MW to effective CapEx. Delays push commissioning past PPA longstop dates, triggering penalties.
4. Payment Security Mechanisms: The PRAAPTI portal tracks DISCOM payment delays to generators. Average Days Sales Outstanding (DSO) for solar developers ranges from 60 days in Gujarat to over 180 days in some eastern states. The Letter of Credit mechanism mandated under ISTS (Inter-State Transmission System) projects provides partial protection, but enforcement remains inconsistent.
For a structured approach to evaluating these risks before committing capital, the Renewable Energy Template Bundle includes a policy risk scoring matrix calibrated to Indian market conditions.
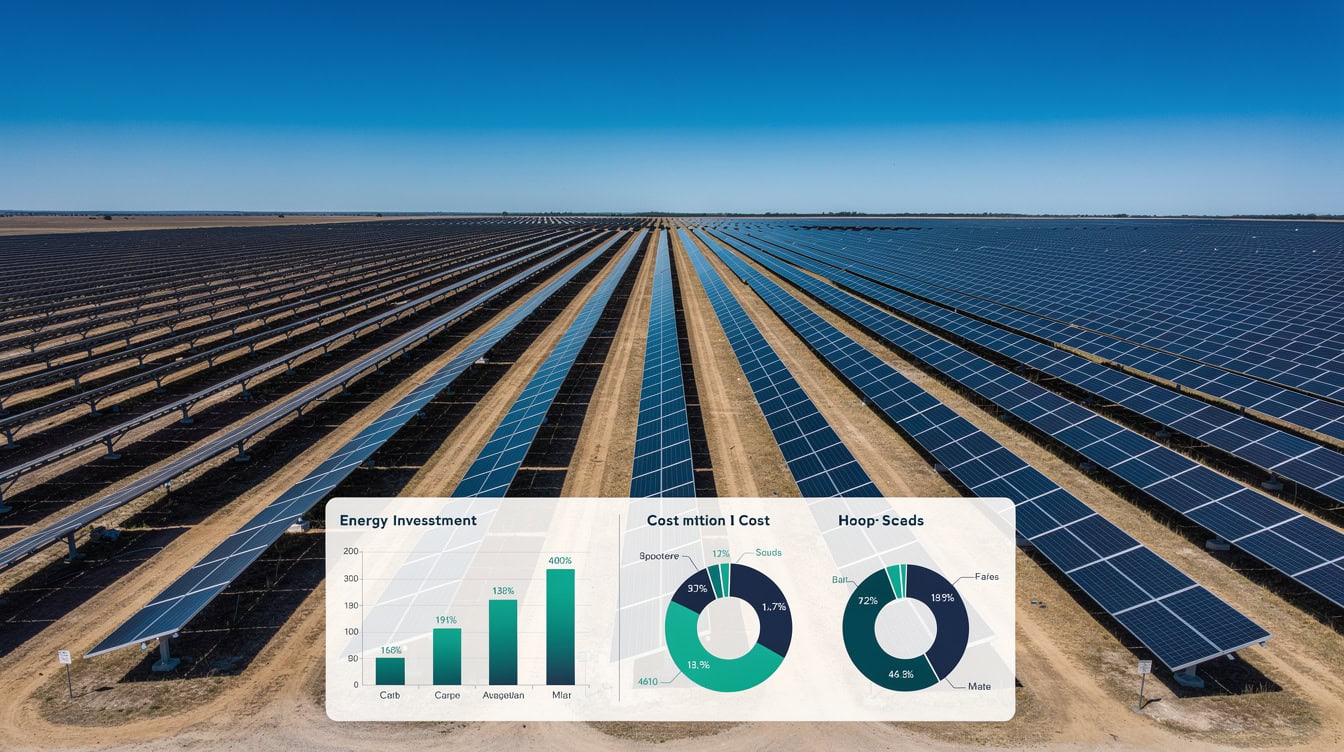
PPA renegotiation risk (Andhra Pradesh precedent) and land acquisition delays represent the highest-impact policy risks for utility-scale solar projects through 2031.
Competitive Landscape: Developer Market Share and Consolidation Trends
India’s utility-scale solar market has consolidated rapidly around a small number of large integrated developers. The top five players — Adani Green Energy, Tata Power Renewable Energy, ReNew Power, Azure Power, and NTPC Renewable Energy — collectively hold an estimated 35-40% of installed utility-scale capacity, with Adani Green alone targeting 50 GW by 2030.
Domestic conglomerates hold structural advantages: access to cheaper capital through parent company balance sheets, integrated EPC capabilities that reduce CapEx, and political relationships that smooth land and grid approvals. International independent power producers (IPPs) have faced headwinds from currency risk, repatriation constraints, and the 2022 customs duty changes that disproportionately affected developers without domestic manufacturing.
Consolidation trends expected through 2031:
- Vertical integration: Leading developers are acquiring or building domestic module manufacturing capacity to hedge import duty risk and secure supply.
- Platform acquisitions: Mid-tier developers (500 MW to 2 GW portfolios) are attractive acquisition targets for infrastructure funds seeking yield assets with contracted cash flows.
- International exits: Several international developers have sold Indian portfolios to domestic players, citing currency risk and regulatory complexity. This trend is likely to continue.
For investors evaluating the competitive dynamics in more detail, the India Solar Energy Market Study 2026-2031 includes developer pipeline data, market share analysis, and M&A transaction benchmarks.
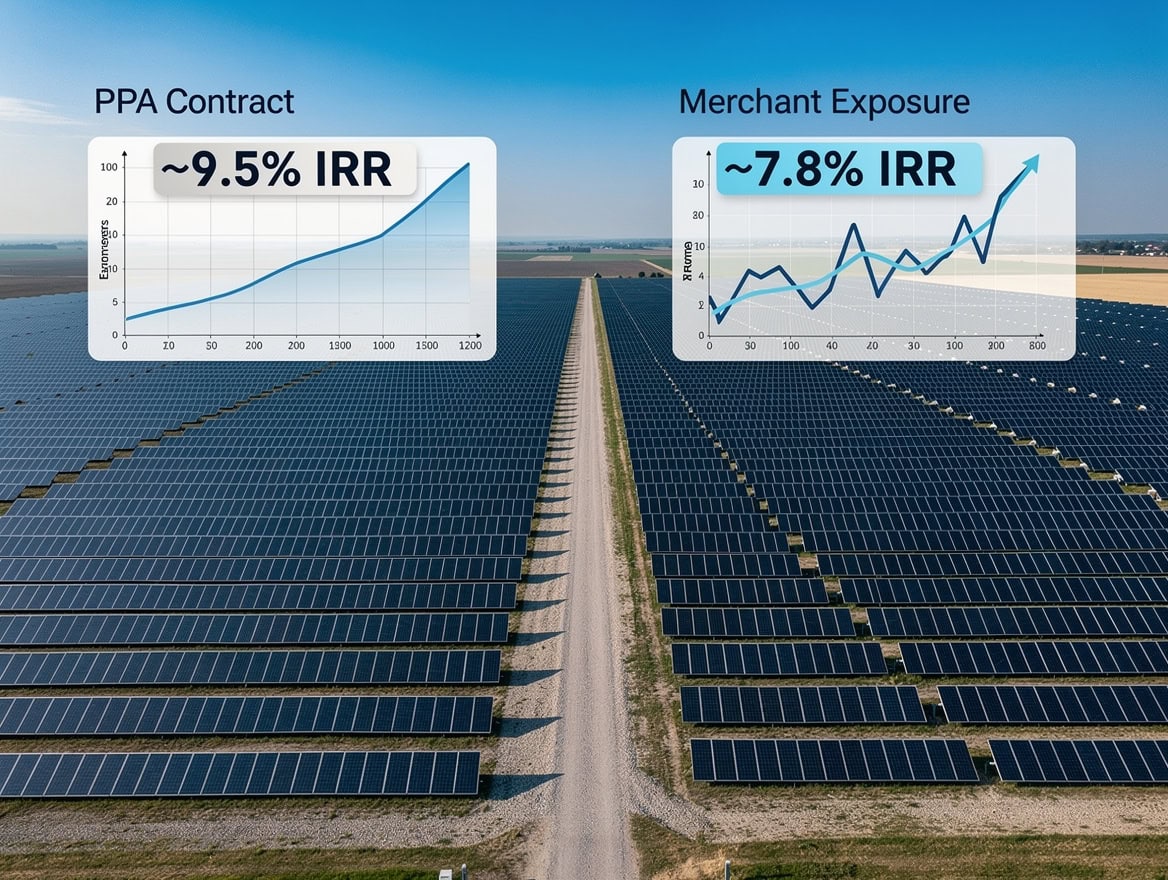
The top 5 developers hold 35-40% of utility-scale capacity; Adani Green alone targets 50 GW by 2030, driving rapid consolidation among mid-tier players.
Investment Thesis and 2026-2031 Deployment Forecast
India’s solar market offers a compelling but execution-dependent investment thesis for the 2026-2031 period. The demand fundamentals are unambiguous: India’s electricity consumption is growing at 6-7% annually, coal plant retirements are accelerating, and the government has staked international climate commitments on renewable scale-up. The supply-side constraints — transmission, land, financing, and domestic manufacturing — are solvable but require capital and policy coordination. India has committed to achieving net-zero emissions by 2070 and has pledged that 50% of its cumulative electric power installed capacity will come from non-fossil fuel-based energy resources by 2030 (UNFCCC, India’s Updated NDC, 2022), providing a durable long-term policy anchor for solar investment.
The most attractive investment windows in the 2026-2031 cycle are:
- Utility-scale projects in Rajasthan and Gujarat with secured transmission evacuation and creditworthy off-takers (SECI, NTPC, or investment-grade state DISCOMs).
- Domestic module manufacturing backed by PLI incentives, targeting the captive demand of large developer groups.
- Rooftop C&I (Commercial and Industrial) solar for large industrial consumers who can bypass DISCOM entirely under open access regulations, achieving effective tariffs of INR 3.50-5.00/kWh versus grid rates of INR 6-9/kWh.
- Platform plays: Acquiring operational assets at 8-10x EBITDA from developers needing balance sheet relief, then refinancing at lower rates as the portfolio seasons.
The Start Up Solar Farm Excel Model and Valuation provides a ready-to-use financial model for evaluating greenfield and acquisition scenarios across these investment themes.
Frequently Asked Questions
What annual solar installation rate does India need to hit 280 GW by 2030?
India needs to add approximately 34.5 GW of solar capacity per year from 2024 to 2030 to reach the 280 GW target. In FY2023-24, India added 12.78 GW according to MNRE data, meaning the required pace is roughly 2.7 times the current run rate. Most independent analysts consider the 280 GW figure an aspirational ceiling rather than a central forecast. A realistic base case, assuming gradual acceleration in auctions, grid investment, and financing availability, points to 210-230 GW of cumulative solar capacity by 2030. Investors should model both scenarios and stress-test project pipelines against the lower bound.
Why has rooftop solar so dramatically underperformed its 40 GW target?
Rooftop solar reached only 11.08 GW against a 40 GW National Solar Mission target as of December 2023 — a 72% shortfall. The failure is structural, not accidental. DISCOMs (electricity distribution companies) actively resist rooftop adoption because it erodes their revenue base. Net metering policy has been diluted or capped in multiple states, removing the financial incentive for residential and small commercial customers. Financing costs for sub-1 MW systems run 14-18%, versus 8-10% for large utility-scale projects, making the economics marginal for most households. The PM Surya Ghar scheme aims to address this through subsidies and simplified approvals, but execution will determine whether the 2031 rooftop forecast of 25-35 GW is achievable.
What is a realistic equity IRR for a utility-scale solar project in India in 2026?
A well-structured 100 MW utility-scale project in Rajasthan, commissioned in 2026 at INR 40 million/MW CapEx, a 25-year PPA at INR 2.40/kWh, 70:30 debt-equity, and 9.5% debt cost generates an equity IRR of approximately 12.8% under base-case assumptions. IRR is sensitive to CapEx and tariff: at INR 45M/MW CapEx and INR 2.20/kWh tariff, IRR drops to 8.4%, below most institutional hurdle rates. Transmission curtailment of 5-10% and payment delays of 90-180 days can further reduce effective IRR by 100-200 basis points. Investors should run full sensitivity tables before committing to a bid tariff.
How does the PLI scheme affect project economics for solar developers?
The Production-Linked Incentive (PLI) scheme provides financial incentives to domestic solar module manufacturers based on incremental production volumes. For project developers, the PLI scheme’s primary impact is indirect: as domestic manufacturing capacity scales toward 15-20 GW annually by 2027, module prices for Indian-made products should converge toward import parity, reducing the CapEx penalty imposed by the 40% Basic Customs Duty on imported modules. Developers who secure long-term supply agreements with PLI-backed manufacturers in 2025-2026 can lock in module costs at INR 18-22 million/MW, versus INR 22-28 million/MW for duty-paid imports. This CapEx reduction of INR 3-6 million/MW translates directly to 100-200 basis points of additional equity IRR.
Which Indian states offer the best risk-adjusted returns for solar investment?
Rajasthan and Gujarat consistently offer the best risk-adjusted returns for utility-scale solar investment. Both states combine high solar irradiance (Global Horizontal Irradiance of 1,900-2,200 kWh/m²/year), large land availability, mature auction frameworks, and relatively creditworthy off-takers. Gujarat’s DISCOMs have a strong payment track record, while Rajasthan’s RUVNL (Rajasthan Urja Vikas Nigam Limited) has maintained consistent auction volumes. Karnataka offers strong irradiance but carries moderate curtailment risk. Andhra Pradesh and Uttar Pradesh carry elevated credit and policy risk, requiring higher tariff bids or additional payment security mechanisms to achieve acceptable IRR.
What are the main transmission risks for solar projects in India?
Transmission risk is the most underappreciated execution risk in India’s solar scale-up. Projects commissioned without matching evacuation infrastructure face curtailment — forced output reduction when grid lines are congested — at rates of 5-15% in constrained states like Karnataka and Tamil Nadu. Curtailment of 10% on a 100 MW project at INR 2.40/kWh reduces annual revenue by approximately INR 54.8 million, cutting equity IRR by roughly 80-120 basis points. Developers should require transmission readiness certificates before financial close, model a 5% base-case curtailment haircut, and include force majeure provisions for grid unavailability in PPA negotiations.
How do I model the financial feasibility of an Indian solar project?
A robust financial model for an Indian utility-scale solar project requires at minimum: a 25-year DCF (Discounted Cash Flow) model with annual energy yield calculations incorporating CUF and degradation, a debt service schedule with sculpted repayments, tax calculations including accelerated depreciation benefits, and sensitivity tables across tariff, CapEx, CUF, and interest rate assumptions. The key output metrics are equity IRR, project IRR, DSCR (Debt Service Coverage Ratio — the ratio of operating cash flow to debt service, with lenders typically requiring a minimum of 1.20x), and NPV at the equity hurdle rate. For a ready-built model with Indian-specific inputs, the Solar Energy Financial Model on EFM covers all these components.
Conclusion
India’s solar market between 2026 and 2031 presents one of the largest renewable energy investment opportunities globally, but the gap between government targets and execution reality demands rigorous financial analysis rather than policy optimism. The 73.32 GW installed base must grow to 280 GW by 2030 — a target that requires 2.7x the current annual installation rate. Utility-scale economics remain viable at INR 2.20-2.50/kWh tariffs for well-sited projects with disciplined CapEx. Rooftop solar will grow but will not close its 40 GW target gap. PLI manufacturing will reduce import dependency but introduces a 2025-2027 supply transition risk. State selection, transmission security, and off-taker creditworthiness are the three variables that separate bankable projects from stranded assets.
I recommend downloading the India Solar Energy Market Study 2026-2031 to access granular scenario modeling, state-by-state pipeline data, developer market share analysis, and a fully integrated financial model with sensitivity tables calibrated to 2026-2031 deployment assumptions. It’s the fastest way to move from market overview to investment decision.

























































