
0 ITEMS

Caribbean Rum Market Study: Financial Analysis 2026-2031

Key Takeaways
- The global rum market is forecast to grow from $37.53 billion in 2026 to $44.49 billion by 2031, a 3.46% CAGR, giving investors a clear 5-year revenue runway for DCF modeling.
- Rum’s 3.46% CAGR trails the broader spirits market’s 3.56% CAGR ($664.37B to $791.22B), signaling that rum must capture share from faster-growing categories to outperform the sector benchmark.
- Asia-Pacific controls 45.31% of global spirits volume, making it the primary export target for Caribbean producers seeking revenue diversification beyond the U.S. and European markets.
- The Middle East and Africa region posts the fastest spirits growth at a 5.09% CAGR through 2031, representing an underweighted opportunity in most Caribbean rum export models.
- White spirits grow at 4.07% CAGR through 2031, outpacing the overall rum category and creating a strategic case for unaged Caribbean cane spirits as a premiumization play.
- The U.S. rum market expands from $3.21 billion in 2026 to $4.82 billion by 2034, providing an 8-year revenue build-up anchor for market-entry financial models.
- Two leading data providers report rum market baselines that differ by more than 2x ($17.25B vs $37.53B); analysts must reconcile scope definitions before using either figure as a DCF input.
Caribbean rum investment modeling combines global market forecasts, geographic revenue splits, and DCF inputs into a single analytical framework for 2026–2031.
Executive Summary: Caribbean Rum Market Financial Landscape 2026–2031
The Caribbean rum investment thesis rests on a global market growing steadily through 2031, but the financial modeling work begins with understanding exactly which market you are sizing. The global rum market is forecast at $37.53 billion in 2026, reaching $44.49 billion by 2031 at a 3.46% CAGR (Mordor Intelligence), and Caribbean producers sit at the origin of that supply chain.
For private equity analysts and corporate development teams, the 2026–2031 window offers a defined forecast horizon that maps cleanly onto a standard 5-year investment hold period. The key modeling inputs are the CAGR, geographic revenue splits, category mix shifts, and the reconciled baseline figure. Each of these translates directly into a revenue build-up, a discounted cash flow (DCF) model, and a set of comparable transaction multiples. This article walks through each step.

The 2x+ gap between data providers reflects consumer-price vs producer-price scope differences, not forecast error. Analysts must document their chosen definition before building revenue models.
Global Rum Market Baseline: Reconciling the $17.25B vs $37.53B Data Discrepancy
Two credible data providers report rum market baselines that differ by more than 2x, and every financial model built on either figure will produce materially different outputs unless the analyst understands why. Market Data Forecast values the global rum market at $17.25 billion in 2024 with a 5.5% CAGR to $27.93 billion by 2033 (Market Data Forecast), while Mordor Intelligence places the 2026 figure at $37.53 billion with a 3.46% CAGR to $44.49 billion by 2031 (Mordor Intelligence).
The discrepancy almost certainly reflects three methodological differences:
1. Scope definition. Mordor likely includes on-trade (bars, restaurants, hotels) and off-trade (retail) revenue at consumer prices, while Market Data Forecast may use producer or wholesale pricing. Consumer-price market sizing typically runs 2x to 2.5x producer-price sizing for spirits categories.
2. Geographic coverage. A report including all rum-adjacent cane spirits (cachaça, aguardiente, rhum agricole) will produce a larger baseline than one restricted to labeled rum SKUs.
3. Base year timing. A 2024 baseline at $17.25B growing at 5.5% for two years reaches approximately $19.2B by 2026, still well below $37.53B. This confirms the gap is primarily definitional, not temporal.
Analyst action: Before using either figure in a DCF or market-sizing model, document which definition you are adopting, apply it consistently across all revenue build-up assumptions, and run a sensitivity analysis (a sensitivity analysis tests how your output changes when one input changes) using both baselines as bookend scenarios. The Mordor figure is the more commonly cited institutional benchmark and is used as the primary reference throughout this article.
| Data Source | Base Year | Market Size | CAGR | End Year | End Value |
|---|---|---|---|---|---|
| Mordor Intelligence | 2026 | $37.53B | 3.46% | 2031 | $44.49B |
| Market Data Forecast | 2024 | $17.25B | 5.50% | 2033 | $27.93B |
| Implied Mordor 2024 back-calc | 2024 | ~$35.1B | 3.46% | 2031 | $44.49B |
| Market Data Forecast (U.S. only) | 2026 | $3.21B | ~5.2% | 2034 | $4.82B |
Table 1: Rum market data source comparison. The 2x+ gap between providers reflects scope and pricing-level differences, not forecast error.

Asia-Pacific’s 45.31% spirits market dominance and MEA’s 5.09% CAGR define the two highest-priority export corridors for Caribbean rum producers seeking revenue diversification.
Market Growth Drivers: Unpacking the 3.46% CAGR Through 2031
A 3.46% CAGR is a steady, inflation-plus growth rate that supports a moderate-growth investment thesis rather than a high-growth venture bet. For financial modelers, this CAGR translates into a compound growth factor of 1.187x over five years, meaning a $100M revenue business in 2026 projects to approximately $118.7M by 2031 before any market share gains.
The primary drivers behind this growth rate are:
- Premiumization: Consumers in developed markets are trading up from value rum to aged, single-origin, and craft expressions. Higher average selling prices (ASPs) expand revenue faster than volume, improving gross margin profiles for producers.
- Emerging market volume growth: Asia-Pacific and Middle East/Africa are adding new rum consumers at a faster rate than mature markets, driving volume even as ASPs remain lower.
- On-trade recovery: Post-pandemic hospitality recovery in the Caribbean, Europe, and North America continues to rebuild on-trade rum volumes through 2026–2028.
- Category innovation: Spiced, flavored, and ready-to-drink (RTD) rum formats are expanding the addressable consumer base beyond traditional rum drinkers.
For a DCF model, the 3.46% CAGR serves as the market-level revenue growth assumption in the base case. Bull and bear cases should bracket this at 5.0% and 1.5% respectively, reflecting the range between the two data provider forecasts.
Rum Within the Broader Spirits Market: Comparative Growth Analysis
Rum’s 3.46% CAGR underperforms the overall spirits market’s 3.56% CAGR, which means rum is projected to lose a small amount of category share within spirits over the forecast period. The global spirits market is estimated at $664.37 billion in 2026 and projected to reach $791.22 billion by 2031 (Mordor Intelligence), implying rum represents approximately 5.6% of total spirits revenue at the 2026 baseline ($37.53B / $664.37B). The United States alone is home to more than 2,000 craft distilleries (Distilled Spirits Council of the United States), illustrating the competitive density that Caribbean exporters must navigate even within a single market.
This 10-basis-point CAGR gap (3.46% vs 3.56%) is modest but directionally important for investment memos. It means:
- A Caribbean rum business growing at exactly the market rate is not gaining share.
- To justify a premium acquisition multiple, a target must demonstrate a credible path to growing at 4%+ through geographic expansion, premiumization, or category innovation.
- Comparable company analysis (a valuation method using trading multiples from similar public companies) for rum businesses should reference the broader premium spirits peer group, not just rum-specific comps, because the category is too small and too thinly traded to produce a robust standalone comp set.
| Category | 2026 Market Size | 2031 Forecast | CAGR | Rum Share of Spirits |
|---|---|---|---|---|
| Global Spirits | $664.37B | $791.22B | 3.56% | — |
| Global Rum | $37.53B | $44.49B | 3.46% | ~5.6% |
| White Spirits | subset of spirits | — | 4.07% | — |
| Middle East & Africa Spirits | subset | — | 5.09% | — |
Table 2: Rum vs broader spirits market growth comparison. Rum’s 10-bps CAGR gap signals modest share erosion without active portfolio management.

Aged rum delivers higher ASPs and margins but locks capital in barrel inventory for 8+ years. White rum’s 4.07% CAGR tailwind makes unaged Caribbean cane spirits a compelling portfolio complement.
Geographic Revenue Distribution: Asia-Pacific Dominance and Emerging Markets
Asia-Pacific accounted for 45.31% of the global spirits market in 2025, while the Middle East and Africa region is projected to be the fastest-growing with a 5.09% CAGR through 2031 (Mordor Intelligence). For Caribbean rum producers, these two data points define the export strategy matrix.
Applying the 45.31% Asia-Pacific share to the $664.37B spirits market implies approximately $301B in Asia-Pacific spirits revenue in 2026. Rum’s 5.6% share of spirits, if maintained proportionally, implies a theoretical Asia-Pacific rum market of roughly $16.9B. In practice, rum’s penetration in Asia-Pacific is far below its global average because baijiu, whisky, and local spirits dominate the region. This gap is the opportunity: even a 1-percentage-point share gain in Asia-Pacific rum penetration represents billions in addressable revenue. The International Wine and Spirits Research (IWSR) has noted that spirits consumption in Asia-Pacific grew by more than 3% in volume terms in recent years (IWSR), underscoring the structural demand tailwind that Caribbean exporters can target.
For export revenue modeling, analysts should build a three-region model:
- Americas (base): Mature market, moderate growth, high brand awareness. Use the U.S. $3.21B–$4.82B trajectory as the anchor.
- Europe (secondary): Established rum culture in the UK, Germany, and Spain. Growth is premiumization-driven rather than volume-driven.
- Asia-Pacific and MEA (growth): Low base, high CAGR, distribution-intensive. Model as a separate revenue stream with higher selling costs and longer ramp periods.
Product Category Dynamics: White Spirits Growth vs Traditional Aged Rum
White spirits, including vodka, gin, and unaged cane spirits, are forecast to post the highest product-category growth in the global spirits market with a CAGR of 4.07% through 2031 (Mordor Intelligence). This 61-basis-point premium over the overall rum CAGR (4.07% vs 3.46%) has direct implications for Caribbean producers deciding between aged and unaged product portfolios. To put the scale of the white spirits opportunity in context, vodka alone accounted for approximately 34% of all spirits volumes globally in recent years (IWSR), meaning unaged Caribbean cane spirits compete in an enormous and well-established consumer segment.
Caribbean unaged cane spirits (white rum, rhum agricole blanc, clairin) compete directly in the white spirits category. A producer with a meaningful unaged portfolio can credibly argue for a higher revenue growth assumption in their financial model, potentially justifying a higher EV/Revenue multiple relative to a pure aged-rum producer.
The strategic trade-off for financial modeling:
- Aged rum: Higher ASP, stronger margin profile, but slower volume growth and significant working capital tied up in barrel inventory. A 12-year aged rum requires 12 years of inventory financing before the first bottle is sold.
- Unaged/white rum: Lower ASP, faster inventory turns, higher volume growth, but more competitive pricing pressure from vodka and gin.
- Blended portfolio: The optimal financial model for most Caribbean producers combines both, using white rum cash flows to fund aged rum inventory build-up.
For DCF purposes, a blended portfolio with 40% white/unaged and 60% aged is a reasonable base-case assumption for a mid-size Caribbean distillery, pending actual product mix data from the target.
U.S. Market Case Study: Building a $3.21B to $4.82B Revenue Model
The U.S. rum market provides the cleanest data set for building a bottom-up revenue model. The U.S. rum market size is estimated at $3.21 billion in 2026 and is forecast to reach $4.82 billion by 2034 (Market Data Forecast), implying an 8-year CAGR of approximately 5.2%. For additional context on the scale of U.S. spirits consumption, Americans consumed approximately 305 million 9-liter cases of distilled spirits in 2022 (Distilled Spirits Council of the United States), providing a volume denominator against which Caribbean rum’s share can be benchmarked.
Here’s the math for a Caribbean rum producer targeting 0.5% U.S. market share by 2031:
Step 1: Project the U.S. market to 2031.
Using the 5.2% CAGR from the 2026 base: $3.21B × (1.052)^5 = $3.21B × 1.289 = approximately $4.14B by 2031.
Step 2: Apply a market share target.
0.5% of $4.14B = $20.7M in U.S. revenue by 2031.
Step 3: Back-solve the required growth rate.
If the producer currently generates $8M in U.S. revenue (2026), reaching $20.7M by 2031 requires a CAGR of: ($20.7M / $8M)^(1/5) – 1 = 1.209 – 1 = 20.9% annual U.S. revenue growth.
Step 4: Stress-test the assumption.
A 20.9% U.S. revenue CAGR for a Caribbean rum brand is aggressive but achievable for a premium, craft-positioned product with active distribution investment. The bear case (0.25% market share) implies $10.35M and a 5.3% CAGR, which is market-rate growth with no share gain.
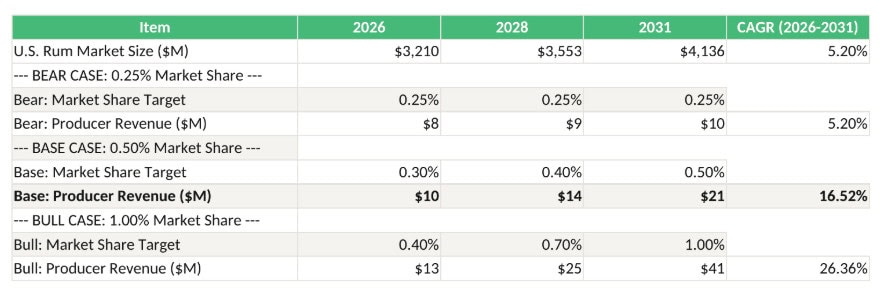
Three-scenario U.S. revenue model: a Caribbean producer targeting 0.5% market share by 2031 projects $20.7M in U.S. revenue, requiring a 20.9% CAGR from an $8M 2026 base.
This three-scenario structure (bear/base/bull) forms the core of the revenue build-up section in any Caribbean rum investment memo.
Financial Modeling Framework: From Market Data to DCF Inputs
Translating market research into a working DCF model requires five specific conversions. A DCF (discounted cash flow) model values a business by projecting future free cash flows and discounting them back to present value at a rate that reflects investment risk.
Conversion 1: CAGR to annual revenue growth rates.
The 3.46% market CAGR becomes the base-case top-line growth assumption for years 3–5 of the forecast (after an initial ramp period). Years 1–2 should reflect the specific distribution build-up plan of the target business.
Conversion 2: Market share to revenue.
Estimate the target’s current market share in each geography, then apply the market CAGR plus or minus a share gain/loss assumption. Document the share gain assumption explicitly — it is the most scrutinized input in any investment committee review.
Conversion 3: Revenue to gross profit.
Spirits gross margins vary widely by segment. Premium aged rum producers typically operate at 55%–70% gross margins at the producer level VERIFY with target financials. Unaged/value rum producers run closer to 40%–55%. Use the product mix assumption from the category dynamics section to blend these.
Conversion 4: EBITDA margin assumptions.
EBITDA (earnings before interest, taxes, depreciation, and amortization) is the primary valuation metric for spirits businesses. Caribbean rum producers face elevated EBITDA drag from aging inventory costs, island logistics, and export compliance. A 20%–30% EBITDA margin range is a reasonable starting assumption for a mid-size premium Caribbean distillery VERIFY.
Conversion 5: Working capital and capex.
Aged rum production is working-capital-intensive. A distillery aging 50% of production for 8+ years may have 4–6 years of revenue tied up in barrel inventory at any given time. Model this as a working capital build in years 1–3, with normalization in years 4–5 as aged inventory begins to release.
Valuation Implications: Multiples, Comps, and Caribbean Distillery Benchmarking
Valuation multiples for Caribbean rum distilleries are best derived from the broader premium spirits comparable set, since pure-play rum transaction data is sparse. EV/EBITDA (enterprise value divided by EBITDA, the most common acquisition multiple for consumer staples businesses) for premium spirits transactions has historically ranged from 12x to 20x for branded producers, with craft and super-premium assets trading at the high end VERIFY with recent M&A data.
For EV/Revenue multiples, the market growth rate directly informs the appropriate range. A business growing at 3.46% (market rate) warrants a lower multiple than one growing at 8%+. A simple rule of thumb: add 0.5x EV/Revenue for every 100 basis points of growth above the market CAGR.
Comparable transaction framework for Caribbean rum:
| Scenario | Revenue Growth | EV/Revenue Range | EV/EBITDA Range | Rationale |
|---|---|---|---|---|
| Market-rate grower | 3.0%–4.0% | 2.0x–3.0x | 12x–14x | No share gain, stable margins |
| Moderate outperformer | 5.0%–7.0% | 3.0x–4.5x | 14x–17x | Geographic expansion or premiumization |
| High-growth premium | 8.0%+ | 4.5x–7.0x | 17x–22x | Strong brand, Asia-Pacific distribution |
Table 3: Indicative valuation multiple ranges for Caribbean rum producers by growth scenario. All figures are illustrative benchmarks pending verified transaction data.
For a Caribbean distillery generating $15M EBITDA and growing at 6% annually, the base-case enterprise value range is $15M × 14x–17x = $210M–$255M. A 1-turn expansion in the multiple (from 15x to 16x) adds $15M to enterprise value, illustrating why growth rate assumptions are the highest-leverage input in any rum distillery valuation.
Investment Decision Model: Risk-Adjusted Scenarios for 2026–2031
A rigorous investment decision model for Caribbean rum combines the market data, financial model inputs, and valuation multiples into three scenarios with explicit probability weights. This is the framework investment committees expect.
Bear case (25% probability): Global rum CAGR decelerates to 1.5% due to consumer trading-down in a recessionary environment. The target grows at market rate, U.S. market share holds flat at 0.25%, and EBITDA margins compress 300 basis points from logistics cost inflation. Exit multiple contracts to 12x EBITDA. IRR (internal rate of return, the annualized return on an investment) in this scenario: approximately 8%–10%.
Base case (50% probability): Market grows at 3.46% CAGR. The target gains 50 basis points of U.S. market share and begins Asia-Pacific distribution in year 3. EBITDA margins hold steady. Exit at 15x EBITDA. IRR: approximately 15%–18%.
Bull case (25% probability): White spirits tailwind accelerates unaged portfolio to 6%+ growth. Asia-Pacific distribution ramp exceeds plan. Premiumization drives 200-basis-point EBITDA margin expansion. Exit at 18x EBITDA. IRR: approximately 22%–28%.
The probability-weighted IRR across all three scenarios is approximately 15%–16%, which clears a typical private equity hurdle rate of 20% only in the base-to-bull range. This means the investment thesis depends critically on the Asia-Pacific distribution plan and the premiumization margin story, not just market-rate growth.
Frequently Asked Questions
What is the difference between the $17.25B and $37.53B rum market figures, and which should I use in my model?
The $17.25 billion figure from Market Data Forecast reflects a 2024 baseline using producer or wholesale pricing and a narrower geographic scope, while the $37.53 billion figure from Mordor Intelligence reflects a 2026 baseline at consumer prices across a broader product definition that may include rum-adjacent cane spirits. Neither figure is wrong; they measure different things. For investment memos targeting institutional audiences, the Mordor figure is more commonly cited and should be your primary reference. Always document your scope definition in the model’s assumptions tab and run a sensitivity analysis using both figures as bookend inputs. A model that only works under one data provider’s definition is fragile.
How do I convert a 3.46% CAGR into annual revenue growth assumptions for a 5-year DCF?
A CAGR (compound annual growth rate) is the smoothed annual rate that gets you from a start value to an end value over a defined period. For a 5-year DCF, you can use 3.46% as a flat annual growth rate in years 3–5 (the terminal growth period), but years 1–2 should reflect the specific business plan of the target, which may be higher or lower. For example, a Caribbean distillery entering the U.S. market in year 1 might grow U.S. revenue at 20%+ initially, blending down to market rate by year 4. The formula for projecting revenue is: Revenue(n) = Revenue(0) × (1 + g)^n, where g is the annual growth rate and n is the number of years.
Why does rum’s CAGR (3.46%) trail the overall spirits market (3.56%), and does that matter for valuation?
The 10-basis-point gap means rum is projected to lose a small amount of share within the spirits category over 2026–2031. For valuation, this matters because it shifts the burden of proof onto the investment thesis: a rum business growing at exactly 3.46% is not gaining share, and a buyer paying a premium multiple needs to identify a specific catalyst for outperformance. The most credible catalysts are geographic expansion into Asia-Pacific (where rum penetration is low relative to the 45.31% spirits market share held by the region), premiumization of the product portfolio, and white spirits category tailwinds at 4.07% CAGR. Any of these, if executed, can close the gap and justify a higher exit multiple.
What EV/EBITDA multiple is appropriate for a Caribbean rum distillery acquisition?
Based on the broader premium spirits transaction market, EV/EBITDA multiples for branded spirits producers have historically ranged from 12x to 20x, with the specific multiple driven by revenue growth rate, brand strength, geographic diversification, and EBITDA margin profile. A Caribbean distillery growing at market rate (3.46%) with stable margins would likely trade at 12x–14x EBITDA. One with a credible Asia-Pacific distribution story and 6%+ revenue growth could command 16x–18x. Note that actual Caribbean rum transaction data is limited VERIFY, so analysts should triangulate using the broader premium spirits comp set and apply a 1x–2x discount for illiquidity and single-geography concentration risk.
How does the aging cycle of rum affect working capital modeling in a DCF?
Aging is the most distinctive cash flow feature of rum production. A distillery producing 100,000 liters annually and aging 50% of that for 8 years has approximately 400,000 liters of inventory in barrels at any given time, representing 4 years of production volume. At a production cost of, say, $5 per liter, that is $2 million in working capital tied up in aging inventory before a single bottle is sold. In a DCF model, this appears as a working capital outflow in years 1–4 of a new aging program, with cash inflows beginning in year 5 as aged product releases. Analysts should model this separately from operating working capital (receivables, payables) and include it in the free cash flow bridge.
What is the best way to model Caribbean rum export revenue to Asia-Pacific?
Build Asia-Pacific as a standalone revenue stream with its own growth rate, margin profile, and ramp schedule. Start with the total Asia-Pacific spirits market (45.31% of $664.37B = approximately $301B in 2026), apply rum’s estimated 1%–2% penetration rate in the region to get a rough addressable market, then model the target’s share of that addressable market growing from near-zero in year 1 to a defined target by year 5. Use a higher selling cost assumption for Asia-Pacific (distributor margins, import duties, logistics) to reflect the lower net revenue per case versus domestic sales. The Middle East and Africa region, growing at 5.09% CAGR, should be modeled as a separate line with an even longer ramp given distribution complexity.
How should I handle the lack of publicly available Caribbean rum distillery financial data?
Most Caribbean rum producers are privately held, which means audited financials are not publicly available. Analysts should use three proxies: first, publicly traded premium spirits companies (Campari, Rémy Cointreau, Davide Campari-Milano) as margin and multiple benchmarks, applying a private company discount of 20%–30% to multiples; second, any disclosed transaction multiples from spirits M&A deals in the past 5 years as transaction comp anchors; and third, industry-level gross margin data from trade associations such as the Distilled Spirits Council of the United States (DISCUS) for cost structure benchmarking. Build your model with explicit VERIFY flags on all assumed margins and replace them with actual data during due diligence.
Conclusion
The Caribbean rum market offers a well-defined 5-year investment horizon anchored by a $37.53B–$44.49B global market trajectory, a 3.46% CAGR, and specific geographic growth vectors in Asia-Pacific and the Middle East. The modeling work is straightforward once you reconcile the data source discrepancy, select a consistent scope definition, and translate the CAGR into scenario-specific revenue build-ups. The valuation case depends on growth above the market rate, which requires a credible premiumization or geographic expansion story.
Check out a variety of Distillery Financial Model Templates to build your Caribbean rum market entry or acquisition model with pre-built CAGR-to-revenue conversion logic, three-scenario DCF structure, and EV/EBITDA sensitivity tables calibrated to the 2026–2031 forecast period.
























































