
0 ITEMS

Group Payroll Analysis Model
This model produces a useful dashboard for CEOs and CFOs to receive on a monthly basis to keep them reminded of the total group payroll.

| General Excel Financial Models |
| Budget, Budgeting, Tracking |


GROUP PAYROLL ANALYSIS MODEL
- CEOs, COOs and CFOs need to keep a close monitor on monthly payroll.
- This model produces a useful dashboard for CEOs to receive on a monthly basis to keep them reminded of the total group payroll.
- This gives them an insight on how their labour force weighs into the operating costs.
- Most conglomerates and multinationals today control their HR operations in regional centralized offices where a group payroll is generated monthly from one HR department. This allows them to save costs across multiple entities in the group.
- In a labour-intensive organization, knowing how the salaries and allowances are distributed on group companies, departments and amongst employee grade levels is important to see where can there be areas of optimization.
- Keeping track of the highest paid individuals of the group is also a way to remind top management of the allocation of responsibilities to various key personnel in the group.
- It is also important to track the allowances and their types on a monthly basis. This is because sometimes there tends to be a leak in such benefits as a way for employees to create additional income.
- By also tracking costs on departments and locations, management can take informed decisions on relocations to areas of cheaper labour costs or outsourcing functions if needed to replace entire departments.
- Keeping track of the labour cost and number of staff across companies/subsidiaries in the group also allows CEOs to assess the productivity of those entities and compare such labour costs to their revenue contribution to the group.
- The model structure involves setting up certain predefined lists to ensure all employee data pertains to such lists. This includes:
- Entities
- Departments
- Locations
- Banks
- Grades
- The group payroll sheet is then inserted in the columns of the MONTH PAYROLL SHEET. The basic information of each employee receiving a payroll in that month will feed into the analysis.
- A break-down of pay is then plugged into the basic salary, allowances, and deductions columns to reach the TOTAL NET PAY for the month.
- The ANALYSIS SHEET is then used to query, extract and transpose data for use in charts.
- The DASHBOARD is the sheet that summarizes the payroll status for the month which could be copied into a monthly presentation for top management.
- Payroll is analyzed by different parameters like entity, department, location etc.
- Sorting is done to highlight larger weights in payroll.
- A list of employees is also generated and sorted by their total net pay to extract highest paid employees.
File Types: .xlsx and .pdf
Similar ProductsOther customers were also interested in...



 Anuj
Private Equity Fund Model (Investor Cashflows)
The Private Equity Fund Cashflows Model helps LPs and GPs analyze fund cash flows, returns, and dist... Read more
 Giorgos
Advanced Financial Model with DCF and Valuation
Dynamic 10-Year Financial Model, suitable for any type of business, supporting strategic planning, i... Read more
 Pierre-AlexandreHeur...
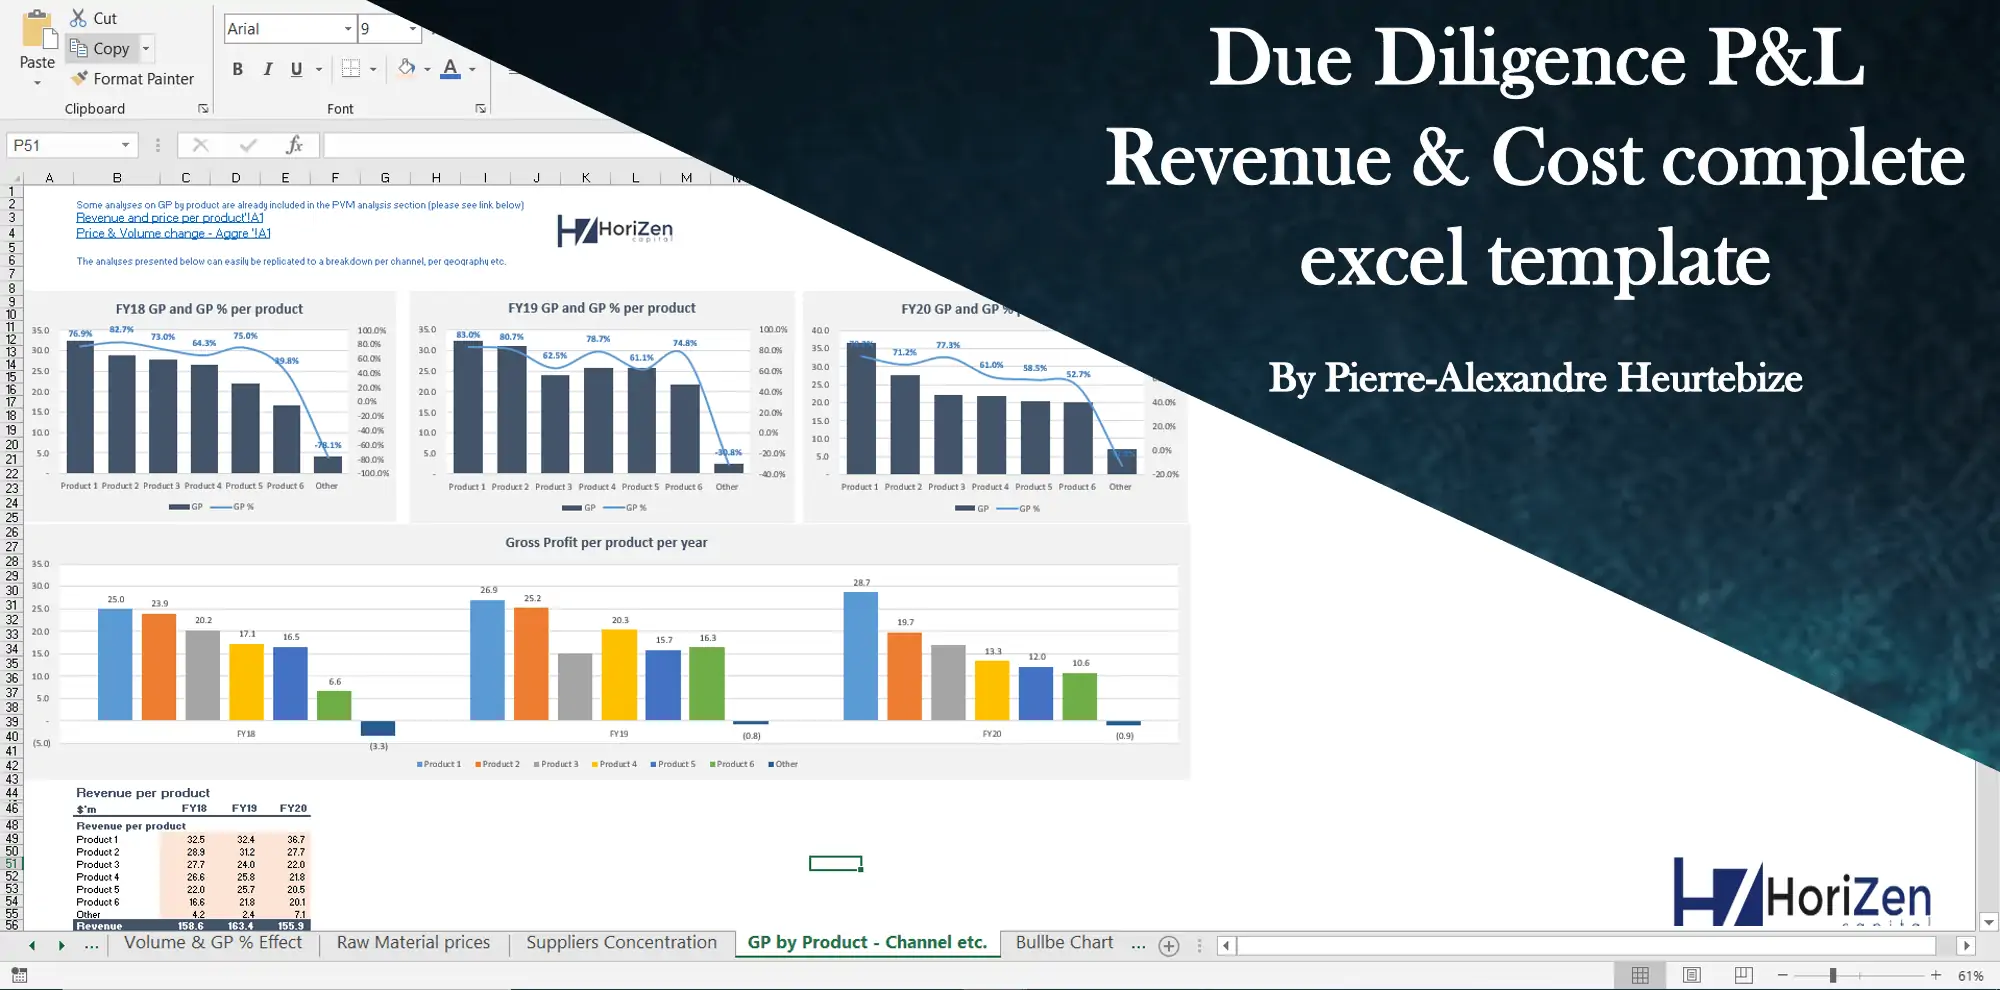
Due Diligence P&L – Exhaustive Revenue a...
Model for in depth understanding of high level profit and loss and revenue analysis. Big-4 like chec... Read more

Startup Company Financial Model – 5 Year Fin...
Highly-sophisticated and user-friendly financial model for Startup Companies providing a 5-Year adva... Read more
 HenrySheykin
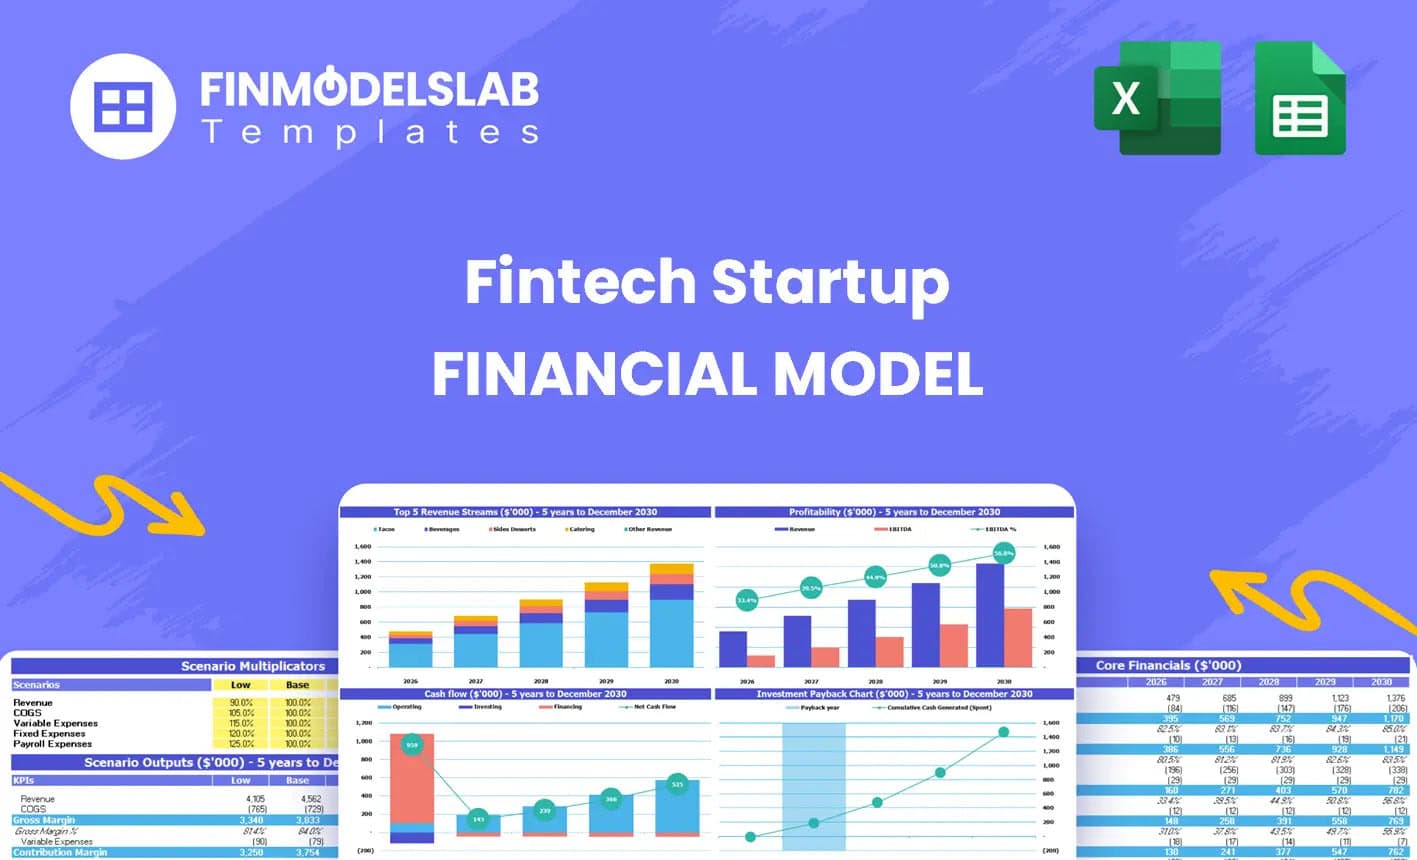
Fintech Financial Model Excel Template
The Fintech Startup Financial Model helps founders, analysts, consultants, and business planners tur... Read more
 David
Multi-Entity Group Generic Monthly 5-Year 3 Statem...
User-friendly 3 statement 5 year rolling financial projection Excel model for a Multi-entity Group (... Read more
Budgeting & Forecasting Model Template
Budgeting & Forecasting Template suitable for either a Trade or Service company in any type of i... Read more

 eFinancialModels
Waterfall Profit Distribution Model (up to 4 Tiers...
We are introducing our 4-Tier Waterfall Profit Distribution Model. The waterfall profit distribution... Read more
You must log in to submit a review.