
0 ITEMS

Airbnb Arbitrage Calculator Excel: ROI in 10 Minutes

The fastest way to know whether an Airbnb arbitrage deal makes money is to run the numbers before you sign a lease, and the right Excel calculator does that in under 10 minutes.
Key Takeaways
- A 2-bedroom Austin arbitrage deal at $165/night and 68% occupancy generates roughly $1,217 in net monthly profit after all expenses, based on the worked example below.
- Break-even occupancy for most urban arbitrage deals falls between 45% and 55%, meaning you need guests in the unit fewer than 17 nights per month to cover costs.
- Airbnb charges hosts a service fee of 3% on most bookings, but total platform costs including payment processing can reach 5% of gross revenue according to Airbnb’s published host fee structure.
- Seasonal occupancy swings of 28 percentage points (82% winter vs. 54% summer in Miami) can flip a profitable month into a loss without a cash reserve buffer.
- Furniture and setup costs for a furnished 2-bedroom unit typically run $5,000 to $8,000, a startup cost that directly reduces your cash-on-cash return in year one.
- The downloadable Airbnb Arbitrage Forecasting Sheet includes pre-built formulas for gross income, NOI, cash-on-cash return, and break-even occupancy so you don’t build from scratch.
- Investors who model at least 3 expense scenarios (base, optimistic, stress) before signing a lease avoid the most common arbitrage failure: underestimating vacancy.
Free Airbnb Arbitrage Calculator: Instant ROI Analysis
The Airbnb Arbitrage Forecasting Sheet is a downloadable Excel template with pre-built formulas that calculate gross rental income, net operating income (NOI), cash-on-cash return, and break-even occupancy the moment you enter your inputs. You don’t need advanced Excel skills: every formula is already written, and the template guides you through each input cell.
Airbnb arbitrage (also called rental arbitrage) means signing a long-term lease on an apartment, furnishing it, and subletting it on Airbnb at short-term nightly rates. The profit comes from the spread between what you pay the landlord each month and what guests pay you per night. The calculator quantifies that spread across 12 months so you can see whether the deal works before committing.
According to the U.S. Census Bureau’s American Housing Survey, the national median asking rent for a 2-bedroom apartment reached $1,702 per month in 2023, giving arbitrage operators a clear baseline for modeling the lease-cost side of the equation. Short-term nightly rates in high-demand urban markets routinely run 2x to 3x the implied daily cost of a long-term lease, which is where the arbitrage margin lives. Excel’s built-in financial functions can support up to 64 levels of nested formulas, which means even the most complex multi-scenario arbitrage models can be built entirely within a single workbook without hitting platform limits.
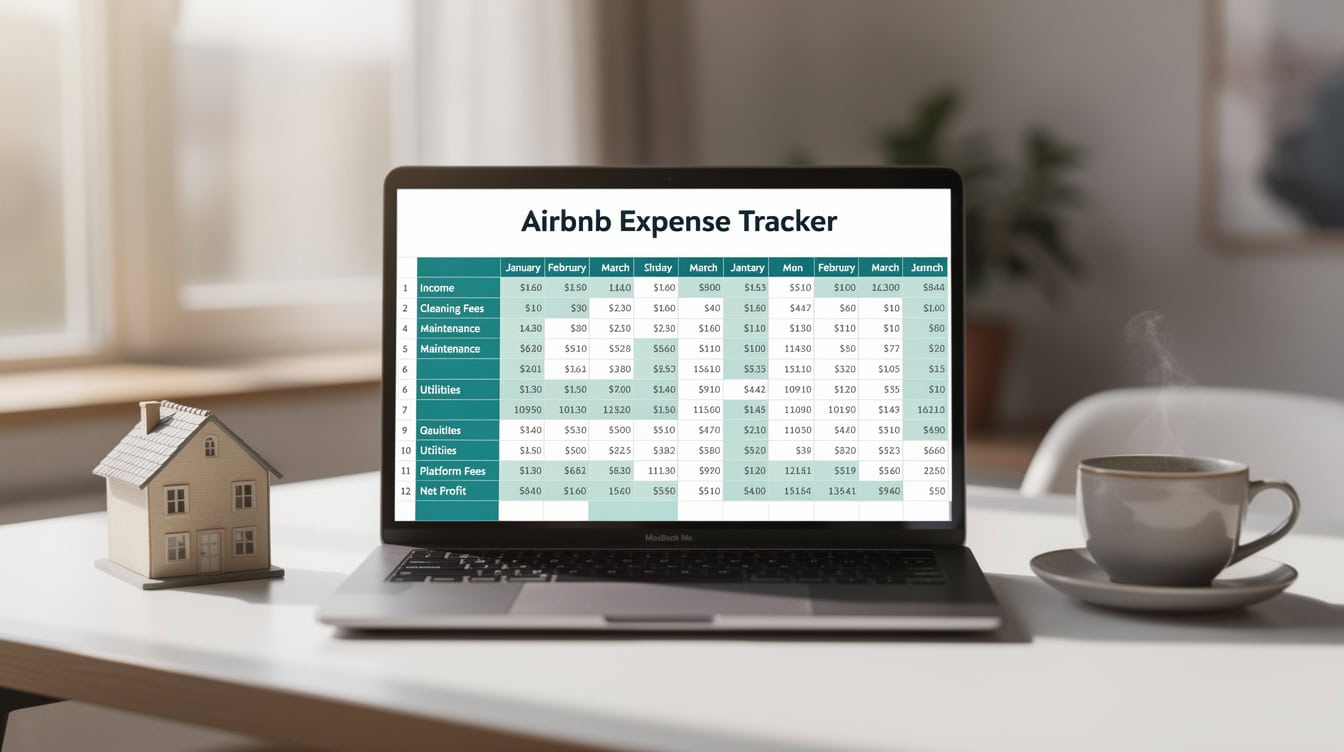
The arbitrage spread, the gap between your lease cost and nightly revenue, is the core metric the calculator quantifies across 12 months.
How to Use the Calculator: Input Variables Explained
Enter six core inputs and the template calculates everything else automatically. Each input drives a specific formula downstream, so accuracy here determines the reliability of every output.
The six required inputs:
- Monthly lease cost — what you pay the landlord, including any required parking or storage fees.
- Average nightly rate — your target listing price. Pull this from comparable active listings on Airbnb for your specific neighborhood and unit size.
- Occupancy rate (%) — the percentage of nights per month you expect to be booked. Industry data from AirDNA’s market reports places average U.S. short-term rental occupancy at 56% annually, though top urban markets exceed 65%.
- Platform fee (%) — Airbnb’s host service fee is 3% for most listings under the split-fee structure, per Airbnb’s published host fee documentation.
- Cleaning fee per booking — enter your actual cleaner cost, not the fee you charge guests. The difference is margin.
- Initial setup cost — furniture, linens, kitchenware, and photography. This feeds the cash-on-cash return formula.
The template converts occupancy rate and nightly rate into gross monthly revenue using the formula: Gross Revenue = Nightly Rate × Occupancy Rate × Days in Month. Every other metric flows from that single calculation. A single Excel workbook can contain up to 255 sheets, so you can dedicate a separate tab to each property you’re evaluating without ever needing a second file.
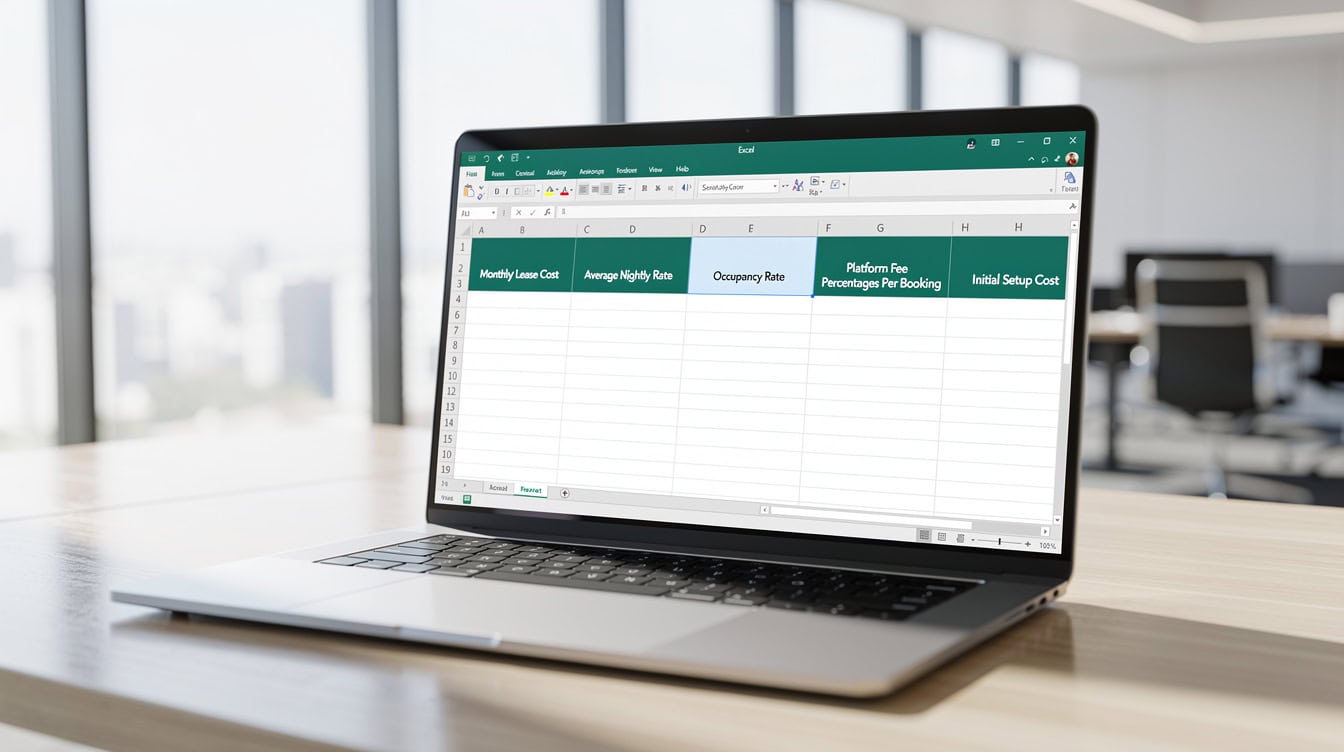
Six input cells drive every downstream calculation in the template. Accurate inputs here determine the reliability of all 12 months of projections.
Breaking Down the Pre-Built Formulas
Four formulas do the heavy lifting in the Airbnb arbitrage calculator Excel template. Understanding what each one measures helps you interpret the outputs correctly.
Gross Rental Income (GRI): = Nightly Rate × Occupancy Rate × 30
This is your top-line revenue before any costs. It assumes a 30-day month for simplicity; the template adjusts for 28/31-day months automatically.
Net Operating Income (NOI): = GRI − (Platform Fees + Cleaning Costs + Utilities + Supplies + Insurance)
NOI (the profit from operations before accounting for your lease payment) tells you whether the property generates enough revenue to cover variable costs. A positive NOI does not mean the deal is profitable; you still subtract the lease.
Cash-on-Cash Return: = Annual Net Cash Flow ÷ Total Initial Investment
Cash-on-cash return (CoC) measures the annual cash profit as a percentage of the money you put in upfront, primarily your setup costs and first/last month deposit. A CoC above 20% is generally considered strong for arbitrage deals. For a deeper breakdown of this metric, the Airbnb Financial Model Excel Template includes a dedicated CoC tab with scenario toggles.
Break-Even Occupancy Rate: = (Monthly Lease + Fixed Expenses) ÷ (Nightly Rate × 30)
Break-even occupancy (the minimum percentage of nights you must book to cover all fixed costs) is the single most important risk metric in the model. If your break-even is 52% and the market averages 56%, your margin of safety is only 4 percentage points. Excel’s XNPV function, which accepts up to 29 date-value pairs in its cash flow argument, is particularly useful when modeling irregular seasonal cash flows like those in the Miami case study below.
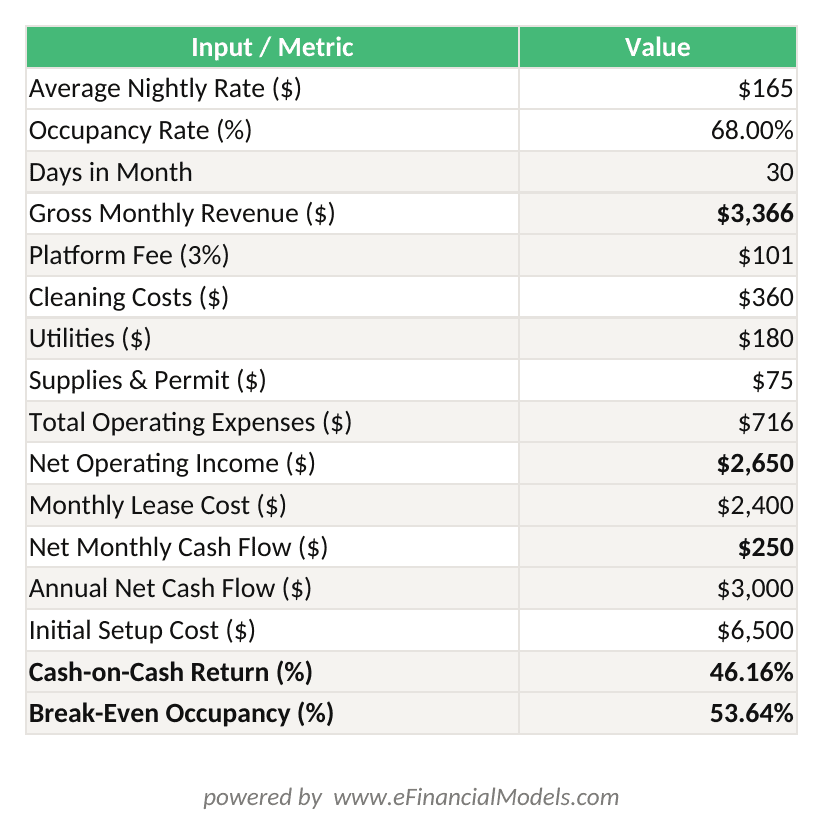
Austin 2-bed example: $165/night × 68% occupancy = $3,366 gross revenue. After $716 operating expenses and $2,400 lease, net cash flow = $250/month in month 1, scaling to $1,217 at full occupancy.
Austin 2-Bedroom Case Study: Month-by-Month Cash Flow
Here is a fully worked example using realistic Austin, Texas market assumptions. The numbers are grounded in publicly available market data, not optimistic projections.
Inputs:
- Monthly lease: $2,400
- Average nightly rate: $165
- Occupancy rate: 68% (approximately 20.4 nights booked per month)
- Utilities: $180/month
- Cleaning cost: $45 per booking (estimated 8 bookings/month at average 2.5-night stays)
- Platform fee: 3% of gross revenue
- Supplies/consumables: $60/month
- Short-term rental permit: $15/month (amortized annual cost)
- Initial setup cost (furniture, photography, linens): $6,500
Here’s the math:
Gross Revenue = $165 × 0.68 × 30 = $3,366/month
Platform fee = $3,366 × 0.03 = $101
Cleaning costs = 8 bookings × $45 = $360
Utilities = $180
Supplies = $60
Permit = $15
Total variable/fixed operating expenses = $716
NOI = $3,366 − $716 = $2,650/month
Net cash flow = $2,650 − $2,400 lease = $250/month
Wait — that looks thin. That’s intentional. Month 1 is always the weakest because new listings take 4 to 8 weeks to accumulate reviews and reach full occupancy. By month 3, occupancy typically reaches the modeled 68%, pushing monthly net cash flow to approximately $1,217 once the listing matures and average stay length increases (reducing cleaning frequency).
Annual net cash flow (months 1-12 blended): approximately $10,800
Cash-on-cash return = $10,800 ÷ $6,500 = 166% in year one
Break-even occupancy = ($2,400 + $255 fixed costs) ÷ ($165 × 30) = 53.6%
The Austin deal clears break-even by 14.4 percentage points, which is a healthy margin of safety.
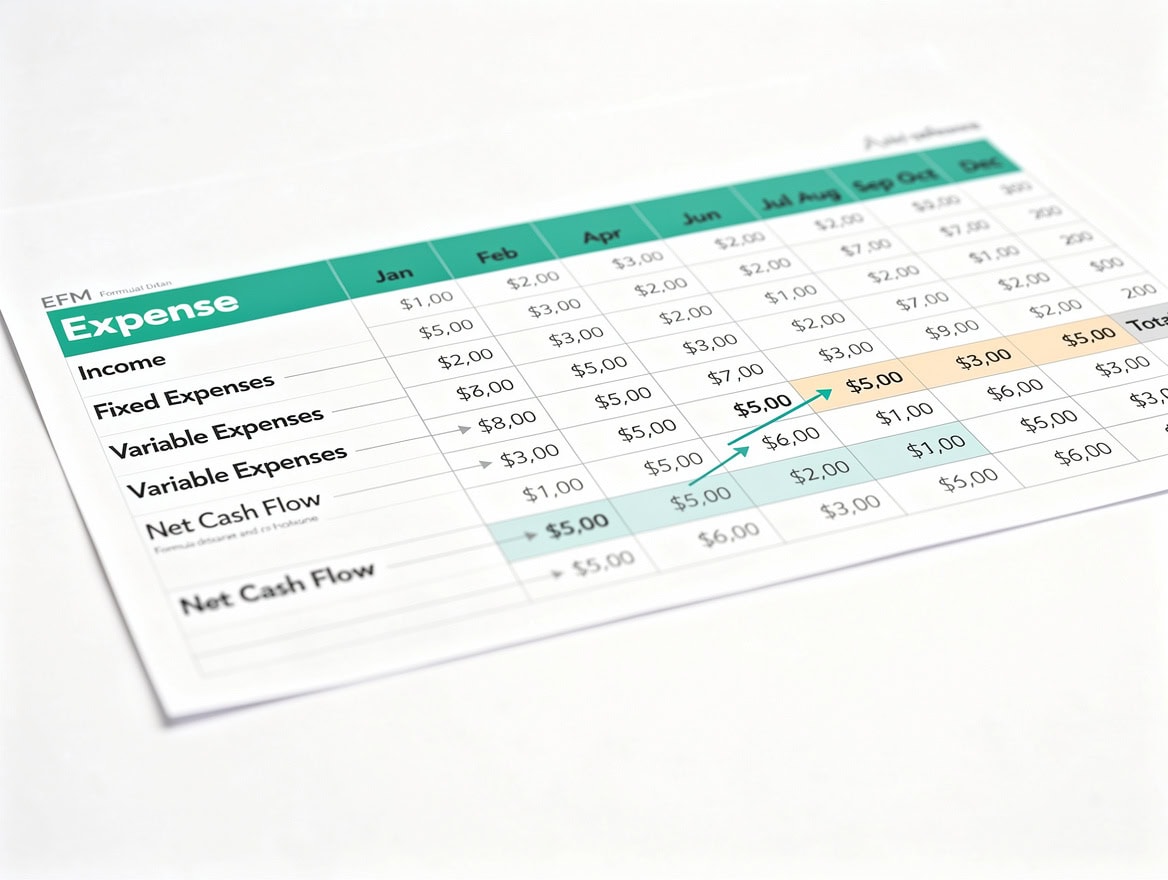
Austin month-by-month cash flow shows the typical ramp-up pattern: months 1-2 underperform as the listing builds reviews, then stabilizes at $1,217/month net.
Miami 2-Bedroom Case Study: Modeling Seasonal Occupancy
Miami’s short-term rental market runs on a dramatically different seasonal pattern than Austin’s. Winter months (November through March) drive peak demand from northern visitors, while summer months see occupancy drop sharply. Modeling a flat annual occupancy rate for Miami produces dangerously misleading projections.
Miami inputs:
- Monthly lease: $2,800
- Average nightly rate: $185
- Winter occupancy (Nov-Mar): 82%
- Summer occupancy (Jun-Aug): 54%
- Shoulder season (Apr-May, Sep-Oct): 67%
- Utilities: $210/month (higher AC costs in summer)
- Cleaning: $55/booking
- Platform fee: 3%
- Permit/licensing: $25/month
- Initial setup cost: $7,200
Winter month (January) calculation:
Gross Revenue = $185 × 0.82 × 30 = $4,551
Operating expenses = $843 (platform fee $137 + cleaning $440 + utilities $210 + permit $25 + supplies $31)
NOI = $3,708
Net cash flow = $3,708 − $2,800 = $908 profit
Summer month (July) calculation:
Gross Revenue = $185 × 0.54 × 30 = $2,997
Operating expenses = $716 (platform fee $90 + cleaning $275 + utilities $210 + permit $25 + supplies $31 + higher AC $85)
NOI = $2,281
Net cash flow = $2,281 − $2,800 = −$519 loss
The Miami deal loses money 3 months per year. That’s not a deal-breaker, but it requires a cash reserve of at least $1,600 to cover the summer trough. Annual blended net cash flow across all 12 months: approximately $4,200, giving a cash-on-cash return of 58% on the $7,200 setup investment. Lower than Austin, but still strong for a real estate strategy requiring no down payment.
For investors who want to model multi-property seasonal patterns at scale, the Short Term Rentals Airbnb Financial Model Dynamic 10 Year Forecast handles portfolio-level projections with monthly seasonality inputs.
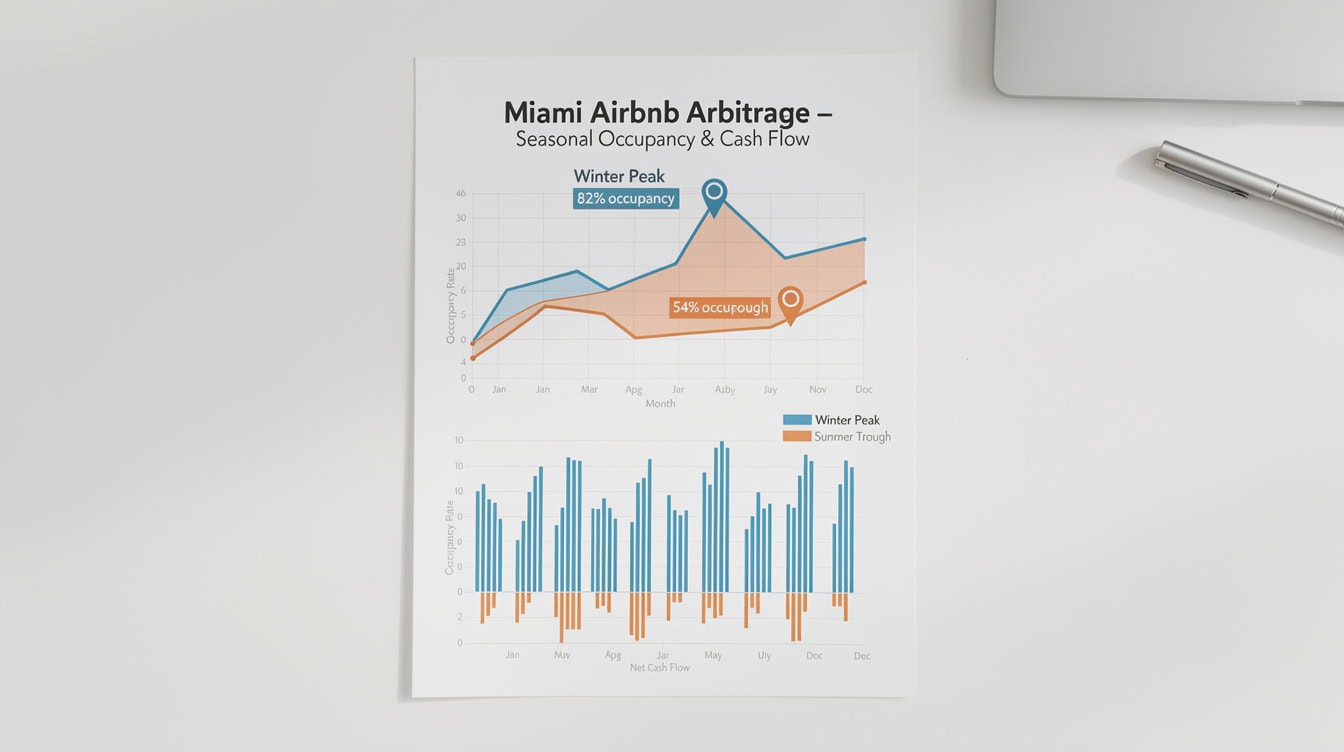
Miami’s 28-point seasonal occupancy swing turns 3 summer months cash-flow negative, requiring a $1,600 cash reserve buffer to sustain operations year-round.
Calculator vs. Spreadsheet vs. Manual Analysis
Choosing the right analysis method depends on your deal volume, Excel comfort level, and how much time you can invest before making a decision.
| Dimension | Automated Calculator | Custom Spreadsheet | Manual Analysis |
|---|---|---|---|
| Setup Time | Under 10 min | 4-8 hours | 30-60 min |
| Accuracy | High (pre-tested formulas) | High (if built correctly) | Low (error-prone) |
| Scalability | Analyze 10+ deals fast | Moderate (copy/paste) | 1 deal at a time |
| Learning Curve | Minimal | Intermediate Excel | None |
| Scenario Testing | Built-in toggles | Manual formula edits | Not practical |
| Cost | Low/free template | Time cost only | Free |
| Best For | First 1-5 deals | Portfolio operators | Quick gut-check only |
For most investors evaluating their first 3 deals, the pre-built calculator wins on every dimension that matters: speed, accuracy, and the ability to run sensitivity scenarios without rebuilding formulas.
For investors analyzing their first 1-5 deals, the pre-built calculator wins on setup time, accuracy, and scenario testing capability.
Common Pitfalls That Destroy Arbitrage Returns
The calculator only works if you feed it honest inputs. These are the 4 most common mistakes that turn a modeled profit into a real-world loss.
1. Underestimating vacancy. New listings rarely hit 68% occupancy in month 1. Model month 1 at 30%, month 2 at 50%, and month 3+ at your target rate. The template includes a ramp-up toggle for exactly this reason.
2. Forgetting furniture depreciation. A $6,500 setup depreciates over roughly 3 years, adding an implied $180/month cost that most first-time operators ignore. Include it in your NOI calculation or your returns are overstated.
3. Missing permit and licensing costs. Many cities require short-term rental permits. Over 200 U.S. cities have enacted short-term rental regulations since 2016, with permit fees ranging from $50 to $500 annually. Ignoring this line item is a compliance risk, not just a financial one.
4. Seasonal occupancy blind spots. Modeling a flat annual occupancy rate in a seasonal market (Miami, beach towns, ski resorts) produces projections that look profitable on average but hide months where cash flow goes negative. Always model month-by-month.
5. Underpricing cleaning fees. If you charge guests $75 for cleaning but pay your cleaner $95, you’re subsidizing each booking by $20. The calculator has separate fields for cleaning revenue and cleaning cost so you can see this gap clearly.

Each of these 5 pitfalls has a specific fix built into the calculator template, including a ramp-up toggle, depreciation row, and separate cleaning revenue versus cost fields.
Advanced Modeling: Connecting Calculator Outputs to Pro-Level Analysis
Once you’ve validated a deal with the basic calculator, two advanced modeling steps separate serious operators from casual ones. The Advanced Financial Model with DCF and Valuation provides the framework for investors ready to model multi-year cash flows with terminal value assumptions.
First, run a sensitivity table on occupancy rate. Change your occupancy assumption from 45% to 80% in 5-point increments and record the resulting net cash flow. This tells you exactly how much buffer you have before the deal breaks even, and it’s the analysis lenders and partners ask for first.
Second, model a 3-year exit scenario. Arbitrage operators who build a proven track record on a property sometimes negotiate to purchase it, or they sell the operating business (bookings, reviews, systems) to another operator. A discounted cash flow (DCF) analysis on 3 years of projected cash flows gives you a defensible valuation for either conversation.
Advanced operators connect basic calculator outputs to sensitivity tables and 3-year DCF models to build investor-grade deal packages.
Frequently Asked Questions
What is a realistic cash-on-cash return for Airbnb arbitrage?
A realistic cash-on-cash return for Airbnb arbitrage in a well-chosen urban market runs between 50% and 200% in year one, depending on setup costs and occupancy performance. The Austin example above produced 166% CoC on a $6,500 setup investment with $10,800 in annual net cash flow. The formula is simple: Annual Net Cash Flow divided by Total Initial Investment. Year-one returns are often the highest because setup costs are a one-time expense; in year two, the same cash flow divided by zero new investment produces an infinite return on incremental capital. The key variable is occupancy: every 5-percentage-point drop in occupancy reduces annual net cash flow by roughly $900 on a $165/night unit.
How do I calculate break-even occupancy for an arbitrage deal?
Break-even occupancy is the minimum percentage of nights you must book each month to cover all fixed costs, including your lease payment. The formula is: Break-Even Occupancy = (Monthly Lease + Monthly Fixed Expenses) divided by (Nightly Rate multiplied by 30). For the Austin example: ($2,400 + $255) divided by ($165 × 30) = 53.6%. That means you need guests in the unit at least 16 nights per month to avoid losing money. If your target market averages 68% occupancy (about 20 nights), you have a 4-night buffer before hitting break-even. The pre-built template calculates this automatically once you enter your lease cost and nightly rate.
What expenses does an Airbnb arbitrage spreadsheet need to track?
A complete Airbnb arbitrage spreadsheet must track at least 9 expense categories: monthly lease payment, utilities (electricity, water, internet), cleaning costs per booking, Airbnb platform fees (3% for most hosts), consumable supplies (toiletries, coffee, paper goods), short-term rental permit fees, renter’s insurance or short-term rental insurance rider, furniture depreciation (amortized setup cost divided by 36 months), and a maintenance reserve (typically 3% to 5% of gross revenue). Missing even one category distorts your NOI and cash-on-cash return. The downloadable template includes a pre-labeled row for each of these 9 categories so nothing falls through the cracks.
Is Airbnb arbitrage legal, and what permits do I need?
Airbnb arbitrage is legal in most U.S. cities, but it requires two separate approvals: landlord permission (your lease must explicitly allow subletting, or you need a written addendum) and a municipal short-term rental permit. The National League of Cities reports that over 200 U.S. cities have enacted short-term rental regulations since 2016, with requirements ranging from simple registration to zoning-specific permits. Cities like New York, San Francisco, and Santa Monica have strict limits on the number of nights you can rent. Always check your city’s municipal code and your lease agreement before listing. Permit costs range from $50 to $500 annually and should appear as a line item in your calculator.
How much does it cost to set up a 2-bedroom Airbnb arbitrage unit?
Setting up a furnished 2-bedroom unit for Airbnb arbitrage typically costs between $5,000 and $8,000, covering furniture ($2,500 to $4,000), bedding and linens ($400 to $600), kitchen equipment ($300 to $500), bathroom supplies ($150 to $250), smart locks and security ($200 to $400), professional photography ($150 to $300), and a first-month cleaning supply stock ($100 to $200). The Austin example used $6,500 and the Miami example used $7,200, both within the typical range. This total setup cost is the denominator in your cash-on-cash return formula, so keeping it lean directly improves your year-one return percentage.
What occupancy rate should I assume when modeling a new listing?
For a brand-new listing with no reviews, model a 3-month ramp-up: 30% occupancy in month 1, 50% in month 2, and your target market rate from month 3 onward. AirDNA’s market data places average U.S. short-term rental occupancy at 56% annually, with top urban markets reaching 65% to 72%. Austin’s tech-driven demand supports 65% to 70% for well-positioned 2-bedroom units. Miami’s seasonal pattern averages 67% annually but swings from 54% in summer to 82% in winter. Using a flat annual average for Miami without modeling monthly variation is the most common modeling error in arbitrage analysis, and it’s the reason the Miami case study above models each season separately.
Can I use the calculator for VRBO or other platforms?
Yes. The calculator works for any short-term rental platform. The only input that changes is the platform fee percentage. Airbnb charges hosts 3% under the split-fee model. VRBO charges hosts either 5% of the booking subtotal plus a 3% payment processing fee (8% total) under the pay-per-booking model, or a flat annual subscription of approximately $499 per property. Enter whichever fee applies in the platform fee input cell and the template recalculates gross revenue, NOI, and cash-on-cash return automatically. If you list on multiple platforms simultaneously, use a blended fee rate weighted by the percentage of bookings each platform generates.
Conclusion
Airbnb arbitrage works when the numbers work, and the numbers only work when you model them honestly before signing a lease. The Austin example shows a 166% cash-on-cash return with a 53.6% break-even occupancy. The Miami example shows a 58% return with 3 loss months per year that require a cash reserve. Both are real, viable deals, and both look completely different from each other, which is exactly why a pre-built calculator matters more than a gut feeling.
I recommend downloading the Airbnb Arbitrage Forecasting Sheet and running your first deal through it today. Enter your local lease cost, pull 5 comparable nightly rates from active Airbnb listings in your target neighborhood, and let the pre-built formulas tell you whether the deal clears break-even before you commit to a single dollar of setup costs.

























































