
0 ITEMS

Art Gallery Business Plan Financial Model Excel Template
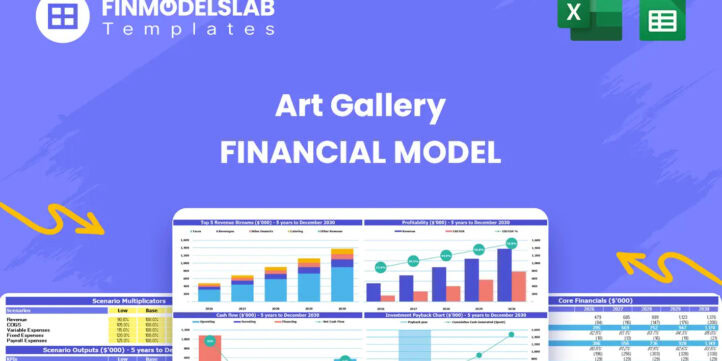
The Art Gallery Financial Model Financial Model Template helps turn an art gallery concept into a structured financial forecast that can be used for planning, funding, budgeting, and internal decision-making. Instead of building a spreadsheet from scratch, users can work from a ready-to-use model designed around the economics of a gallery business, including visitor traffic, ticket sales, exhibitions, workshops, ancillary revenue, operating expenses, payroll, cash flow, profitability, and long-term growth. It gives entrepreneurs and planners a practical way to understand how the numbers work before committing capital, signing a lease, hiring staff, or approaching investors. This template is built for art gallery founders, gallery owners, consultants, analysts, business plan writers, and teams preparing investor presentations or lender documents. It helps users define revenue assumptions, estimate startup costs, organize ongoing expenses, forecast staffing needs, and review projected financial performance over time. Whether the gallery will rely on general admission, special exhibitions, workshops, gift shop sales, cafe income, event rentals, or a mix of income streams, the model helps connect those commercial assumptions to a complete financial plan. The model is especially useful for evaluating whether an art gallery can reach sustainable profitability under realistic assumptions. Users can review projected profit and loss, cash flow, funding requirements, return metrics, and break-even analysis while testing how changes in attendance, pricing, staffing, rent, marketing, and revenue mix affect results. This makes it easier to compare different strategies, prepare for seasonal cash pressure, and identify the operating conditions needed to support growth. Because the Art Gallery Financial Model is editable and compatible with Excel and Google Sheets, it can be customized for a new gallery launch, an expansion plan, a gallery renovation, or a funding proposal. The template helps users replace guesswork with structured financial planning, making it easier to present assumptions clearly, answer stakeholder questions confidently, and make better decisions about investment, operations, and profitability.


![Excel dashboard titled 'Scenario Analysis' for ABC Company Inc., featuring two 5-year forecast charts (Revenue and EBITDA) with Low/Base/High scenarios from 2026–2030.]" ,"Informational planning dashboard showing financial projections with multiple line charts (Revenue and EBITDA) and scenario ranges for 2026–2030." ,"Communicates five-year financial projections (revenue, margins, EBITDA) under Low/Base/High scenarios for strategic planning.](https://www.efinancialmodels.com/wp-content/uploads/edd/2026/05/art-gallery-financial-model-scenarios-financialmodelslab_df0636f7-e66c-4c3c-b879-48692ee9975f-scaled.jpg "art-gallery-financial-model-scenarios-financialmodelslab_df0636f7-e66c-4c3c-b879-48692ee9975f | eFinancialModels")


Financial Model Overview
The Art Gallery Financial Model Financial Model Template is a structured planning tool designed to help entrepreneurs, gallery owners, consultants, analysts, and business plan writers evaluate the financial potential of an art gallery before launch, expansion, or funding discussions. An art gallery business has several moving parts, including admission revenue, exhibition programming, artist events, workshops, cafe and retail sales, event rentals, staffing, rent, utilities, marketing, insurance, installation costs, and working capital needs. This template brings those assumptions into one editable model so users can forecast revenue, costs, cash flow, profitability, funding requirements, and investor-facing outputs over a multi-year period. It is useful because it converts a creative gallery concept into a practical financial plan, helping users understand what level of visitor traffic, pricing, cost control, and startup investment may be required to build a sustainable business. Instead of presenting rough estimates or disconnected spreadsheets, users can work with a professional model that links inputs to outputs and supports clearer budgeting, funding preparation, and decision-making.
All-in-One Dashboard
The all-in-one dashboard gives users a central view of the most important inputs and outputs in the Art Gallery Financial Model. This section is designed to summarize the financial story of the gallery without requiring users to search through every worksheet or calculation tab. It may include key assumptions such as visitor volume, ticket pricing, workshop participation, revenue growth, operating margins, startup investment, funding sources, and expense levels, while also displaying outputs such as total revenue, gross profit, EBITDA, net income, cash balance, payback timing, and investor return indicators. For an art gallery, this is especially useful because management must often balance creative programming with financial discipline. A gallery may look promising from a branding or cultural perspective, but the dashboard helps show whether the business can support its rent, staffing, exhibition schedule, marketing budget, and ancillary operations. For founders and consultants preparing business plans, the dashboard acts as a quick executive summary. For investors, lenders, and advisors, it provides a clean way to understand the model’s assumptions and outcomes. Because the fields are editable, users can update core drivers and immediately see how the gallery’s financial outlook changes, making the dashboard a practical tool for both planning and presentation.
Low, Base, and High Scenario Analysis
The Low, Base, and High scenario analysis component helps users test how different operating conditions may affect the gallery’s performance. Rather than relying on a single forecast, the model allows users to compare conservative, expected, and optimistic cases for the business. Inputs may include visitor attendance, general admission ticket sales, special exhibition turnout, workshop participation, cafe and gift shop spending, event rental demand, revenue growth rates, rent increases, payroll costs, marketing spend, and other operating assumptions. The outputs help show how each scenario affects revenue, expenses, cash flow, profitability, funding needs, and overall business viability. This is important for an art gallery because results can vary significantly depending on the strength of exhibitions, seasonality, tourism patterns, local awareness, school and corporate partnerships, private events, and economic conditions. A low case may show the cash reserve required if attendance is weaker than expected, while a high case may show the upside of a successful exhibition calendar or strong private event strategy. This component is valuable for decision-making because it prepares users to answer what-if questions from investors, lenders, partners, and internal stakeholders. It also helps founders avoid overconfidence by showing how sensitive the business can be to traffic, pricing, and fixed costs.
Professional Charts
The professional charts component transforms the financial forecast into clear visual outputs that are easier to interpret and present. Financial models can contain many rows of assumptions, calculations, and statement outputs, but charts help users quickly communicate trends in revenue, profitability, cash flow, margins, visitor growth, cost structure, and return metrics. For an art gallery, this may include graphs showing the growth of general admission revenue, special exhibition income, workshop fees, gift shop and cafe contribution, event rental revenue, EBITDA development, cumulative cash flow, or the relationship between startup investment and payback. These visuals are useful for pitch decks, lender meetings, board updates, internal planning sessions, and business plan documents. They help stakeholders see whether the gallery is moving from an early operating loss toward sustainable profitability, whether cash reserves remain adequate, and which revenue streams are driving the most growth. The chart section may use inputs from the revenue model, expense budget, cash flow forecast, and scenario analysis to generate presentation-ready graphics automatically. This saves time compared with building charts manually and reduces the risk of using outdated figures in stakeholder materials. For users who are not finance specialists, the charts make the model more accessible by turning complex calculations into visual insights that support faster and more confident decisions.
ROE Components and DuPont Analysis
The ROE components and DuPont analysis section helps users understand the drivers behind return on equity rather than looking only at a single return percentage. Return on equity can be influenced by profitability, asset efficiency, and financial leverage, and the DuPont approach separates these factors so users can see what is helping or hurting investor returns. In the Art Gallery Financial Model, this component may use net profit margin, asset turnover, equity levels, debt assumptions, total assets, and net income to analyze how effectively the gallery converts invested capital into returns. This is useful for an art gallery because the business may require significant upfront spending on renovation, lighting, security, installation, cafe equipment, leasehold improvements, and working capital. Even if revenue grows, the return to owners depends on how efficiently those investments are used and how well operating margins are managed. This section helps users evaluate whether the gallery’s return profile is driven by strong margins, improved utilization of assets, or leverage. It can also highlight where improvements are needed, such as increasing high-margin workshops, improving retail turnover, controlling staffing costs, or generating more revenue from existing space through private events. For investor discussions, DuPont analysis adds depth and credibility because it explains not just what the return is, but why it occurs and how management can improve it.
Revenue Inputs
The revenue inputs section is where users define the commercial assumptions that drive the gallery’s income forecast. For an art gallery, revenue is rarely based on one source alone. The model may include general admission tickets, special exhibition tickets, art workshop fees, cafe sales, gift shop sales, event rentals, memberships, sponsorships, and other ancillary revenue streams. Inputs may include ticket prices, visitor counts, attendance growth, workshop capacity, participation rates, average spend per visitor, rental pricing, event frequency, retail conversion rates, and seasonal patterns. This section is useful because revenue assumptions are often the most scrutinized part of a business plan. Investors and lenders want to know how the gallery expects to attract visitors, how pricing compares with market expectations, and whether additional income sources can support profitability. By organizing the inputs clearly, the template helps users build a forecast that is both flexible and explainable. Users can adjust assumptions for a small local gallery, a destination gallery, a gallery with strong educational programming, or a venue that relies heavily on private events. The outputs generated from this section feed into revenue projections, profitability analysis, cash flow forecasting, and scenario planning. This makes the revenue inputs section one of the most important parts of the model, because it connects the gallery’s strategy directly to financial performance.
Bank-Ready Reports
The bank-ready reports component organizes the financial model into outputs that are suitable for lenders, investors, advisors, and other stakeholders who need a clear view of the gallery’s financial position. These reports may include a profit and loss statement, cash flow forecast, balance sheet, debt schedule, funding requirement summary, key assumptions, repayment capacity, and important ratios. For an art gallery seeking financing, this is critical because banks and lenders typically want to see whether the business can generate enough cash to cover operating costs and debt obligations. A lender may also review startup costs, working capital needs, loan proceeds, cash reserves, profitability timing, and downside scenarios. This section helps present that information in a structured, professional format rather than scattered calculations. Inputs may come from revenue assumptions, expense budgets, payroll plans, capital expenditures, financing assumptions, and tax estimates. Outputs help show whether the gallery has adequate liquidity, how quickly it can move toward positive cash flow, and whether projected earnings can support repayment. The bank-ready reports are also useful for grant applications, landlord discussions, board reviews, and investor presentations because they create a consistent financial narrative. For users preparing funding documents, this component saves time and helps ensure that the financial plan looks organized, credible, and decision-ready.
Revenue Breakdown
The revenue breakdown component provides a detailed view of how each income stream contributes to total gallery revenue. Instead of showing only one top-line sales number, this section separates revenue by source so users can understand which activities are most important to the business model. For an art gallery, this may include general admission, special exhibitions, workshops, cafe income, gift shop sales, event rentals, memberships, sponsorships, commissioned art sales, and educational programming. Inputs may include attendance by category, price per ticket, workshop fees, number of events, average retail spend, cafe conversion rates, rental rates, and growth assumptions. The outputs help show total revenue by stream, percentage contribution, year-over-year growth, and the effect of each revenue line on profitability. This is valuable because different revenue streams have different margins, risks, and operational requirements. A workshop program may require instructors and materials but produce strong margins. A cafe may increase visitor experience and dwell time but also add labor and inventory costs. Event rentals may produce meaningful revenue but depend on marketing, availability, staffing, and local demand. By reviewing the revenue breakdown, users can decide where to focus marketing, programming, staffing, and investment. It also helps users communicate to stakeholders that the gallery is not dependent on a single income source and has a diversified commercial strategy.
KPI Dashboard
The KPI dashboard focuses on performance metrics and benchmarks that help users evaluate whether the art gallery is operating in line with its goals. While the all-in-one dashboard summarizes the full model, the KPI dashboard is more focused on the metrics that management, investors, and lenders may monitor over time. These may include total visitors, average revenue per visitor, ticket revenue per attendee, workshop occupancy, event rental utilization, gross margin, EBITDA margin, payroll as a percentage of revenue, rent burden, marketing efficiency, cash runway, break-even progress, and return measures. The model may also allow users to compare projected performance against industry benchmarks or internal targets. This is useful because an art gallery’s success cannot be judged only by revenue. A gallery could attract many visitors but still struggle if average spend is low, staffing is too high, rent is burdensome, or ancillary revenue is underdeveloped. The KPI dashboard helps users identify where the business is strong and where it needs adjustment. It supports decision-making by showing whether marketing is converting into traffic, whether exhibitions are generating enough revenue, whether workshops are filling capacity, and whether the gallery is moving toward sustainable profitability. For stakeholder presentations, KPI reporting adds discipline and transparency, making it easier to explain progress and justify strategic changes.
Startup Costs and Operating Expense Budget
The startup costs and operating expense budget component helps users estimate the full investment required to open and run the gallery. Startup costs may include lease deposits, gallery renovation, exhibition lighting, security systems, climate control upgrades, signage, art transportation, installation, insurance setup, point-of-sale systems, website development, initial marketing, furniture, cafe or kitchen equipment, legal fees, licenses, and pre-opening payroll. Operating expenses may include rent, utilities, salaries, wages, payroll taxes, insurance, marketing, curator fees, maintenance, software subscriptions, professional services, supplies, cleaning, event staffing, and administrative costs. This section is useful because many gallery plans underestimate the cash required before revenue becomes consistent. A gallery may need to invest heavily before opening its doors, and it may also need working capital to cover early operating losses, seasonal dips, or delayed revenue from exhibitions and events. Inputs in this component allow users to customize costs by location, gallery size, concept, staffing plan, and growth strategy. Outputs may include total startup funding required, monthly operating expense forecasts, fixed versus variable cost analysis, and the impact of expense assumptions on cash flow and profitability. For budgeting, this section helps founders understand what they can afford. For funding preparation, it helps explain exactly how much capital is needed and how the money will be used. For ongoing management, it gives users a clearer view of cost control priorities.
Similar ProductsOther customers were also interested in...



 HenrySheykin
Casino Hotel Financial Model Excel Template
The Casino Hotel Financial Model helps users build a structured five-year forecast for an integrated... Read more

Golf Course Financial Model Excel Template
The Golf Course Financial Model Financial Model Template helps entrepreneurs, owners, consultants, a... Read more
Waterpark Business Plan Financial Model Excel Temp...
The Water Park Financial Model helps entrepreneurs, founders, consultants, analysts, and business ow... Read more
Trampoline Park Business Financial Model Excel Tem...
The Trampoline Park Financial Model helps entrepreneurs, founders, consultants, analysts, and busine... Read more
Museum Business Plan Financial Model Excel Templat...
The Museum Financial Model helps users turn a museum concept, expansion plan, or funding proposal in... Read more

 Giorgos
Scuba Diving Center – 5 Year Financial Model
Scuba diving affords an unparalleled experience with the underwater world. However, safe diving requ... Read more

Sky Diving Center – 5 Year Financial Model
Skydiving is the sport of jumping from an aircraft and performing acrobatic maneuvers in the air dur... Read more

Theme Park & Hotel Financial Model (Construct...
Financial model presenting a development scenario for a Theme Park & Hotel project including con... Read more

Golf & Entertainment Center – 5 Year Financi...
Financial Model providing an advanced 5-year financial plan for a startup or operating Golf & En... Read more

 City Finance
Indoor Golf Centre Finance Model
A comprehensive editable, MS Excel spreadsheet for tracking Indoor Golf Centre finances, integrates ... Read more
You must log in to submit a review.