
0 ITEMS

Foreign Languages School Financial Model Excel Template
The Language School Financial Model helps users turn a language academy, tutoring center, or language training concept into a structured financial forecast. Instead of starting from a blank spreadsheet, buyers can work from a ready-to-use financial model template built around the economics of a school operation, including tuition revenue, enrollment assumptions, class capacity, instructor costs, startup costs, operating expenses, cash flow, profitability, and long-term growth. It is designed to help users understand how student volume, pricing, course mix, staffing, and overhead can affect the financial performance of the business over time. This template is useful for entrepreneurs launching a new language school, business owners expanding an existing education center, consultants preparing client forecasts, analysts building investment cases, and founders creating business plans or funding documents. It gives users a practical way to organize the main assumptions behind the business, such as student enrollment, monthly fees, corporate training demand, private tutoring activity, payroll, rent, technology, marketing, and other running costs. By connecting these assumptions to projected financial statements, the model helps users evaluate whether the business can support its cost structure and reach sustainable profitability. The Language School Financial Model is built for financial planning and decision-making. Users can customize inputs, test revenue assumptions, estimate startup costs, review operating expenses, examine payroll needs, and forecast cash flow across a multi-year planning period. The template also supports profitability review, break-even analysis, scenario planning, and stakeholder reporting, making it easier to compare possible outcomes before committing capital or presenting the business to lenders, investors, partners, or internal decision-makers. Because the model is editable and formatted for Excel and Google Sheets, it can be adapted to different school sizes, tuition strategies, class formats, locations, and growth plans. Whether the user is planning beginner group classes, advanced courses, corporate training, private tutoring, or additional learning materials, the template provides a structured framework for building credible projections. It saves time, improves consistency, and helps users make more informed decisions about launch timing, funding requirements, staffing levels, pricing, marketing spend, and the path to profitability.
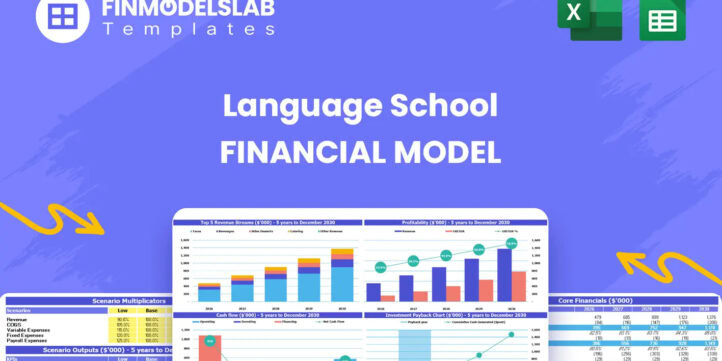


Financial Model Overview
The Language School Financial Model is a ready-to-use financial model template created for entrepreneurs, school owners, consultants, analysts, and founders who need a structured way to forecast the performance of a language academy or language training center. It helps users replace rough estimates with a connected planning tool that brings together tuition revenue, enrollment assumptions, class capacity, instructor costs, payroll, startup investment, operating expenses, cash flow, profitability, and investor-facing outputs. The model is especially useful for planning a new language school, expanding an existing education business, preparing a business plan, applying for financing, or reviewing whether a proposed school format can become financially sustainable. Because the template is editable, users can adjust assumptions such as course pricing, student volume, occupancy rates, corporate training demand, private tutoring activity, material sales, staffing plans, rent, software, marketing, and growth rates. The result is a practical financial planning framework that helps users evaluate the business from multiple angles, communicate the numbers clearly, and make better decisions before committing capital or presenting the opportunity to stakeholders.
All-in-One Dashboard
The all-in-one dashboard brings the most important inputs and outputs of the Language School Financial Model into one central view, giving users a fast way to understand the financial position of the business without searching through multiple worksheets. This component is designed to show core assumptions such as enrollment levels, tuition fees, course mix, occupancy, startup investment, and operating cost drivers alongside key outputs such as revenue, gross profit, EBITDA, net income, cash balance, margin performance, and return metrics. For a language school, this is particularly useful because many decisions depend on the relationship between filled seats, pricing, instructor capacity, and fixed overhead. The dashboard allows users to update assumptions and quickly see how those changes flow through the forecast. For example, increasing beginner class occupancy, adding a corporate training package, or adjusting the monthly fee for private tutoring can be reflected in the model’s projected results. This makes the dashboard valuable for founders who need to test business ideas, owners who want to monitor expansion plans, consultants preparing client deliverables, and investors reviewing the model at a high level. It also supports funding preparation by presenting a clean summary of the school’s financial story, including whether projected revenue is strong enough to cover salaries, rent, marketing, software, and other recurring expenses. Instead of relying on scattered calculations, users can use the dashboard as a decision-making control panel that connects assumptions, projections, and performance indicators in a clear and practical format.
Low Base High Scenario Analysis
The Low Base High scenario analysis section helps users test how the language school may perform under different market and operating conditions. Rather than relying on a single forecast, this component allows users to compare conservative, expected, and optimistic cases using changes in key business drivers such as student enrollment, class occupancy, tuition pricing, corporate training demand, private tutoring volume, marketing effectiveness, instructor costs, and expense growth. For a language school, scenario planning is important because early performance can vary depending on local competition, brand awareness, class schedules, seasonality, hiring availability, and the speed at which students enroll. The low case may show what happens if occupancy ramps up more slowly or marketing costs are higher than planned, while the base case reflects the user’s most realistic forecast and the high case can show the upside from stronger demand, premium pricing, or faster corporate client acquisition. This component helps users understand the range of possible revenue, cash flow, and profitability outcomes before making major decisions. It is also useful for risk management because it shows how much flexibility the business has if assumptions do not go as planned. Founders can use it to prepare contingency plans, investors can use it to evaluate downside exposure, and lenders can use it to assess whether the business can still meet obligations in a less favorable case. By comparing scenarios side by side, the model supports more disciplined planning and helps users avoid building a financial strategy around only the most optimistic outcome.
Professional Charts
The professional charts section turns the financial projections into visual reports that are easier to interpret, share, and present. This component may include charts for revenue growth, revenue stream mix, profit margins, cash flow trends, cost structure, EBITDA progression, enrollment growth, and other key performance measures. For a language school business plan, visual presentation matters because stakeholders often need to understand the financial story quickly. A chart showing the growth of tuition revenue across beginner, intermediate, advanced, corporate, and private tutoring streams can make the business model clearer than a long table of numbers. A cash flow chart can help identify whether the school maintains sufficient liquidity during launch and growth periods. A margin chart can show whether profitability improves as enrollment scales and fixed costs are spread across more students. These charts are useful for investor presentations, lender discussions, internal planning meetings, and management reviews because they translate complex forecasts into more accessible insights. Users can rely on the charts to communicate how the language school expects to grow, where revenue is coming from, how expenses behave, and when the business starts generating stronger profit. The section also helps users spot trends that may not be obvious in the raw financial statements, such as rising payroll intensity, pressure on margins, or dependence on one revenue stream. By including presentation-ready visuals, the model saves time and helps users create a more professional financial narrative for business planning and funding conversations.
ROE Components and DuPont Analysis
The ROE components and DuPont analysis section helps users understand the drivers behind return on equity rather than only viewing a single return percentage. This component breaks down return performance into underlying factors such as profitability, asset efficiency, and leverage, giving a more complete view of how the language school generates returns for owners or investors. In a language school context, return on equity may be influenced by tuition margins, the amount of startup capital required, the efficiency of classroom use, the cost of instructors and administration, and the level of financing used to support growth. A simple return figure can be useful, but the DuPont-style breakdown helps users see whether returns are being driven by strong operating performance, efficient use of assets, or financial structure. This is helpful for investors assessing the quality of the opportunity and for founders trying to improve financial performance. If ROE is weaker than expected, the user can investigate whether the issue comes from low profit margins, underused classroom capacity, excessive fixed assets, or an inefficient funding structure. If ROE is strong, the analysis helps explain why and whether that performance is sustainable. The section is also valuable for comparing different strategic options, such as opening additional classrooms, investing in online learning tools, hiring more instructors, or expanding corporate training. By breaking return performance into components, the model gives users a more analytical view of value creation and supports more informed decisions about growth, financing, and operational efficiency.
Revenue Inputs
The revenue inputs section is where users define the commercial engine of the language school. This component captures the assumptions that drive income, such as student enrollment by course type, class capacity, occupancy rates, tuition fees, course duration, private tutoring sessions, corporate training contracts, material sales, and annual growth rates. Because revenue in a language school depends heavily on the number of students served and the price charged for each learning format, this section is one of the most important parts of the model. Users can adjust assumptions for beginner group classes, intermediate and advanced courses, corporate programs, private tutoring, and learning materials to reflect their own business plan. The model can then calculate projected monthly and annual revenue based on the relationship between filled seats, pricing, and volume. This gives users a clearer view of how much income the school may generate at different enrollment levels and how sensitive the business is to pricing changes. The revenue inputs section is also useful for evaluating strategic decisions, such as whether to focus on high-volume group classes, premium one-on-one tutoring, business language training, exam preparation, or blended offerings. By documenting revenue assumptions in a structured way, the template makes the forecast more transparent and easier to review with investors, lenders, partners, or internal teams. It helps users move from general expectations about student demand to a measurable revenue plan that can be tested, refined, and connected to the rest of the financial model.
Bank-Ready Reports
The bank-ready reports section provides lender-friendly financial outputs that help users present the language school’s projected performance in a clear and credible format. This component typically consolidates the model’s financial statements and key planning outputs, including profit and loss projections, cash flow forecasts, balance sheet summaries, funding needs, profitability metrics, and repayment-related indicators. For users seeking a loan or other financing, this section is valuable because banks and lenders need to see more than revenue potential. They want to understand how the business will generate cash, cover operating costs, manage working capital, and maintain the ability to service debt. The reports can help show whether tuition collections, corporate training income, and other revenue streams are sufficient to support payroll, rent, marketing, technology, curriculum development, and other recurring expenses. They also make it easier to explain startup investment requirements, expected growth, margin development, and cash reserves. Because the reports are structured for professional review, users can include them in a business plan, loan application, investor package, or internal approval document. The section is especially useful for founders who may not have time to build financial statements from scratch but still need outputs that appear organized and complete. By connecting assumptions to lender-ready reports, the Language School Financial Model helps users demonstrate financial discipline, reduce uncertainty for financing partners, and support more productive conversations about capital requirements and business viability.
Revenue Breakdown
The revenue breakdown section provides a detailed view of how different income streams contribute to the overall financial forecast. For a language school, revenue may come from several sources, including beginner group classes, intermediate classes, advanced classes, corporate training programs, private tutoring sessions, and sales of books, software, or other learning materials. This component helps users separate these streams so they can see which offerings generate the most revenue, which are growing fastest, and which may carry the highest margin potential. The section may use inputs such as student counts, monthly fees, session volume, contract value, occupancy rates, price increases, and growth assumptions to calculate revenue by category over time. This is useful because a language school with diversified revenue streams may be more resilient than one that depends on a single class type. It also helps users assess the impact of strategic choices, such as investing more in corporate training, increasing private tutoring capacity, launching premium exam preparation courses, or selling proprietary learning materials. By analyzing revenue at a more granular level, users can make better decisions about marketing priorities, staffing, classroom scheduling, pricing, and product development. The revenue breakdown also improves the quality of investor and lender communication because it explains where sales are expected to come from instead of presenting only a total revenue figure. This component supports both planning and performance review by helping users identify the strongest commercial drivers of the language school business model.
KPI Dashboard
The KPI dashboard focuses on the performance indicators that matter most for managing and evaluating a language school. While the all-in-one dashboard provides a broad summary of financial inputs and outputs, the KPI dashboard gives users a more targeted view of operational and financial metrics such as enrollment growth, occupancy rates, revenue per student, average tuition, gross margin, EBITDA margin, cash balance, payroll as a percentage of revenue, customer acquisition efficiency, and return metrics. These indicators help users understand not only whether the school is profitable, but why it is performing the way it is. For example, revenue growth may look strong, but the KPI dashboard can show whether that growth is coming from higher enrollment, higher pricing, more private tutoring, or corporate training contracts. Similarly, if profit margins decline, users can review whether instructor pay, marketing costs, rent, or administrative expenses are increasing too quickly. This section is helpful for monthly management reviews, investor updates, board discussions, and internal decision-making because it highlights the numbers that should be monitored regularly. It can also support benchmarking by allowing users to compare projected performance against internal targets or industry expectations. For non-financial users, the KPI dashboard makes the model more accessible by converting detailed calculations into practical performance measures. It helps founders and managers stay focused on the operational levers that drive financial results and gives stakeholders a concise way to evaluate the health, efficiency, and scalability of the language school.
Similar ProductsOther customers were also interested in...

 HenrySheykin
Day Care Financial Model Excel Template
The Daycare Center Financial Model helps entrepreneurs, childcare founders, consultants, analysts, a... Read more
Martial Arts School Financial Model Excel Template
The Martial Arts School Financial Model helps founders, school owners, consultants, and business pla... Read more

Driving School Financial Model Excel Template
The Driving School Financial Model Template helps users turn a driving school concept into a structu... Read more

Martial Arts School Financial Model Excel Template
The Martial Arts School Financial Model helps founders, school owners, consultants, and business pla... Read more

Dog Obedience School Financial Model Excel Templat...
The Dog Training Financial Model helps users turn a dog training business concept into a structured ... Read more

Dance School Financial Model Excel Template
The Dance School Financial Model helps users turn a studio concept into a structured financial forec... Read more

Beauty School Financial Model Excel Template
The Beauty School Financial Model helps entrepreneurs, founders, consultants, and business planners ... Read more

Child Care Financial Model Excel Template
The Daycare Center Financial Model helps entrepreneurs, childcare founders, consultants, analysts, a... Read more
Babysitting Financial Model Excel Template
The Babysitting Service Financial Model helps entrepreneurs, founders, business owners, consultants,... Read more
Pre-School Care Financial Model Excel Template
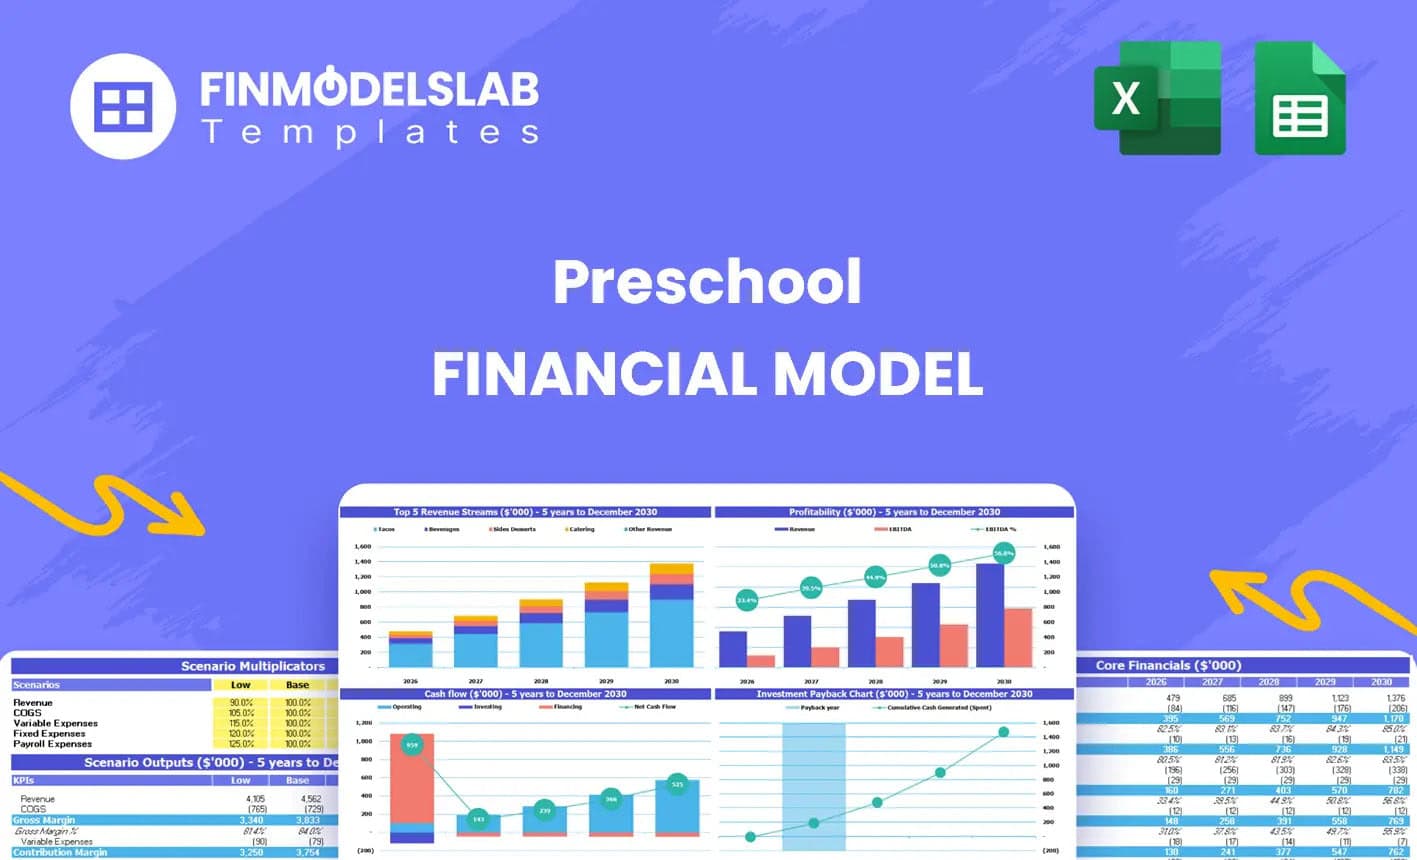
The Preschool Financial Model helps entrepreneurs, childcare founders, preschool owners, consultants... Read more
You must log in to submit a review.