
0 ITEMS

Dry Cleaner Financial Model Excel Template
The Dry Cleaning Service Financial Model helps entrepreneurs, business owners, consultants, analysts, and founders turn a dry cleaning business concept into a structured financial forecast. Instead of starting with a blank spreadsheet, users can work from a ready-to-use model designed around the operating realities of a dry cleaning service, including customer visits, service mix, garment cleaning, alterations, specialty services, corporate contracts, variable service costs, staffing, equipment investment, and recurring overhead. It supports practical financial planning by connecting revenue assumptions, startup costs, operating expenses, payroll, cash flow, and profitability in one editable model. This financial model template is useful for planning a new dry cleaner, expanding an existing laundry or garment care business, preparing a business plan, applying for financing, or presenting projections to investors and lenders. Users can adjust assumptions such as daily customer volume, average pricing, operating days, sales mix, cleaning solvent costs, delivery expenses, wages, facility costs, equipment purchases, and capital needs. The model then helps translate those inputs into financial statements, forecasts, charts, and decision-making outputs that make it easier to understand whether the business can generate sustainable profit. The template is built to support both strategic planning and day-to-day financial decision-making. It helps users review expected revenue growth, estimate the cost of opening and operating the business, evaluate payroll requirements, forecast monthly and annual cash flow, and assess profitability across multiple years. It also helps identify when the business may reach break-even, how much cash may be needed before operations stabilize, and which assumptions have the greatest impact on financial performance. This makes it valuable for testing different pricing strategies, evaluating service expansion, reviewing delivery economics, and planning for seasonal or demand-driven changes. With editable inputs, pre-built formulas, investor-ready formatting, and compatibility with Excel and Google Sheets, the Dry Cleaning Service Financial Model gives users a professional framework for building credible projections quickly. It is especially helpful for anyone preparing funding documents, internal budgets, lender presentations, or financial planning materials who needs clear outputs without building a complex model from scratch. By organizing the numbers in a structured way, the template helps users make better decisions about launch timing, funding requirements, staffing levels, profitability targets, and long-term growth.


Financial Model Overview
The Dry Cleaning Service Financial Model is a ready-to-use financial model template designed to help entrepreneurs, business owners, consultants, analysts, and founders plan the financial side of a dry cleaning operation with more structure and confidence. A dry cleaning business depends on a mix of recurring local demand, service pricing, operating capacity, equipment investment, payroll, cleaning supplies, delivery costs, and customer retention, so a simple revenue estimate is rarely enough. This template brings the key assumptions together in one editable model, allowing users to forecast revenue, expenses, cash flow, profit, funding needs, and break-even timing over a multi-year planning period. It is useful for building a business plan, preparing a loan application, evaluating a new location, presenting to investors, or improving the financial planning process for an existing garment care business. Instead of building formulas, statements, and charts from scratch, users can update the assumptions to match their own pricing, service mix, cost structure, launch budget, and growth strategy.
All-in-One Dashboard
The all-in-one dashboard gives users a central place to review the most important inputs and outputs of the Dry Cleaning Service Financial Model. It is designed to make the model easier to navigate by connecting operating assumptions with financial results in a clear, practical format. Users can work with assumptions such as customer visits, service pricing, sales mix, operating days, revenue growth, cost percentages, payroll levels, capital expenditures, and financing inputs, then see how those assumptions affect revenue, EBITDA, net income, cash flow, and other headline metrics. For a dry cleaning service, this is especially useful because many decisions are connected, such as whether higher daily visit volume can justify additional staff, delivery routes, or equipment. The dashboard helps users quickly understand the financial position of the business without searching through multiple worksheets. It is also useful for meetings with partners, lenders, investors, or advisors because it provides a concise view of the plan, highlighting whether the business concept appears financially viable and where additional attention may be needed.
Low Base High Scenario Analysis
The low, base, and high scenario analysis component helps users test how the dry cleaning business may perform under different operating conditions. Rather than relying on one fixed forecast, the model allows users to compare conservative, expected, and optimistic versions of the plan. Inputs may include daily customer visits, average order value, service mix, revenue growth, cleaning supply costs, delivery expenses, labor costs, marketing efficiency, and capital investment assumptions. The outputs help show how changes in these assumptions affect revenue, cash flow, profitability, funding requirements, and the timing of financial milestones. This is useful for dry cleaning service planning because demand can vary by location, customer habits, competition, corporate contracts, and marketing performance. A lower case may show what happens if customer acquisition is slower or operating costs are higher than expected, while a high case can show the upside of stronger volume, better route density, or higher adoption of premium services. This component supports better decision-making by helping users prepare contingency plans, set realistic targets, and understand which drivers matter most.
Professional Charts
The professional charts component converts the financial projections into visual outputs that are easier to review, explain, and present. Instead of relying only on rows of numbers, users can view trends in revenue, gross profit, EBITDA, net income, cash balance, operating expenses, and other core metrics through clean charts and graphs. For a dry cleaning service, visual reporting can make it easier to communicate how the business scales over time, how margins improve as volume grows, and how cash flow changes after the initial launch period. Inputs from the model, such as customer growth, service pricing, payroll, cost of goods sold, and capital expenditures, flow into the projected financial results and then into the charts. These outputs are useful for business plans, investor decks, lender discussions, internal reviews, and stakeholder presentations. Professional charts can also help non-financial users quickly identify trends, risks, and opportunities, such as whether operating expenses are growing faster than revenue or whether cash reserves remain healthy during the first year of operation.
ROE Components and DuPont Analysis
The ROE components and DuPont analysis section helps users understand what is driving return on equity in the dry cleaning business. Rather than viewing return on equity as a single percentage, this component breaks performance into underlying drivers such as profit margin, asset efficiency, and financial leverage. Inputs from the profit and loss statement, balance sheet, and financing structure help calculate how effectively the business converts sales into profit, how efficiently it uses assets such as equipment and vehicles, and how debt or equity financing affects investor returns. This is particularly useful for a dry cleaning service because the business may require significant upfront investment in machines, conveyor systems, vehicles, facility improvements, and working capital. The DuPont view helps users see whether returns are being improved by operational profitability, better use of assets, or the capital structure of the business. For owners and investors, this provides a deeper way to evaluate performance beyond sales growth alone. It can support funding conversations, performance reviews, expansion planning, and decisions about whether to invest in additional equipment, locations, or delivery capacity.
Revenue Inputs
The revenue inputs component is where users define the commercial assumptions that drive the top line of the Dry Cleaning Service Financial Model. This section may include daily customer visits, operating days per year, average prices, service categories, revenue growth assumptions, customer volume changes, and the percentage mix across garment cleaning, alterations, specialty services, wedding gown preservation, delivery services, and corporate contracts. For a dry cleaning business, revenue does not come from one uniform transaction, so separating the assumptions by service type makes the forecast more realistic. A standard garment cleaning order may be high volume, while alterations or specialty preservation may generate higher revenue per transaction with different labor requirements. Corporate contracts may add recurring volume and more predictable cash flow. By adjusting the revenue inputs, users can test pricing strategies, evaluate the impact of customer growth, model premium service adoption, and estimate how new services may change overall sales. This section is useful because it turns business strategy into measurable financial projections, helping users understand the revenue level needed to support payroll, rent, supplies, delivery, and equipment costs.
Bank-Ready Reports
The bank-ready reports component organizes the financial outputs into a format that is suitable for lenders, investors, advisors, and business plan reviewers. It brings together key statements and summaries such as the profit and loss statement, cash flow forecast, balance sheet, financing assumptions, profitability metrics, and repayment-related indicators. For a dry cleaning service seeking funding, this is important because lenders typically want to see more than a basic sales forecast. They want to understand startup investment, operating costs, expected profit, liquidity, debt service capacity, and the assumptions behind the projections. The model helps users present these elements in a clean and structured way, making it easier to support a loan application, funding request, or investor discussion. Inputs such as capital expenditure, working capital, customer volume, expenses, payroll, and financing terms flow into the reports, creating a connected view of the business. This component helps users save time when preparing professional documents and reduces the risk of presenting incomplete or inconsistent financial information to external stakeholders.
Revenue Breakdown
The revenue breakdown component gives users a detailed view of how total revenue is generated across different service lines in the dry cleaning business. Instead of showing only one total sales figure, this section separates the contribution of key revenue streams such as garment cleaning, alterations, specialty services, wedding preservation, corporate accounts, delivery-related services, and other add-on offerings. Inputs may include service prices, sales mix percentages, customer volumes, contract assumptions, and growth rates for each category. The resulting outputs help users identify which services produce the most revenue, which categories may offer higher margins, and how changes in customer behavior affect total sales. For example, a business may discover that everyday garment cleaning drives volume, while alterations and specialty services strengthen profitability. This section is valuable for pricing decisions, marketing planning, service expansion, and operational budgeting. It helps users decide where to focus promotional efforts, whether to hire specialized staff, how to structure corporate packages, and how to balance high-volume services with premium offerings that may improve overall financial performance.
KPI Dashboard
The KPI dashboard component highlights the key performance indicators that matter most for monitoring and benchmarking a dry cleaning service. It may include metrics such as revenue growth, gross margin, EBITDA margin, net profit margin, cash balance, customer volume, average revenue per visit, cost of goods sold as a percentage of revenue, payroll burden, return on equity, and other operational or financial ratios. These indicators help users move beyond the basic financial statements and evaluate the health of the business in a more actionable way. For a dry cleaning service, KPIs are useful because profitability depends on operational discipline as much as revenue growth. Cleaning solvent costs, delivery logistics, labor efficiency, facility overhead, and service mix can all influence margins. The KPI dashboard can help users compare projected performance against internal targets or industry benchmarks, making it easier to identify strengths and weaknesses in the business plan. It is useful for monthly reviews, investor updates, lender reporting, management meetings, and strategic planning because it condenses complex financial information into a focused performance summary.
Startup Costs and Funding Requirements
The startup costs and funding requirements component helps users estimate how much capital may be needed before the dry cleaning service can open and operate smoothly. This section may include dry cleaning machines, pressing equipment, conveyor systems, delivery vans, lease deposits, facility build-out, signage, point-of-sale systems, permits, licenses, initial inventory, cleaning supplies, launch marketing, insurance, professional fees, and working capital. It separates one-time launch costs from ongoing operating expenses so users can understand the difference between opening investment and recurring monthly obligations. Outputs may include total startup funding required, use of funds, timing of capital needs, and the amount of owner equity, debt, or investor financing needed to support the plan. This is especially important for dry cleaning businesses because equipment and facility setup can represent a large upfront commitment. By organizing startup costs clearly, the model helps users avoid underestimating launch capital, prepare more credible funding requests, and evaluate whether the business has enough cash to cover the early months before revenue stabilizes. It also supports decision-making around leasing versus buying equipment, purchasing vehicles, or phasing investments over time.
Break-Even Analysis
The break-even analysis component helps users identify when the dry cleaning service may generate enough revenue to cover its total costs. It connects revenue assumptions, service pricing, customer volume, fixed expenses, variable costs, payroll, and contribution margins to estimate the point at which the business moves from loss-making to profitable operations. For a dry cleaning service, break-even analysis is especially useful because owners need to understand how many customer visits, orders, contracts, or service transactions are required to support rent, wages, utilities, supplies, delivery costs, equipment-related expenses, and other overhead. Outputs may include the projected break-even month, required revenue level, required volume, and the sensitivity of break-even timing to pricing or cost changes. This information can guide launch strategy, marketing budgets, staffing decisions, and funding needs. It also helps users communicate a clear path to profitability in a business plan or investor presentation. By reviewing break-even timing, users can decide whether their assumptions are realistic, whether costs need to be reduced, or whether revenue targets should be adjusted before committing capital.
File types:
Excel – Single-User: .xlsx
Excel – Multi-User: .xlsx
Similar ProductsOther customers were also interested in...


 HenrySheykin
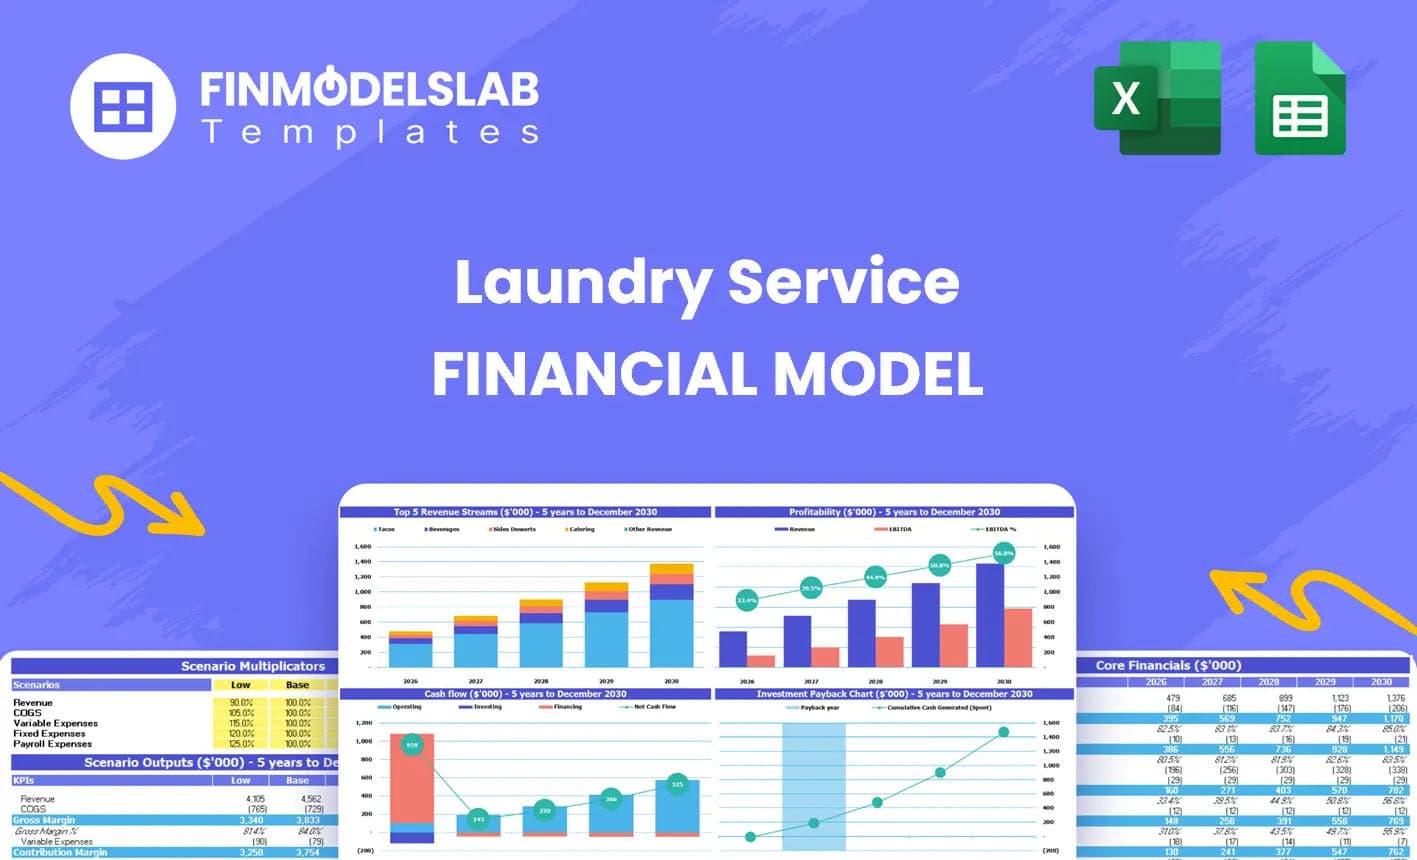
Laundry Financial Model Excel Template
The Laundry Service Financial Model helps entrepreneurs, business owners, consultants, analysts, and... Read more
 Jair
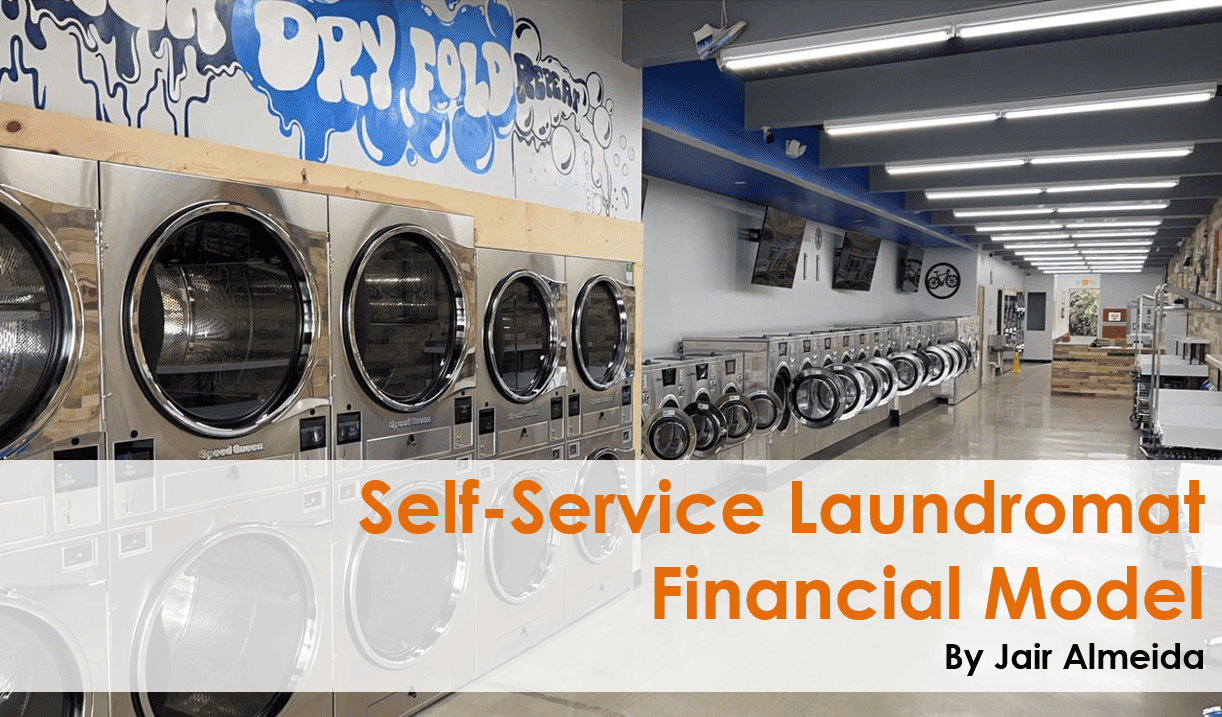
Self-Service Laundromat Financial Model and Budget...
The financial model for a self-service laundromat is a comprehensive tool that allows owners and inv... Read more

Dry Cleaning Financial Model and Budget Control Te...
The financial model for a dry cleaner is designed to help owners and investors in the industry make ... Read more

Cleaning Service Financial Model Excel Template
The Cleaning Service Financial Model helps entrepreneurs, founders, consultants, analysts, and busin... Read more

Pressure Washing Service Financial Model Excel Tem...
The Pressure Washing Financial Model helps users turn a pressure washing business idea into a struct... Read more

Carpet Cleaning Service Financial Model Excel Temp...
The Carpet Cleaning Service Financial Model helps entrepreneurs, business owners, consultants, analy... Read more

Plumber Financial Model Excel Template
The Plumbing Service Financial Model helps users turn a plumbing business idea, startup plan, or exp... Read more

Window Cleaning Service Financial Model Excel Temp...
The Window Cleaning Financial Model helps entrepreneurs, business owners, consultants, analysts, and... Read more

Lawn Care Financial Model Excel Template
The Lawn Care Service Financial Model helps entrepreneurs, business owners, consultants, analysts, a... Read more
You must log in to submit a review.