
0 ITEMS

Carpet Cleaning Service Financial Model Excel Template
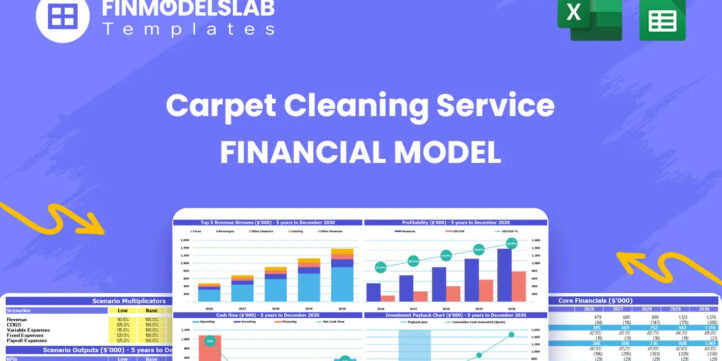
The Carpet Cleaning Service Financial Model helps entrepreneurs, business owners, consultants, analysts, and founders turn a carpet cleaning concept into a structured financial forecast. Instead of building a spreadsheet from scratch, users can work from a ready-made financial model template designed around the real drivers of a carpet cleaning business, including customer acquisition, service pricing, subscription packages, one-time premium services, add-on treatments, route-based operations, equipment investment, payroll, and recurring overhead. It supports business planning, funding preparation, internal budgeting, and practical decision-making by connecting revenue assumptions with operating expenses, startup costs, cash flow, profitability, and long-term growth. This template is useful for both new carpet cleaning startups and established cleaning service operators evaluating expansion, new service lines, or improved financial controls. Users can customize key inputs such as marketing budget, customer acquisition cost, pricing, service mix, technician staffing, payroll assumptions, supply costs, insurance, vehicle expenses, and other operating costs. The model helps clarify how many customers are needed, how pricing affects margins, how quickly revenue can scale, and whether the business has enough cash to support growth. It also helps users assess profitability, review break-even timing, and understand the financial impact of operational choices before committing capital. Built with editable assumptions and professional formatting, the Carpet Cleaning Service Financial Model is suitable for business plans, lender discussions, investor presentations, and management reviews. It includes structured outputs that help users review projected revenue, expenses, profit and loss, cash flow, return metrics, and performance indicators over a multi-year forecast period. Scenario planning features allow users to compare low, base, and high outcomes, making it easier to prepare for risks, test different growth strategies, and explain financial expectations to stakeholders. For buyers who need a practical, investor-ready planning tool, this template saves time while providing a clear framework for evaluating the economics of a carpet cleaning service. It helps organize assumptions, forecast results, identify funding needs, monitor cash flow, and make better decisions about pricing, staffing, marketing, equipment, and growth. Whether used by a founder preparing a launch plan, a consultant building a client forecast, or an owner analyzing expansion, the model provides a flexible and structured way to understand the financial potential of a carpet cleaning business.


![DuPont analysis diagram in Excel for ABC Company showing Revenue, Operating Expenses, Net Income and margins.]](https://www.efinancialmodels.com/wp-content/uploads/edd/2026/06/carpet-cleaning-financial-model-dupont-financialmodelslab_eacd161a-308a-4be5-b57a-8b8c82004637-scaled.jpg "carpet-cleaning-financial-model-dupont-financialmodelslab_eacd161a-308a-4be5-b57a-8b8c82004637 | eFinancialModels")


Financial Model Overview
The Carpet Cleaning Service Financial Model is a ready-to-use planning tool created to help users forecast, analyze, and communicate the financial performance of a carpet cleaning business. It brings the core economics of the business into one structured model, including customer acquisition, service pricing, recurring subscriptions, one-time premium jobs, add-on treatments, technician capacity, operating expenses, startup investment, cash flow, and profitability. For entrepreneurs, founders, business owners, consultants, analysts, and people preparing business plans or funding documents, the template provides a practical way to replace guesswork with a clear set of assumptions and projected outputs. The model is editable, professionally formatted, and designed to support up to five years of forecasting, making it useful for launch planning, expansion analysis, lender conversations, investor review, and ongoing decision-making. Instead of starting with a blank spreadsheet, users can adapt a structured framework to their local market, pricing strategy, staffing plan, and growth goals.
All-in-One Dashboard
The all-in-one dashboard gives users a centralized view of the most important inputs and outputs in the Carpet Cleaning Service Financial Model. This component is designed to make the model easier to manage by bringing together high-level assumptions such as revenue drivers, customer growth, pricing, cost structure, payroll, startup investment, and key financial results in a single view. For a carpet cleaning service, the dashboard is especially useful because the business depends on several connected variables, including how much is spent on marketing, how many customers are acquired, which service packages customers buy, how much labor is required, and how recurring expenses affect monthly cash flow. The dashboard helps users see how changes in these assumptions flow through the forecast and affect revenue, profit, cash position, and return metrics. It also supports faster review for owners, investors, lenders, and advisors because users do not have to search through multiple tabs to understand the overall financial picture. By combining core inputs and core outputs, this section acts as the control center of the model and helps users make planning decisions with better context.
Low, Base, and High Scenario Analysis
The low, base, and high scenario analysis section helps users compare different possible outcomes for the carpet cleaning business based on changes in key assumptions. A carpet cleaning service may perform differently depending on customer demand, marketing efficiency, local competition, pricing, fuel costs, technician productivity, and customer retention, so a single forecast is often not enough for serious planning. This component allows users to create more conservative, expected, and optimistic versions of the forecast by adjusting inputs such as marketing spend, customer acquisition cost, average service price, subscription adoption, add-on service sales, payroll growth, supply costs, or overhead. The outputs show how each scenario affects revenue, EBITDA, cash flow, profitability, and investment returns. This is useful for founders preparing for uncertainty, consultants presenting options to clients, and investors who want to understand downside risk and upside potential. Scenario analysis also supports strategic decision-making by showing what happens if the business grows more slowly than expected, if costs rise, or if a higher marketing budget accelerates customer acquisition. It turns the model into a flexible planning tool rather than a fixed projection.
Professional Charts
The professional charts section converts the financial forecast into visual outputs that are easier to understand, present, and discuss. In a carpet cleaning business plan or funding presentation, charts can help communicate the growth story more effectively than rows of numbers alone. This component may show trends such as revenue growth, gross profit, EBITDA, cash flow, expense categories, customer growth, margin improvement, or changes in key performance indicators over time. Because the model connects assumptions to outputs, the charts update as users revise pricing, customer volume, service mix, costs, or staffing plans. This makes the charts useful for testing assumptions and immediately seeing how the business trajectory changes. For entrepreneurs and business owners, visual reporting helps identify whether revenue is scaling fast enough to support overhead, whether profitability improves as the customer base grows, and whether cash balances remain adequate. For investors, lenders, and stakeholders, professionally formatted charts make the forecast more presentation-ready and easier to review. This section supports clearer communication, faster interpretation, and a more polished financial planning package.
ROE Components and DuPont Analysis
The ROE components section uses DuPont-style analysis to help users understand what is driving return on equity in the Carpet Cleaning Service Financial Model. Rather than looking only at the final return figure, this component breaks performance into the underlying drivers that influence investor returns and owner profitability. In a carpet cleaning service, return on equity may be affected by profit margin, asset efficiency, startup investment, equipment purchases, vehicle requirements, financing structure, and the ability to generate recurring revenue from subscriptions and repeat customers. The section helps users assess whether returns are being driven by healthy operating margins, strong revenue generation from invested assets, or financial leverage. Inputs may include net income, revenue, assets, equity, and other balance sheet or profitability figures generated by the forecast. The outputs help users evaluate whether the business is using capital efficiently and whether the projected returns are attractive enough for owners, investors, or funding partners. This is especially valuable when comparing different strategies, such as buying equipment upfront versus leasing, increasing marketing spend, adding vehicles, or expanding service capacity. By breaking ROE into its components, the model gives users a more detailed view of business quality and investment performance.
Revenue Inputs
The revenue inputs section is where users define the commercial assumptions that drive the carpet cleaning service forecast. This component focuses on the practical revenue model of the business, including customer acquisition, marketing budget, customer acquisition cost, pricing, service packages, subscription options, one-time premium services, and add-on treatments. For example, users can adjust assumptions around basic quarterly subscriptions, premium bi-monthly subscriptions, one-time premium cleaning jobs, stain treatments, upholstery services, or other service extensions that fit their market. The model may use inputs such as number of new customers, conversion rates, service frequency, average order value, customer retention, and price increases to calculate projected revenue over time. This section is useful because revenue in a carpet cleaning business is not only about the number of jobs completed; it is also about the mix between recurring customers, premium services, add-ons, and repeat bookings. By editing these assumptions, users can test whether their marketing plan can generate enough customer volume, whether their pricing is realistic, and whether their service mix can support profitability. The revenue inputs section creates the foundation for the rest of the forecast because payroll, supplies, cash flow, and returns all depend on the sales assumptions entered here.
Bank-Ready Reports
The bank-ready reports section organizes the financial outputs in a format suitable for lenders, investors, advisors, and other stakeholders who need to review the business from a professional finance perspective. A carpet cleaning service seeking funding may need to show more than projected sales; lenders often want to understand profit and loss, cash flow, balance sheet position, debt service capacity, startup costs, payback potential, and the assumptions behind the forecast. This component helps users present financial statements and summary reports in a clear, lender-friendly structure. The reports may include monthly and annual projections, revenue summaries, operating expense forecasts, EBITDA, net income, cash balances, capital investment, and financing needs. Because the model is built around editable assumptions, users can customize the forecast before exporting, sharing, or discussing it with a bank or funding partner. This section is useful for preparing business loan applications, investor materials, internal approvals, or strategic planning documents. It also helps users communicate their plan with more credibility by showing how revenue, costs, cash flow, and profitability connect across the forecast. For a service business that may require vehicles, professional equipment, software, insurance, and working capital, bank-ready reporting can make the funding conversation more structured and easier to support with numbers.
Revenue Breakdown
The revenue breakdown section provides a detailed view of how different revenue streams contribute to the total forecast. For a carpet cleaning business, this is especially important because income may come from multiple service categories rather than one simple line item. Users can analyze recurring subscription packages, premium bi-monthly plans, one-time carpet cleaning services, add-on treatments, commercial jobs, upholstery cleaning, stain removal, pet odor treatment, or other service offerings depending on how they customize the model. Inputs may include customer counts, pricing, purchase frequency, service mix percentages, retention, and growth assumptions. The outputs help show which revenue streams contribute the most to total sales, which services may offer stronger margins, and how the mix changes as the business grows. This component supports better planning because it allows users to understand whether the business is too dependent on one service type or whether recurring revenue can create more stable cash flow. It is also helpful for marketing and operational decisions, such as deciding which packages to promote, which add-ons to bundle, and where to focus technician training. A clear revenue breakdown can make the forecast more credible for investors and lenders because it shows that revenue projections are based on specific service drivers rather than a single broad estimate.
KPI Dashboard
The KPI dashboard tracks performance metrics that help users evaluate whether the carpet cleaning business is operating efficiently and progressing toward its financial goals. This component may include key indicators such as customer acquisition cost, customer lifetime value, gross margin, net margin, EBITDA margin, average revenue per customer, payback period, customer growth, revenue per technician, operating expense ratio, and cash flow performance. For a carpet cleaning service, KPIs are valuable because small changes in acquisition cost, retention, route efficiency, supply usage, or pricing can have a meaningful effect on profit. The dashboard helps users compare projected performance against internal targets or industry benchmarks and identify which areas need improvement. For example, if customer acquisition cost rises, the model can show how that affects profitability and payback. If gross margin improves through better supply purchasing or higher add-on sales, users can see the impact on EBITDA and cash flow. The KPI dashboard is useful for founders who want to manage the business after launch, consultants preparing performance reviews, and investors who want to assess the strength of the operating model. By summarizing performance metrics in one place, this section helps turn the forecast into an ongoing management tool rather than only a startup planning document.
Startup Cost Breakdown
The startup cost breakdown section organizes the initial investment required to launch or expand a carpet cleaning service. This component helps users estimate the capital needed before the business can operate at full capacity and begin generating consistent revenue. Typical inputs may include vehicle purchase or lease costs, vehicle setup, carpet cleaning machines, hoses, extraction equipment, cleaning tools, supplies, uniforms, insurance deposits, licenses, software, mobile app setup, office furniture, branding, website development, initial marketing, legal expenses, and working capital reserves. The model can also be customized for different launch strategies, such as starting with one vehicle and a lean team, purchasing professional-grade equipment upfront, leasing equipment to reduce initial cash outlay, or adding a second vehicle for expansion. The outputs help users understand total startup funding needs, timing of cash requirements, and how initial investments affect depreciation, cash flow, and payback. This section is useful for business planning because underestimating launch costs can create early liquidity problems, especially in a service business that relies on vehicles, tools, trained technicians, and marketing before revenue ramps up. For lenders and investors, a detailed startup cost breakdown demonstrates that the user has considered the operational requirements of launching a real carpet cleaning service and can justify the amount of funding requested.
Break-Even Analysis
The break-even analysis section helps users identify when the carpet cleaning business is expected to cover its total costs and begin generating profit. This component connects revenue assumptions, fixed expenses, variable costs, payroll, marketing spend, service pricing, customer volume, and gross margin to determine the level of sales needed to reach break-even. For a carpet cleaning service, break-even timing is an important planning metric because the business may require upfront investment in vehicles, equipment, supplies, insurance, and marketing before revenue becomes stable. Inputs may include average service price, number of customers, job frequency, cost of cleaning supplies, technician wages, fuel costs, software subscriptions, rent, insurance, and other overhead. The outputs may show the break-even month, required revenue level, required customer volume, and the effect of different pricing or cost scenarios on profitability. This section is useful for founders deciding how much capital to raise, owners evaluating whether to expand, and lenders assessing how quickly the business can become self-sustaining. It also helps users test practical decisions, such as increasing prices, bundling add-on services, reducing overhead, improving technician scheduling, or lowering customer acquisition costs.
File types:
Excel – Single-User: .xlsx
Excel – Multi-User: .xlsx
Similar ProductsOther customers were also interested in...


 HenrySheykin
Laundry Financial Model Excel Template
The Laundry Service Financial Model helps entrepreneurs, business owners, consultants, analysts, and... Read more

Cleaning Service Financial Model Excel Template
The Cleaning Service Financial Model helps entrepreneurs, founders, consultants, analysts, and busin... Read more

Pressure Washing Service Financial Model Excel Tem...
The Pressure Washing Financial Model helps users turn a pressure washing business idea into a struct... Read more

Plumber Financial Model Excel Template
The Plumbing Service Financial Model helps users turn a plumbing business idea, startup plan, or exp... Read more
Dry Cleaner Financial Model Excel Template
The Dry Cleaning Service Financial Model helps entrepreneurs, business owners, consultants, analysts... Read more

Window Cleaning Service Financial Model Excel Temp...
The Window Cleaning Financial Model helps entrepreneurs, business owners, consultants, analysts, and... Read more

Lawn Care Financial Model Excel Template
The Lawn Care Service Financial Model helps entrepreneurs, business owners, consultants, analysts, a... Read more

Handyman Financial Model Excel Template
The Handyman Service Financial Model helps entrepreneurs, business owners, consultants, and analysts... Read more

 eFinancialModels
Gasoline and EV Charging Station Financial Model
Investors can assess the viability of setting up and investing in gasoline stations with a charging ... Read more
You must log in to submit a review.