
0 ITEMS

Kids Store Financial Model Excel Template
The Kids Store Financial Model Financial Model Template helps entrepreneurs, retail founders, business owners, consultants, and analysts turn a children’s retail concept into a structured five-year financial forecast. Instead of starting from a blank spreadsheet, users get a ready-to-use planning tool designed around the economics of a kids store, including product sales, customer traffic, conversion rates, repeat purchases, staffing, inventory-related costs, operating expenses, cash flow, and profitability. It is built to support practical financial planning for a children’s boutique, toy shop, baby products store, or multi-category kids retail business. This template is especially useful for preparing business plans, funding documents, lender discussions, investor presentations, and internal decision-making. It helps users define revenue assumptions, estimate startup costs, model payroll, project monthly and annual expenses, and understand how changes in traffic, pricing, margins, and customer behavior affect the store’s financial outlook. The model gives buyers a clearer view of what it may take to launch, operate, and grow a kids store while managing the risks that often come with retail inventory, rent, seasonal demand, and early-stage cash burn. The Kids Store Financial Model is designed to connect assumptions with financial outputs, so users can see how their inputs flow through the dashboard, profit and loss statement, cash flow forecast, balance sheet, charts, scenarios, and performance metrics. It provides a practical framework for evaluating whether the store can reach sustainable profitability, how much funding may be required, when the business may break even, and which drivers have the greatest impact on results. Users can adjust the model to reflect their own location, product mix, supplier terms, staffing plan, marketing budget, and growth expectations. Whether you are launching a new kids store, expanding an existing children’s retail operation, advising a client, or building a funding-ready business plan, this financial model template gives you a structured way to test the numbers before making major decisions. It helps reduce guesswork, organize assumptions, compare scenarios, review cash flow needs, and communicate the business case more professionally to partners, lenders, investors, and stakeholders.
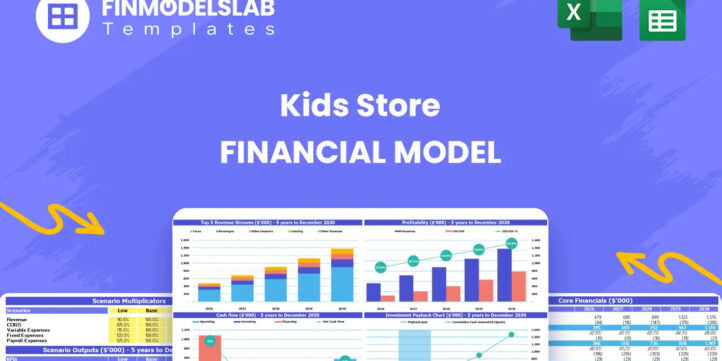


Financial Model Overview
The Kids Store Financial Model Financial Model Template is a ready-to-use planning tool built for entrepreneurs, children’s retail founders, business owners, consultants, and analysts who need a structured way to forecast the financial performance of a kids store. It is designed around the practical economics of a children’s retail business, where sales depend on store traffic, customer conversion, repeat purchasing, product category mix, pricing, inventory costs, payroll, rent, marketing, and working capital. The model helps users move from assumptions to complete financial outputs, including revenue forecasts, expenses, profitability, cash flow, balance sheet projections, charts, reports, and decision-ready metrics. Whether you are opening a toy shop, baby products store, children’s clothing boutique, gift store, or multi-category kids retail concept, this template gives you a clear framework for estimating startup needs, planning operations, testing scenarios, and preparing funding-ready financial documents. It is editable, practical, and structured to help users understand what drives results, where risks may appear, and how the business can progress toward sustainable profitability over a five-year forecast period.
All-in-One Dashboard
The all-in-one dashboard brings the most important inputs and outputs of the Kids Store Financial Model into one central planning view, giving users a fast way to understand the store’s projected financial position without digging through every individual schedule. This section typically connects key assumptions such as daily visitor traffic, conversion rates, repeat customer behavior, average transaction value, product mix, margins, operating expenses, payroll, startup investment, and financing assumptions with the model’s core results. It helps generate a high-level view of sales, gross profit, EBITDA, net income, cash balance, funding needs, payback timing, and other critical performance indicators. For a kids store, this is especially useful because owners need to monitor both front-end sales drivers and back-end cost pressures, including inventory, rent, staffing, and seasonal fluctuations. The dashboard supports faster decision-making by showing how the business is expected to perform over time, which assumptions matter most, and whether the plan is financially realistic. It can also be used in meetings with investors, lenders, partners, or advisors because it summarizes the financial story in a clean and accessible format. Instead of presenting isolated numbers, users can show a connected view of revenue growth, profitability, cash flow, and capital requirements, making the financial plan easier to explain and defend.
Low, Base, and High Scenario Analysis
The low, base, and high scenario analysis section helps users compare different versions of the kids store business plan under changing market and operating conditions. A base case may reflect the expected plan, while a low case can model weaker traffic, lower conversion rates, slower repeat purchasing, higher inventory costs, or more conservative pricing. A high case can show the impact of stronger customer demand, improved store productivity, better margins, or faster growth in repeat sales. This component uses adjustable assumptions that may include daily visitors, buyer conversion, average order value, product category mix, cost of goods sold, payroll levels, rent, marketing spend, and other operating expenses. The output helps users see how each scenario affects revenue, gross profit, EBITDA, cash flow, break-even timing, and funding requirements. For a children’s retail store, scenario planning is valuable because performance can be influenced by location quality, seasonality, local competition, purchasing power, inventory selection, and customer loyalty. This section allows entrepreneurs and analysts to stress-test the plan before launch or expansion, identify downside risks, and quantify upside potential. It is also helpful for investor and lender discussions because it shows that the business plan has been tested beyond a single optimistic forecast. By comparing low, base, and high outcomes, users can make more informed decisions about store size, staffing, inventory purchases, marketing budgets, and the amount of capital needed to operate safely.
Professional Charts
The professional charts section converts the financial model’s outputs into presentation-ready visuals that help users communicate the performance of the kids store clearly and efficiently. Rather than relying only on rows of numbers, this component displays trends in revenue, expenses, profit, EBITDA, cash flow, margins, and other important financial metrics over the forecast period. It may also visualize comparisons between scenarios, changes in revenue streams, cost structure, cash balance movement, or profitability milestones. For a kids store, charts are useful because the financial picture often depends on multiple interacting factors, such as increasing visitor traffic, improving conversion, shifting product mix, managing inventory cost, and controlling fixed expenses. Visual reports make it easier to identify whether revenue growth is strong enough to cover overhead, whether margins are improving, and whether cash reserves remain adequate during early-stage losses or expansion periods. This section is particularly valuable for business plans, pitch decks, internal reviews, and stakeholder presentations, where clarity and speed matter. Investors and lenders often want to understand the direction of the business at a glance, and professional charts help translate detailed spreadsheet calculations into a more accessible financial narrative. By using pre-built charts, buyers save time and can focus on interpreting the results, refining assumptions, and preparing a more polished presentation for funding, planning, or operational decision-making.
ROE Components and DuPont Analysis
The ROE components and DuPont analysis section helps users understand the deeper drivers behind return on equity rather than looking at profitability in isolation. This component breaks return on equity into underlying factors such as profit margin, asset efficiency, and financial leverage, helping users see whether returns are being driven by strong operating performance, efficient use of assets, or the financing structure of the business. For a kids store, this can be especially useful because retail profitability depends on both margins and how effectively the business turns inventory, fixtures, store assets, and working capital into sales. Inputs may include net income, revenue, total assets, equity, debt, inventory-related balances, and other balance sheet items that influence return metrics. The outputs help users evaluate whether the store is generating an acceptable return for owners or investors and where improvements may be needed. For example, weak ROE may come from low net margins, slow inventory turnover, excessive startup investment, or too much capital tied up in operating assets. A DuPont-style view gives business owners and analysts a more diagnostic way to assess performance, making it useful for strategic planning, investor conversations, and operational improvement. Instead of simply asking whether the store is profitable, users can ask how efficiently the business converts sales into profit, assets into revenue, and equity investment into returns. This supports better decisions about pricing, cost control, inventory management, financing, and growth strategy.
Revenue Inputs
The revenue inputs section is where users define the commercial assumptions that drive the kids store’s sales forecast. This component may include daily visitor traffic, weekly or monthly traffic patterns, conversion rates from visitors to buyers, repeat customer assumptions, average transaction values, category-level pricing, product mix percentages, and growth rates over the forecast period. Because a children’s retail store typically earns revenue from multiple product categories such as toys, clothing, accessories, gift sets, baby items, or seasonal products, the revenue inputs section allows users to structure sales around the actual drivers of the business rather than using a generic revenue line. The model can use these assumptions to calculate total customers, transactions, product-level sales, revenue growth, and monthly or annual sales projections. This section is useful for financial planning because it forces users to think through how the store will actually generate demand, how many visitors must enter the store, what percentage must buy, and how much each customer is expected to spend. It also helps users test whether their pricing and sales mix are realistic given the local market, target customer, product positioning, and store capacity. For funding preparation, clearly documented revenue assumptions make the financial forecast more credible because stakeholders can trace sales projections back to operational drivers. By editing these inputs, users can quickly compare the effect of higher foot traffic, stronger conversion, premium product pricing, increased repeat purchases, or changes in product mix on the overall financial outcome.
Bank-Ready Reports
The bank-ready reports section provides structured financial outputs that are suitable for lenders, investors, advisors, and business plan readers who need to evaluate the kids store from a financing perspective. This component typically includes professional financial statements such as the profit and loss statement, cash flow statement, and balance sheet, along with supporting summaries that show revenue, expenses, margins, debt capacity, cash position, and profitability over time. These reports are designed to help users present a complete financial picture rather than isolated assumptions. For a kids store seeking startup capital, expansion financing, a working capital line, or inventory funding, bank-ready reporting is important because lenders want to understand repayment ability, cash flow timing, cost structure, and the reliability of the forecast. Inputs feeding this section may include revenue assumptions, cost of goods sold, payroll, rent, marketing, operating expenses, taxes, capital expenditures, debt financing, and owner investment. The outputs help users explain how much funding is needed, how the funds will be used, whether the store can support ongoing expenses, and when the business may generate enough cash to meet obligations. This section is also useful for internal planning because it consolidates the model into familiar financial statement formats, making it easier to review performance, identify risks, and compare projections with actual results once the store is operating. Clean, organized reports can improve the professionalism of a business plan and help stakeholders evaluate the financial viability of the children’s retail concept.
Revenue Breakdown
The revenue breakdown section provides a more detailed view of how total sales are generated across the different revenue streams of a kids store. Instead of treating revenue as one combined number, this component separates sales by product category, such as toys, clothing, accessories, gift sets, baby products, seasonal merchandise, or other user-defined categories. It may use assumptions for price points, category share, unit volume, customer purchase behavior, and growth rates to calculate the contribution of each revenue stream to total sales. For a children’s retail business, this level of detail is valuable because not all products have the same margins, turnover rates, seasonality, or customer appeal. Toys may drive traffic, clothing may create repeat purchases, accessories may improve basket size, and gift sets may perform strongly around holidays or birthdays. The revenue breakdown helps users understand which categories are expected to generate the most revenue and which may contribute the strongest profitability once cost of goods sold is considered. It also supports decisions about inventory purchasing, store layout, supplier negotiations, merchandising, marketing campaigns, and promotional strategy. For business planning and funding documents, a detailed revenue breakdown makes the forecast more transparent and easier to defend because readers can see the underlying sales logic. Users can adjust the mix to test different store concepts, such as a premium boutique, value-focused kids shop, toy-led retail store, or hybrid children’s products business with both physical and online sales potential.
KPI Dashboard
The KPI dashboard section tracks the key performance indicators that help users measure whether the kids store is operating according to plan. This component may include metrics such as daily visitors, conversion rate, repeat customer percentage, average transaction value, gross margin, EBITDA margin, payroll as a percentage of revenue, rent burden, inventory-related efficiency, cash balance, customer growth, revenue per customer, and break-even progress. It helps translate the model’s detailed financial calculations into practical operating metrics that business owners can monitor regularly. For a children’s retail store, KPIs are important because success is not determined by sales alone. A store may generate revenue but still struggle if margins are weak, inventory costs are too high, staffing is inefficient, or marketing spend does not produce enough customer traffic. The KPI dashboard gives users a way to connect operational decisions with financial results, making it easier to see where the store is performing well and where improvements are needed. It can also support benchmarking by comparing projected performance against industry standards or target ranges. For entrepreneurs and consultants, this section is useful during planning because it helps define measurable goals before launch. For existing store owners, it can support performance tracking and management reviews. For investors and lenders, KPI reporting adds credibility because it shows that the business plan is grounded in measurable retail drivers rather than only broad revenue and profit assumptions.
Startup Cost and Funding Requirements
The startup cost and funding requirements section helps users estimate the initial investment needed to open or expand a kids store and understand how that capital will be allocated. This component may include store build-out, fixtures, shelving, point-of-sale systems, computer equipment, signage, licenses, deposits, initial inventory stock, e-commerce setup, pre-opening marketing, professional fees, insurance, and working capital reserves. It separates one-time launch expenses from ongoing monthly operating costs, helping users avoid underestimating the cash required before the store begins generating stable revenue.
Excel – Single-User: .xlsx
Excel – Multi-User: .xlsx
Similar ProductsOther customers were also interested in...
 HenrySheykin
Grocery Store Financial Model Excel Template
The Grocery Store Financial Model helps entrepreneurs, founders, consultants, analysts, and retail b... Read more
Coffee Shop Financial Model Excel Template
The Coffee Shop Financial Model helps entrepreneurs, founders, business owners, consultants, and ana... Read more
Online Clothing Store Financial Model Excel Templa...
The Online Clothing Store Financial Model helps founders, entrepreneurs, business owners, consultant... Read more
Spa Financial Model Excel Template
The Spa Financial Model helps entrepreneurs, spa owners, consultants, analysts, and business planner... Read more
Bar Financial Model Excel Template
The Bar Financial Model Financial Model Template helps entrepreneurs, bar owners, consultants, analy... Read more
Bakery Financial Model Excel Template
The Bakery Financial Model helps entrepreneurs, bakery owners, consultants, analysts, and business p... Read more
Pizzeria Financial Model Excel Template
The Pizza Restaurant Financial Model Template helps entrepreneurs, restaurant owners, consultants, a... Read more
Clothing Store Financial Model Excel Template
The Clothing Store Financial Model helps turn a retail apparel concept into a structured financial f... Read more
Bike Shop Financial Model Excel Template
The Bicycle Shop Financial Model helps entrepreneurs, business owners, consultants, analysts, and fo... Read more
Car Wash Service Financial Model Excel Template
The Car Wash Financial Model is a ready-to-use financial model template designed to help entrepreneu... Read more
You must log in to submit a review.